• Trade
  • Markets
  • Copy
  • Contests
  • News
  • 24/7
  • Calendar
  • Q&A
  • Chats
Trending
Screeners
SYMBOL
LAST
BID
ASK
HIGH
LOW
NET CHG.
%CHG.
SPREAD
SPX
S&P 500 Index
6857.13
6857.13
6857.13
6865.94
6827.13
+7.41
+ 0.11%
--
DJI
Dow Jones Industrial Average
47850.93
47850.93
47850.93
48049.72
47692.96
-31.96
-0.07%
--
IXIC
NASDAQ Composite Index
23505.13
23505.13
23505.13
23528.53
23372.33
+51.04
+ 0.22%
--
USDX
US Dollar Index
98.860
98.940
98.860
98.980
98.850
-0.120
-0.12%
--
EURUSD
Euro / US Dollar
1.16568
1.16575
1.16568
1.16577
1.16408
+0.00123
+ 0.11%
--
GBPUSD
Pound Sterling / US Dollar
1.33436
1.33445
1.33436
1.33446
1.33165
+0.00165
+ 0.12%
--
XAUUSD
Gold / US Dollar
4219.53
4219.94
4219.53
4221.12
4194.54
+12.36
+ 0.29%
--
WTI
Light Sweet Crude Oil
59.341
59.378
59.341
59.469
59.187
-0.042
-0.07%
--

Community Accounts

Signal Accounts
--
Profit Accounts
--
Loss Accounts
--
View More

Become a signal provider

Sell trading signals to earn additional income

View More

Guide to Copy Trading

Get started with ease and confidence

View More

Signal Accounts for Members

All Signal Accounts

Best Return
  • Best Return
  • Best P/L
  • Best MDD
Past 1W
  • Past 1W
  • Past 1M
  • Past 1Y

All Contests

  • All
  • Trump Updates
  • Recommend
  • Stocks
  • Cryptocurrencies
  • Central Banks
  • Featured News
Top News Only
Share

Dollar/Yen Down 0.33% To 154.61

Share

Kremlin Says No Plans For Putin-Trump Call For Now

Share

Kremlin Says Moscow Is Waiting For USA Reaction After Putin-Witkoff Meeting

Share

Cctv - China, France: Say Both Sides Support All Efforts For A Ceasefire, Restore Peace According To Intl Law

Share

[Chinese Ambassador To The US Xie Feng Hopes Chinese And American Business Communities Will Focus On Three Lists] On December 4, Chinese Ambassador To The US Xie Feng Delivered A Speech At The China-US Economic And Trade Cooperation Forum Jointly Hosted By The China Council For The Promotion Of International Trade And The Meridian International Center. Xie Feng Said That In November 2026, China Will Host The APEC Leaders' Informal Meeting For The Third Time In Shenzhen, Guangdong Province. In December 2026, The United States Will Also Host The G20 Meeting. Regarding How Chinese And American Business Communities Can Seize These Opportunities, He Suggested Focusing On Three Lists: First, Continue To Expand The Dialogue List; Second, Continuously Lengthen The Cooperation List; And Third, Constantly Reduce The Problem List

Share

India's Nifty Financial Services Index Extends Gains, Last Up 0.75%

Share

Eni : Jp Morgan Cuts To Underweight From Overweight

Share

Cctv - China, France: Signed Protocol On Sanitary, Phytosanitary Requirements For Export Of French Alfalfa Grass

Share

India's NIFTY IT Index Last Up 1.3%

Share

India's Nifty 50 Index Rises 0.35%

Share

Israel Sets 2026 Defence Budget At $34 Billion

Share

Russia Says Azov Sea's Port Of Temryuk Damaged In Ukrainian Attack

Share

Israel's Defense Budget For 2026 Will Be 112 Billion Israeli Shekels - Defense Minister Office

Share

One India Rate Panel Member Ram Singh Was Of View That Stance Should Be Changed To 'Accommodative' From 'Neutral' - Monetary Policy Committee Statement

Share

Reserve Bank Of India Chief: Will Continue To Meet Productive Needs Of Economy In Proactive Manner

Share

Reserve Bank Of India Chief: System Level Financial Parameters Of Nbfcs Sound

Share

Reserve Bank Of India Chief: Dollar Rupee Swap To Be For 3 Years, To Be Conducted This Month

Share

India's Nifty Realty Index Extend Gains, Last Up 1.4%

Share

India's Nifty Psu Bank Index Rises 1%

Share

Reserve Bank Of India Chief: Commited To Providing Sufficient Durable Liquidity

TIME
ACT
FCST
PREV
Turkey Trade Balance

A:--

F: --

P: --

Germany Construction PMI (SA) (Nov)

A:--

F: --

P: --

Euro Zone IHS Markit Construction PMI (Nov)

A:--

F: --

P: --

Italy IHS Markit Construction PMI (Nov)

A:--

F: --

P: --

U.K. Markit/CIPS Construction PMI (Nov)

A:--

F: --

P: --

France 10-Year OAT Auction Avg. Yield

A:--

F: --

P: --

Euro Zone Retail Sales MoM (Oct)

A:--

F: --

P: --

Euro Zone Retail Sales YoY (Oct)

A:--

F: --

P: --

Brazil GDP YoY (Q3)

A:--

F: --

P: --

U.S. Challenger Job Cuts (Nov)

A:--

F: --

P: --

U.S. Challenger Job Cuts MoM (Nov)

A:--

F: --

P: --

U.S. Challenger Job Cuts YoY (Nov)

A:--

F: --

P: --

U.S. Initial Jobless Claims 4-Week Avg. (SA)

A:--

F: --

P: --

U.S. Weekly Initial Jobless Claims (SA)

A:--

F: --

P: --

U.S. Weekly Continued Jobless Claims (SA)

A:--

F: --

P: --

Canada Ivey PMI (SA) (Nov)

A:--

F: --

P: --

Canada Ivey PMI (Not SA) (Nov)

A:--

F: --

P: --

U.S. Non-Defense Capital Durable Goods Orders Revised MoM (Excl. Aircraft) (SA) (Sept)

A:--

F: --

P: --
U.S. Factory Orders MoM (Excl. Transport) (Sept)

A:--

F: --

P: --

U.S. Factory Orders MoM (Sept)

A:--

F: --

P: --

U.S. Factory Orders MoM (Excl. Defense) (Sept)

A:--

F: --

P: --

U.S. EIA Weekly Natural Gas Stocks Change

A:--

F: --

P: --

Saudi Arabia Crude Oil Production

A:--

F: --

P: --

U.S. Weekly Treasuries Held by Foreign Central Banks

A:--

F: --

P: --

Japan Foreign Exchange Reserves (Nov)

A:--

F: --

P: --

India Repo Rate

A:--

F: --

P: --

India Benchmark Interest Rate

A:--

F: --

P: --

India Reverse Repo Rate

A:--

F: --

P: --

India Cash Reserve Ratio

A:--

F: --

P: --

Japan Leading Indicators Prelim (Oct)

A:--

F: --

P: --

U.K. Halifax House Price Index YoY (SA) (Nov)

--

F: --

P: --

U.K. Halifax House Price Index MoM (SA) (Nov)

--

F: --

P: --

France Current Account (Not SA) (Oct)

--

F: --

P: --

France Trade Balance (SA) (Oct)

--

F: --

P: --

France Industrial Output MoM (SA) (Oct)

--

F: --

P: --

Italy Retail Sales MoM (SA) (Oct)

--

F: --

P: --

Euro Zone Employment YoY (SA) (Q3)

--

F: --

P: --

Euro Zone GDP Final YoY (Q3)

--

F: --

P: --

Euro Zone GDP Final QoQ (Q3)

--

F: --

P: --

Euro Zone Employment Final QoQ (SA) (Q3)

--

F: --

P: --

Euro Zone Employment Final (SA) (Q3)

--

F: --

P: --
Brazil PPI MoM (Oct)

--

F: --

P: --

Mexico Consumer Confidence Index (Nov)

--

F: --

P: --

Canada Unemployment Rate (SA) (Nov)

--

F: --

P: --

Canada Labor Force Participation Rate (SA) (Nov)

--

F: --

P: --

Canada Employment (SA) (Nov)

--

F: --

P: --

Canada Part-Time Employment (SA) (Nov)

--

F: --

P: --

Canada Full-time Employment (SA) (Nov)

--

F: --

P: --

U.S. Dallas Fed PCE Price Index YoY (Sept)

--

F: --

P: --

U.S. PCE Price Index YoY (SA) (Sept)

--

F: --

P: --

U.S. PCE Price Index MoM (Sept)

--

F: --

P: --

U.S. Personal Outlays MoM (SA) (Sept)

--

F: --

P: --

U.S. Core PCE Price Index MoM (Sept)

--

F: --

P: --

U.S. UMich 5-Year-Ahead Inflation Expectations Prelim YoY (Dec)

--

F: --

P: --

U.S. Core PCE Price Index YoY (Sept)

--

F: --

P: --

U.S. 5-10 Year-Ahead Inflation Expectations (Dec)

--

F: --

P: --

U.S. UMich Current Economic Conditions Index Prelim (Dec)

--

F: --

P: --

U.S. UMich Consumer Sentiment Index Prelim (Dec)

--

F: --

P: --

U.S. UMich 1-Year-Ahead Inflation Expectations Prelim (Dec)

--

F: --

P: --

U.S. UMich Consumer Expectations Index Prelim (Dec)

--

F: --

P: --

Q&A with Experts
    • All
    • Chatrooms
    • Groups
    • Friends
    Connecting
    .
    .
    .
    Type here...
    Add Symbol or Code

      No matching data

      All
      Trump Updates
      Recommend
      Stocks
      Cryptocurrencies
      Central Banks
      Featured News
      • All
      • Russia-Ukraine Conflict
      • Middle East Flashpoint
      • All
      • Russia-Ukraine Conflict
      • Middle East Flashpoint
      Search
      Products

      Charts Free Forever

      Chats Q&A with Experts
      Screeners Economic Calendar Data Tools
      Membership Features
      Data Warehouse Market Trends Institutional Data Policy Rates Macro

      Market Trends

      Market Sentiment Order Book Forex Correlations

      Top Indicators

      Charts Free Forever
      Markets

      News

      News Analysis 24/7 Columns Education
      From Institutions From Analysts
      Topics Columnists

      Latest Views

      Latest Views

      Trending Topics

      Top Columnists

      Latest Update

      Signals

      Copy Rankings Latest Signals Become a signal provider AI Rating
      Contests
      Brokers

      Overview Brokers Assessment Rankings Regulators News Claims
      Broker listing Forex Brokers Comparison Tool Live Spread Comparison Scam
      Q&A Complaint Scam Alert Videos Tips to Detect Scam
      More

      Business
      Events
      Careers About Us Advertising Help Center

      White Label

      Data API

      Web Plug-ins

      Affiliate Program

      Awards Institution Evaluation IB Seminar Salon Event Exhibition
      Vietnam Thailand Singapore Dubai
      Fans Party Investment Sharing Session
      FastBull Summit BrokersView Expo
      Recent Searches
        Top Searches
          Markets
          News
          Analysis
          User
          24/7
          Economic Calendar
          Education
          Data
          • Names
          • Latest
          • Prev

          View All

          No data

          Scan to Download

          Faster Charts, Chat Faster!

          Download App
          English
          • English
          • Español
          • العربية
          • Bahasa Indonesia
          • Bahasa Melayu
          • Tiếng Việt
          • ภาษาไทย
          • Français
          • Italiano
          • Türkçe
          • Русский язык
          • 简中
          • 繁中
          Open Account
          Search
          Products
          Charts Free Forever
          Markets
          News
          Signals

          Copy Rankings Latest Signals Become a signal provider AI Rating
          Contests
          Brokers

          Overview Brokers Assessment Rankings Regulators News Claims
          Broker listing Forex Brokers Comparison Tool Live Spread Comparison Scam
          Q&A Complaint Scam Alert Videos Tips to Detect Scam
          More

          Business
          Events
          Careers About Us Advertising Help Center

          White Label

          Data API

          Web Plug-ins

          Affiliate Program

          Awards Institution Evaluation IB Seminar Salon Event Exhibition
          Vietnam Thailand Singapore Dubai
          Fans Party Investment Sharing Session
          FastBull Summit BrokersView Expo

          Gold News: Price Holds Key Support As 87% Fed Cut Odds Fuel Bullish Setup

          Glendon

          Commodity

          Summary:

          Spot gold holds above $4,133.95 support as 87% Fed cut odds and weak dollar set up potential breakout through $4,264.70 toward record highs this week.

          Gold Holds Above Key Support as Markets Wait for Fed Clues

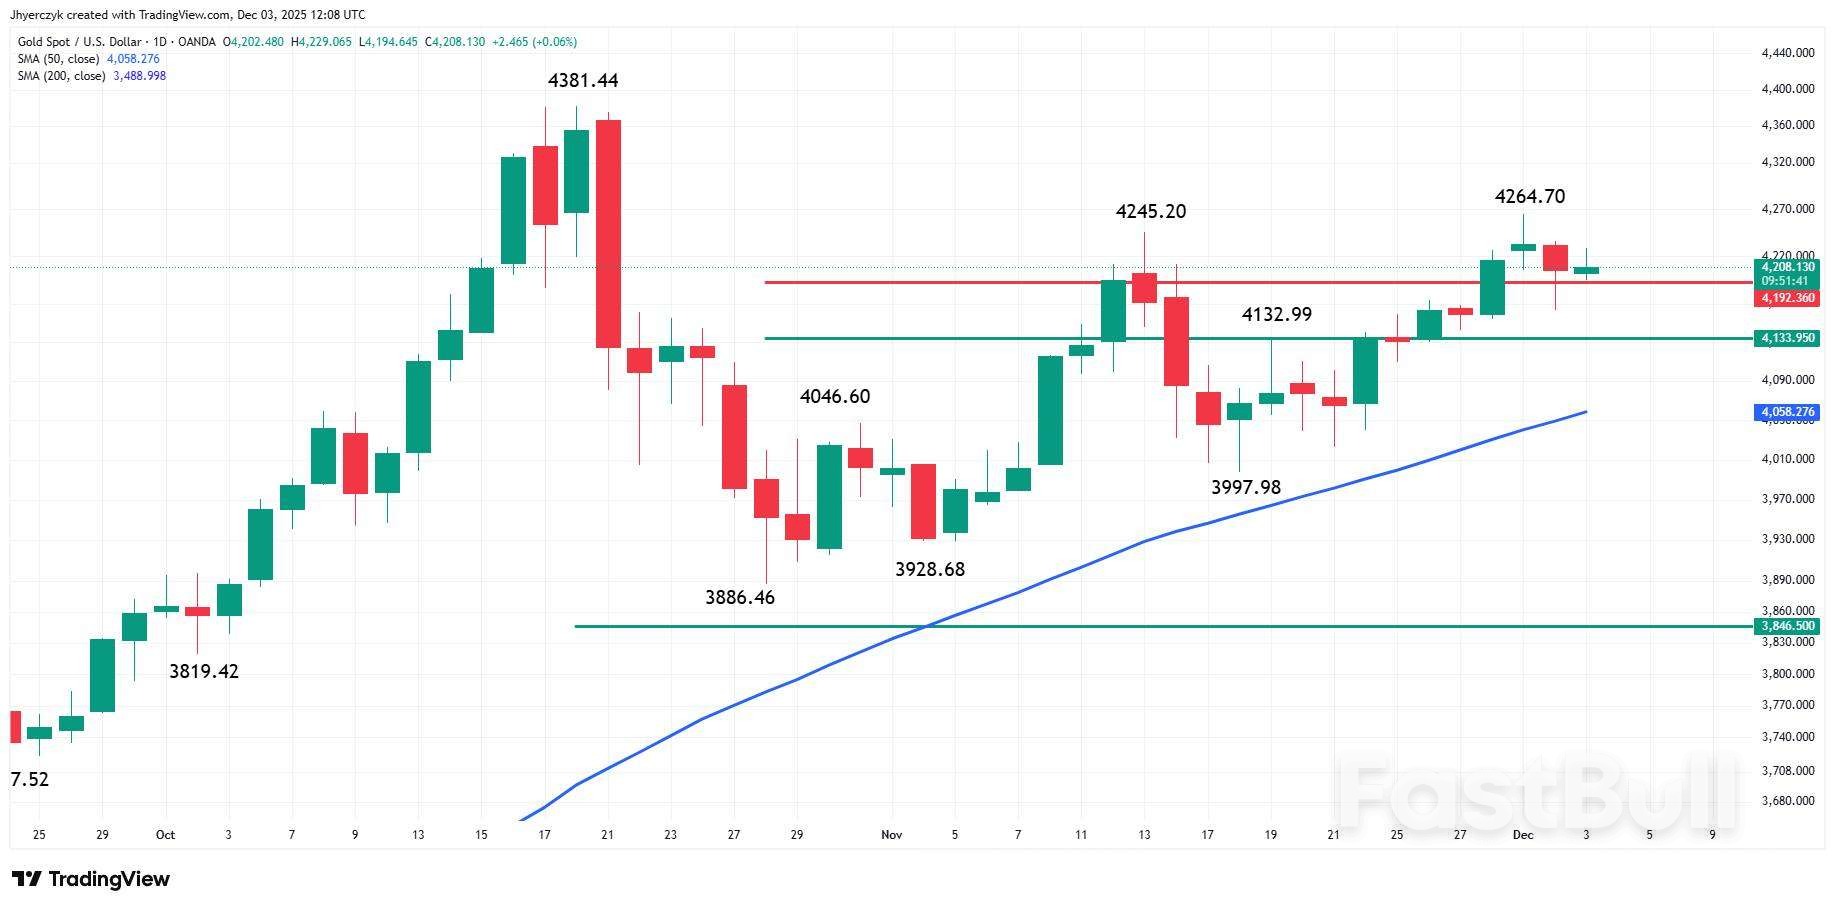
          Daily Gold (XAU/USD)

          Spot Gold (XAUUSD) is grinding higher Tuesday, trading just above the short-term retracement zone between $4,133.95 and $4,192.36. That's the final line of defense before the 50-day moving average at $4,058.26 — and as long as that holds, the uptrend's still in play.

          The two-day consolidation tells you what you need to know: traders are positioned, but nobody's pressing. They're waiting for the catalyst that breaks this week's high at $4,264.70. After that, it's a straight shot at the record at $4,381.44.

          The setup is clean. Buyers have been stepping in on dips all year, and right now they're deciding whether to chase the breakout or wait for one more pullback. With the 50-day still rising, the bias is to buy weakness — but the real move likely comes from the data, not the chart.

          At 12:27 GMT, XAUUSD is trading $4207.87, up $2.20 or +0.05%.

          Fed Cut Odds Jump, Treasury Yields Drift Lower

          Markets are pricing an 87% chance of a December rate cut, up sharply from 30% just two weeks ago. That shift — driven by weaker jobs data and dovish comments from Fed Governor Christopher Waller — is doing the heavy lifting for gold right now.

          Treasury yields are edging lower across the curve. The 10-year is down to 4.063%, the 2-year at 3.49%. Not a collapse, but enough to keep non-yielding assets like gold supported. Lower rates mean lower opportunity cost, and that's been the theme all year.

          The question now is whether this week's data — ADP employment Wednesday, ISM Services later, and the delayed September PCE on Friday — confirms the Fed's dovish tilt or throws a wrench in it. If the numbers come in soft, gold could punch through resistance. If they surprise hot, the dip-buyers get their chance.

          Dollar Slides for Ninth Straight Session

          The dollar's on pace for its ninth consecutive daily loss, down 0.15% to 99.10 on the index. That's a nearly 9% drop for the year, and it's all about rate expectations. The more the Fed cuts, the less reason there is to hold dollars — especially when the euro's catching a bid on hopes of a Ukraine peace deal and the yen's firming on Bank of Japan rate hike talk.

          Fed Chair uncertainty isn't helping. Trump's expected to announce his pick for Jerome Powell's replacement early next year, and the market's already pricing in a "shadow Fed chair" problem — two voices on policy when traders need one. That kind of noise usually weakens the dollar, and it's another tailwind for gold.

          Gold Poised for Breakout — But Waiting on the Data

          Gold's holding support, the Fed's dovish, and the dollar's weak. The setup favors the bulls, but the breakout isn't confirmed yet. This week's data will either push gold through $4,264.70 toward the record — or give dip-buyers one more entry before year-end. Either way, the 50-day moving average is the line that matters. As long as that holds, buyers have the upper hand.

          Source: FX Empire

          Risk Warnings and Disclaimers
          You understand and acknowledge that there is a high degree of risk involved in trading. Following any strategies or investment methods may lead to potential losses. The content on the site is provided by our contributors and analysts for information purposes only. You are solely responsible for determining whether any trading assets, securities, strategy, or any other product is suitable for investing based on your own investment objectives and financial situation.
          Add to Favorites
          Share

          World Shares Are Mixed as Steady Bond Yields, Rebound for Bitcoin Push US Stocks Higher

          Warren Takunda

          Economic

          European and Asian shares were mixed Wednesday after stocks on Wall Street held steadier as both bond yields and bitcoin stabilized.
          In early European trading, Germany’s DAX picked up 0.4% to 23,813.38, while the CAC 40 in Paris climbed 0.3% to 8,100.09. Britain’s FTSE 100 was unchanged at 9,702.28.
          The future for the S&P 500 edged 0.1% higher while that for the Dow Jones Industrial Average was 0.2% higher.
          In Asian trading, Tokyo’s Nikkei 225 jumped 1.1% to 49,864.68 on big gains for technology shares like Tokyo Electron, which jumped 4.7%. Adventest, a maker of computer chip testing equipment, surged 5.3%.
          Technology and telecoms giant SoftBank Group Corp. surged 6.4% following reports that its founder, Masayoshi Son, regretted having to sell shares in computer chip maker Nvidia to help pay for other investments. The company’s share price sank after it announced last month that it had sold the shares for $5.8 billion.
          South Korea’s Kospi also got a lift from tech shares, gaining 1% to 4,036.30. Shares in Samsung Electronics, the country’s biggest company, rose 1.1%.
          But Chinese markets declined following the release of data showing weaker factory activity.
          Hong Kong’s Hang Seng fell 1.3% to 25,760.73, while the Shanghai Composite index shed 0.5% to 3,878.00.
          Australia’s S&P/ASX 200 edged 0.2% higher, to 8,595.20.
          On Tuesday, the S&P 500 rose 0.2% and the Dow Jones Industrial Average added 0.4%. The Nasdaq composite gained 0.6%.
          The U.S. economy has been holding up overall, but that’s masking sharp divisions beneath the surface. Lower-income households are struggling with higher prices while richer households are benefiting from a stock market that’s within 1% of its all-time high set in late October.
          In the bond market, Treasury yields calmed following their jumps the day before. The 10-year yield edged down to 4.08% from 4.09% late Monday, while the two-year yield eased to 3.51% from 3.54%.
          Higher yields can drag prices lower for all kinds of investments, and those seen as the most expensive can take the biggest hit.
          Monday’s climb in Treasury yields came after the governor of the Bank of Japan hinted that it may raise interest rates there soon. But hopes are still high that the Federal Reserve will cut its main interest rate when it meets in Washington next week.
          The Japanese central bank is likely to raise its benchmark rate at its Dec. 19 meeting, Tan Boon Heng of Mizuho Bank in Singapore, because failing to do so could lead investors to sell off Japanese yen.
          “Yet, delivering a ‘done deal’ hike may perversely deny any appreciable JPY (Japanese yen) gains, whilst boosting long-end yields,” he said in a report.
          The Fed has already cut its overnight interest rate twice this year in hopes of shoring up a slowing job market. But lower rates can fan inflation, which has stubbornly remained above its 2% target.
          Complicating things is the U.S. government’s earlier shutdown, which delayed reports on the job market and other areas of the economy.
          In other dealings early Wednesday, bitcoin, which tumbled below $85,000 on Monday as bond yields worldwide marched higher, rose to $93,330.
          U.S. benchmark crude oil rose 71 cents to $59.35 per barrel. Brent crude, the international standard, gained 67 cents to $63.12 per barrel.
          The U.S. dollar slipped to 155.65 Japanese yen from 155.87 yen. The euro rose to $1.1645 from $1.1626.

          Source: AP

          To stay updated on all economic events of today, please check out our Economic calendar
          Risk Warnings and Disclaimers
          You understand and acknowledge that there is a high degree of risk involved in trading. Following any strategies or investment methods may lead to potential losses. The content on the site is provided by our contributors and analysts for information purposes only. You are solely responsible for determining whether any trading assets, securities, strategy, or any other product is suitable for investing based on your own investment objectives and financial situation.
          Add to Favorites
          Share

          Trader Bets Swell on Trump-Backed Fed, Data Stoking US Rate Cuts

          Adam

          Economic

          Bond

          Traders are piling into bets that a new Federal Reserve chair and the release of delayed economic data this month will support Donald Trump’s calls for lower interest rates.
          In the US futures market, demand is building for short-term curve structures linked to the Secured Overnight Financing Rate, which closely tracks perceived outcomes of Fed interest rate decisions. The wagers reflect the potential for monetary policy easing to gather pace after chair Jerome Powell’s term ends in May. The June 17 announcement will be the first under a new central bank chief.
          The new positions started to build after White House National Economic Council Director Kevin Hassett emerged as the frontrunner to succeed Powell. Trump said Tuesday that the race is “down to one” while referring to Hassett as a “potential Fed chair” during a cabinet meeting. He said he would announce his decision early next year.
          Trader Bets Swell on Trump-Backed Fed, Data Stoking US Rate Cuts_1
          The announcement “will create a ‘shadow Fed chair’,” Kristina Hooper, chief market strategist at Man Group, wrote this week. “This could complicate the Fed’s ability to communicate monetary policy and could create some confusion for markets at a time when they need clarity.”
          Traders in the leveraged futures market are already gaming out the scenarios with a huge buyer emerging Monday in one SOFR futures fly — the largest trade seen in that particular structure in more than a year. Recent sessions have also seen elevated activity in 3-, 6- and 12-month SOFR spreads, as traders look to target more rate cuts.
          Delayed Data
          It’s not just the next Fed chair announcement driving activity across futures spreads. Goldman Sachs strategists are looking to hedge ahead of the November labor market data due Dec. 16, just before the January policy meeting. The data, delayed by the US government shutdown, could spur more dovish bets if they confirm recent signs of softening.
          “We continue to see greater asymmetry for the front-end to pull forward cuts given the trend in labor market slack measures,” strategists including George Cole said in a Nov. 28 note.
          They favor positions benefiting from a curve steepening by targeting short-dated futures via SOFR Dec26/Dec27 spreads and further out the curve with conditional 2s10s bull steepeners. These bets will gather further traction if Hassett is confirmed as the next Fed chair.
          Wagers on a dovish policy shift and a ramp-up in December rate-cut odds pushed 10-year Treasury yields below the 4% mark last week. US Treasuries held marginal gains on Wednesday, with the 10-year yield slipping one basis point to 4.08%. That’s down from 4.11% on Tuesday, its highest level in nearly two weeks.
          Jack McIntyre, portfolio manager at Brandywine Global Investment Management, said that cutting rates while inflation is still above the Fed’s target could drive yields on long-end Treasuries higher, even as short-term rates fall.
          “If Hassett is confirmed, the most likely outcome is bear steepening,” said McIntyre. “I think of myself as part of the bond vigilantes. My job is to send a message to the administration. Do we need to send that message now? It’s too early to say. For me, it’s still wait-and-see.”
          Here’s a rundown of the latest positioning indicators across the rates market:
          JPMorgan Survey
          For the week ending Dec. 1, investor long positions dropped nine percentage points, with shorts rising 3 percentage points. As a result, the net long position dropped to the fewest since Nov. 3.
          Trader Bets Swell on Trump-Backed Fed, Data Stoking US Rate Cuts_2
          New Risk in SOFR Options
          In SOFR options out to the Jun26 tenor, activity has focused around the 96.3125 strike following flows over the past week for new risk including a buyer of the SFRZ5 96.25/96.3125 call spreads and SFRZ5 96.3125/96.375 call spreads. Flows also included a buyer of SFRZ5 96.3125/96.375 2x1 put spreads as traders look to position around the Dec. 10 policy meeting, where currently around 22 basis points of rate cuts are priced.
          Trader Bets Swell on Trump-Backed Fed, Data Stoking US Rate Cuts_3
          In SOFR options across tenors out to the Jun26 contracts, the 96.25 strike remains the most populated due to continued demand for upside call structures involving the level in Dec25 options. There’s also a large amount of open interest in the Dec25 96.50 and Dec25 96.375 calls. For large outstanding put structures, the Dec25 96.25 and Dec25 96.1875 put strikes are significantly populated.
          Trader Bets Swell on Trump-Backed Fed, Data Stoking US Rate Cuts_4
          Treasury Options Premium
          The premium paid on options to hedge Treasuries over the past week has continued to drift around neutral. Premium in the front and intermediates of the futures strip continues to slightly favor calls over puts, indicating traders paying more to hedge a Treasuries rally in the front end and belly of the curve versus a selloff.
          Trader Bets Swell on Trump-Backed Fed, Data Stoking US Rate Cuts_5

          Source: Bloomberg

          To stay updated on all economic events of today, please check out our Economic calendar
          Risk Warnings and Disclaimers
          You understand and acknowledge that there is a high degree of risk involved in trading. Following any strategies or investment methods may lead to potential losses. The content on the site is provided by our contributors and analysts for information purposes only. You are solely responsible for determining whether any trading assets, securities, strategy, or any other product is suitable for investing based on your own investment objectives and financial situation.
          Add to Favorites
          Share

          Ethereum (ETH) Bulls Or Bears? This Major Level Holds The Answer

          Michelle

          Cryptocurrency

          Ethereum (ETH) is trading at around $3,065, with a 24-hour trading volume of $30 billion. The price has climbed 9% in the last day and 4% over the past week.

          ETH is now sitting near a key level that could decide its short-term direction, as traders keep a close eye on $2,800.

          $2,800 Support May Define the Next Trend

          Crypto analyst CryptosRus said,

          "$ETH is sitting right on $2,800, one of the biggest support zones on the chart." they added, "Hold it → room back to $3,300 and even $3,900. Lose it → volatility at $2,500 HVN, then a real shot at $2,300."

          ETH has rebounded after recent weakness, but it remains close to this key zone. Price charts show a bullish candle on the daily close, though a clear breakout is still needed. Traders are watching the higher low trendline for confirmation of a push toward $3,700. For now, short-term setups on smaller timeframes are driving activity.

          High Leverage Meets Lower Open Interest

          Data from Binance shows Ethereum's leverage ratio at an all-time high of 0.57, according to CryptoOnchain. This means many traders are using borrowed funds. At the same time, open interest has dropped to $6.6 billion, which suggests "a lot of froth already flushed out."

          Notably, this creates a mixed setup. High leverage increases risk, while the drop in open interest shows that many weaker positions may have already been cleared. Traders are warning that the current build-up could lead to sudden price moves if the market reacts sharply near current levels.

          Short-Term Levels and Chart Patterns

          CRYPTOWZRD shared that the $3,055 level is now an important intraday resistance. They explained that ETH recovered well but may be forming a double-top.

          "A bearish pullback and then a bullish move again will offer a quality long setup, otherwise there may be a fake-out," they said.

          The next lower support is around $2,880. If the asset holds there and finds buyers, traders may look for long entries.

          On higher timeframes, ETH is forming a bullish wedge and inverse head-and-shoulders, based on recent analysis reported by CryptoPotato. These patterns are being tracked by traders expecting a breakout above $4,500.

          Meanwhile, institutional buying is also active. BitMine, linked to Tom Lee, recently purchased over 30,000 ETH—worth close to $92 million. This shows growing interest from larger players, even as the market tests a critical zone.

          Source: CryptoSlate

          Risk Warnings and Disclaimers
          You understand and acknowledge that there is a high degree of risk involved in trading. Following any strategies or investment methods may lead to potential losses. The content on the site is provided by our contributors and analysts for information purposes only. You are solely responsible for determining whether any trading assets, securities, strategy, or any other product is suitable for investing based on your own investment objectives and financial situation.
          Add to Favorites
          Share

          Oil Gains as Traders Weigh the Next Steps in Russia-Ukraine War

          Adam

          Commodity

          Russia-Ukraine Conflict

          Oil rose as traders weighed talks between the US and Russia that have so far failed to end the war in Ukraine, while attacks on Moscow’s energy assets continued.
          Brent traded near $63, though prices have been lacking direction in recent days. The Kremlin said President Vladimir Putin held “very useful” talks with US envoys Steve Witkoff and Jared Kushner, though the sides failed to reach agreement on a plan to end the conflict in Ukraine. European defense stocks rose and Ukrainian bonds fell.
          The talks came against the backdrop of another attack on a Russia-linked ship, but it remains unclear who carried out the strike. Putin warned that Moscow may consider striking the vessels of countries supporting Ukraine if hits on the nation’s fleet do not stop, state-run Rossiya 24 TV channel reported.
          Oil Gains as Traders Weigh the Next Steps in Russia-Ukraine War_1
          “The Brent crude price remained roughly unchanged in the low $60s over the last week as Russia-Ukraine peace talks continue,” Goldman Sachs Group Inc. analysts including Yulia Zhestkova Grigsby said. “Oil markets and prediction markets do not appear to price a large probability of a near-term peace agreement and removal of the sanctions on Russia oil.”
          Geopolitical tensions are keeping the market jittery and adding a risk premium to prices, partly countering concerns about a growing surplus. That includes US rhetoric against Venezuela, with US President Donald Trump suggesting the Pentagon will soon start targeting drug cartels with strikes on land.
          Meanwhile, an industry report showed nationwide US crude stockpiles increased by about 2.5 million barrels last week, while inventories of gasoline expanded. Government figures, including on demand, are due later Wednesday.

          Source: Bloomberg

          Risk Warnings and Disclaimers
          You understand and acknowledge that there is a high degree of risk involved in trading. Following any strategies or investment methods may lead to potential losses. The content on the site is provided by our contributors and analysts for information purposes only. You are solely responsible for determining whether any trading assets, securities, strategy, or any other product is suitable for investing based on your own investment objectives and financial situation.
          Add to Favorites
          Share

          Putin Accepts Some U.S. Proposals on Ukraine But Not All

          Glendon

          Russia-Ukraine Conflict

          Russian President Vladimir Putin has accepted some U.S. proposals to end the war in Ukraine while rejecting others, according to the Kremlin on Wednesday.

          Kremlin spokesman Dmitry Peskov told reporters that Russia is ready to meet with U.S. negotiators "as many times as it took to reach an agreement" on Ukraine.

          Stay on top of market-moving headlines by upgrading to InvestingPro - get 55% off today

          The statement follows talks in Moscow between Putin and U.S. President Donald Trump's special envoy, Steve Witkoff, and son-in-law Jared Kushner. The discussions extended into the early hours of Wednesday morning.

          Peskov emphasized it would be incorrect to say Putin had rejected the U.S. proposals, describing the meeting as a first face-to-face exchange of opinions. A Kremlin aide had earlier stated that "compromises have not yet been found."

          The Kremlin indicated that work on a possible Ukraine deal is currently being conducted at the expert level, adding that such talks have a better chance of being productive if carried out without public commentary.

          Russian officials expressed appreciation for Trump's efforts, with Peskov stating that the Kremlin "highly values Trump's political will to try to find a resolution and is grateful to him for his efforts."

          The Kremlin also noted that the results of ongoing expert-level work should form the basis for high-level conversations between Russia and the United States.

          When asked for additional details, the Kremlin declined further comment, stating it does not favor "megaphone diplomacy."

          Source: Investing

          Risk Warnings and Disclaimers
          You understand and acknowledge that there is a high degree of risk involved in trading. Following any strategies or investment methods may lead to potential losses. The content on the site is provided by our contributors and analysts for information purposes only. You are solely responsible for determining whether any trading assets, securities, strategy, or any other product is suitable for investing based on your own investment objectives and financial situation.
          Add to Favorites
          Share

          Australian Dollar: 'Hawkish' Bullock Comments

          Warren Takunda

          Economic

          In a midweek appearance before the Senate Economics Legislation Committee, Bullock said the country's labour market is "a little tight", and the output gap has "probably closed".
          This is how economists say the economy is at a point that it is at risk of becoming increasingly inflationary, something the RBA would guard against.
          She said persistent inflation will affect the future policy path and the RBA is "alert to the possibility CPI pressures might be building."
          "If CPI pressures build, the board will respond accordingly," she says.
          This "development that would encourage a stronger Australian dollar," says MUFG Bank Ltd in a note released Wednesday.
          Bullock's comments signal that the RBA has shifted from a rate cutting cycle and is in the early stages of laying the path to higher rates. As recently as August, Bullock was preparing the market for another interest rate cut, having reduced the cash rate by 25 basis points.
          But the 'curve' has adjusted massively and money market pricing shows investors are now positioned for a hike in the second half of 2026. This
          "The Australian rate market has moved to almost fully price in a rate hike from the RBA in light of the tighter than expected labour market conditions and the pick-up in inflation pressures," says a note from MUFG Bank Ltd.
          ANZ, one of the country’s largest lenders, said this week it has readjusted its expectations for the future of Australian rates.
          Economists at the bank say they now expect the cash rate to remain at 3.60% for an "extended" period, marking a significant shift from earlier forecasts that assumed additional easing in 2026.
          The bank says recent inflation pressures, steadier economic growth and a labour market moving into balance mean the RBA is unlikely to deliver further cuts.
          At the same time, ANZ says it is "difficult to see a rate hike in 2026", pointing to the rise in unemployment over the past year and conflicting signals across demand indicators.

          Source: Poundsterlinglive

          To stay updated on all economic events of today, please check out our Economic calendar
          Risk Warnings and Disclaimers
          You understand and acknowledge that there is a high degree of risk involved in trading. Following any strategies or investment methods may lead to potential losses. The content on the site is provided by our contributors and analysts for information purposes only. You are solely responsible for determining whether any trading assets, securities, strategy, or any other product is suitable for investing based on your own investment objectives and financial situation.
          Add to Favorites
          Share
          FastBull
          Copyright © 2025 FastBull Ltd

          728 RM B 7/F GEE LOK IND BLDG NO 34 HUNG TO RD KWUN TONG KLN HONG KONG

          TelegramInstagramTwitterfacebooklinkedin
          App Store Google Play Google Play
          Products
          Charts

          Chats

          Q&A with Experts
          Screeners
          Economic Calendar
          Data
          Tools
          Membership
          Features
          Function
          Markets
          Copy Trading
          Latest Signals
          Contests
          News
          Analysis
          24/7
          Columns
          Education
          Company
          Careers
          About Us
          Contact Us
          Advertising
          Help Center
          Feedback
          User Agreement
          Privacy Policy
          Business

          White Label

          Data API

          Web Plug-ins

          Poster Maker

          Affiliate Program

          Risk Disclosure

          The risk of loss in trading financial instruments such as stocks, FX, commodities, futures, bonds, ETFs and crypto can be substantial. You may sustain a total loss of the funds that you deposit with your broker. Therefore, you should carefully consider whether such trading is suitable for you in light of your circumstances and financial resources.

          No decision to invest should be made without thoroughly conducting due diligence by yourself or consulting with your financial advisors. Our web content might not suit you since we don't know your financial conditions and investment needs. Our financial information might have latency or contain inaccuracy, so you should be fully responsible for any of your trading and investment decisions. The company will not be responsible for your capital loss.

          Without getting permission from the website, you are not allowed to copy the website's graphics, texts, or trademarks. Intellectual property rights in the content or data incorporated into this website belong to its providers and exchange merchants.

          Not Logged In

          Log in to access more features

          FastBull Membership

          Not yet

          Purchase

          Become a signal provider
          Help Center
          Customer Service
          Dark Mode
          Price Up/Down Colors

          Log In

          Sign Up

          Position
          Layout
          Fullscreen
          Default to Chart
          The chart page opens by default when you visit fastbull.com