

Markets
News
Analysis
User
24/7
Economic Calendar
Education
Data
- Names
- Latest
- Prev


Signal Accounts for Members
All Signal Accounts
All Contests
 France Trade Balance (SA) (Oct)
A:--
F: --
 Euro Zone Employment YoY (SA) (Q3)
A:--
F: --
 Canada Part-Time Employment (SA) (Nov)
A:--
F: --
P: --
Canada Unemployment Rate (SA) (Nov)A:--
F: --
P: --
Canada Full-time Employment (SA) (Nov)A:--
F: --
P: --
Canada Labor Force Participation Rate (SA) (Nov)A:--
F: --
P: --
Canada Employment (SA) (Nov)A:--
F: --
P: --
 U.S. PCE Price Index MoM (Sept)
A:--
F: --
P: --
U.S. Personal Income MoM (Sept)A:--
F: --
P: --
U.S. Core PCE Price Index MoM (Sept)A:--
F: --
P: --
U.S. PCE Price Index YoY (SA) (Sept)A:--
F: --
P: --
U.S. Core PCE Price Index YoY (Sept)A:--
F: --
P: --
U.S. Personal Outlays MoM (SA) (Sept)A:--
F: --
U.S. 5-10 Year-Ahead Inflation Expectations (Dec)A:--
F: --
P: --
U.S. Real Personal Consumption Expenditures MoM (Sept)A:--
F: --
U.S. Weekly Total Rig CountA:--
F: --
P: --
U.S. Weekly Total Oil Rig CountA:--
F: --
P: --
U.S. Consumer Credit (SA) (Oct)A:--
F: --
 China, Mainland Foreign Exchange Reserves (Nov)
A:--
F: --
P: --
 Japan Trade Balance (Oct)
A:--
F: --
P: --
Japan Nominal GDP Revised QoQ (Q3)A:--
F: --
P: --
China, Mainland Imports YoY (CNH) (Nov)A:--
F: --
P: --
China, Mainland Exports (Nov)A:--
F: --
P: --
China, Mainland Imports (CNH) (Nov)A:--
F: --
P: --
China, Mainland Trade Balance (CNH) (Nov)A:--
F: --
P: --
China, Mainland Exports YoY (USD) (Nov)A:--
F: --
P: --
China, Mainland Imports YoY (USD) (Nov)A:--
F: --
P: --
 Germany Industrial Output MoM (SA) (Oct)
A:--
F: --
Euro Zone Sentix Investor Confidence Index (Dec)A:--
F: --
P: --
Canada National Economic Confidence IndexA:--
F: --
P: --
 U.K. BRC Like-For-Like Retail Sales YoY (Nov)
--
F: --
P: --
U.K. BRC Overall Retail Sales YoY (Nov)--
F: --
P: --
 Australia Overnight (Borrowing) Key Rate
--
F: --
P: --
RBA Rate Statement RBA Press Conference Germany Exports MoM (SA) (Oct)--
F: --
P: --
U.S. NFIB Small Business Optimism Index (SA) (Nov)--
F: --
P: --
 Mexico 12-Month Inflation (CPI) (Nov)
--
F: --
P: --
Mexico Core CPI YoY (Nov)--
F: --
P: --
Mexico PPI YoY (Nov)--
F: --
P: --
U.S. Weekly Redbook Index YoY--
F: --
P: --
U.S. JOLTS Job Openings (SA) (Oct)--
F: --
P: --
China, Mainland M1 Money Supply YoY (Nov)--
F: --
P: --
China, Mainland M0 Money Supply YoY (Nov)--
F: --
P: --
China, Mainland M2 Money Supply YoY (Nov)--
F: --
P: --
U.S. EIA Short-Term Crude Production Forecast For The Year (Dec)--
F: --
P: --
U.S. EIA Natural Gas Production Forecast For The Next Year (Dec)--
F: --
P: --
U.S. EIA Short-Term Crude Production Forecast For The Next Year (Dec)--
F: --
P: --
EIA Monthly Short-Term Energy Outlook U.S. API Weekly Gasoline Stocks--
F: --
P: --
U.S. API Weekly Cushing Crude Oil Stocks--
F: --
P: --
U.S. API Weekly Crude Oil Stocks--
F: --
P: --
U.S. API Weekly Refined Oil Stocks--
F: --
P: --
 South Korea Unemployment Rate (SA) (Nov)
--
F: --
P: --
Japan Reuters Tankan Non-Manufacturers Index (Dec)--
F: --
P: --
Japan Reuters Tankan Manufacturers Index (Dec)--
F: --
P: --
Japan Domestic Enterprise Commodity Price Index MoM (Nov)--
F: --
P: --
Japan Domestic Enterprise Commodity Price Index YoY (Nov)--
F: --
P: --
China, Mainland PPI YoY (Nov)--
F: --
P: --
China, Mainland CPI MoM (Nov)--
F: --
P: --
 Italy Industrial Output YoY (SA) (Oct)
--
F: --
P: --

No matching data
Latest Views
Latest Views
Trending Topics
Top Columnists
Latest Update
White Label
Data API
Web Plug-ins
Affiliate Program
View All
No data
Germany's private sector growth has lost momentum in November as the manufacturing sector has unexpectedly contracted and the service sector has not expanded as fast as hoped, a survey showed on Friday.
Germany's private sector growth has lost momentum in November as the manufacturing sector has unexpectedly contracted and the service sector has not expanded as fast as hoped, a survey showed on Friday.
The HCOB preliminary German flash composite Purchasing Managers' Index, compiled by S&P Global, slipped to 52.1 in November from October's 53.9, marking a two-month low.
November marks the sixth month in a row that the composite index, which tracks the services and manufacturing sectors that together account for more than two-thirds of the euro zone's largest economy, was above the 50 mark indicating growth.
The manufacturing PMI dipped further into contraction territory, falling to 48.4 in November from 49.6 in October, in contrast to analysts' forecasts for a slight rise to 49.8.
New orders in the manufacturing sector fell sharply, particularly in export sales, which saw their quickest decline since January. This downturn in demand has contributed to a renewed decline in backlogs of work and a modest acceleration in job losses across the sector.
Meanwhile, the services PMI dropped to 52.7 from 54.6, also a two-month low, and also below the forecast for a fall to 54.0.
"These figures are a major setback for Germany," said Cyrus de la Rubia, Hamburg Commercial Bank's chief economist.
The manufacturing PMI signals a slowdown in this part of the economy, while hopes that the rate of expansion in services would speed up have vanished into thin air, added de la Rubia.
"Overall, the German economy is limping towards marginal growth at best in the fourth quarter," said the economist.

The finance ministry said on Thursday that at best a moderate recovery can be expected by the end of the year.
Despite these challenges, manufacturers were optimistic about future production, buoyed by growth expectations in defence and civil engineering due to government investment.

After rallying above 1.16 earlier in November, the Euro to US Dollar exchange rate (EUR/USD) slipped back towards the mid‑1.15s as investors rethought the outlook for US monetary policy.
Latest — Exchange Rates:Pound to Dollar (GBP/USD): 1.30862 (+0.02%)Euro to Dollar (EUR/USD): 1.15457 (+0.1%)Dollar to Japanese Yen (USD/JPY): 156.7795 (-0.38%)
The Federal Reserve's latest meeting minutes revealed a committee increasingly wary of cutting rates again, and several officials warned that easing too aggressively could damage inflation‑fighting credibility.
Those hawkish signals pushed US yields higher and drew capital into the dollar, leaving the euro struggling to regain traction.
Even a late‑week bounce in equities did little to lift the single currency as risk appetite remained fragile.
The mood darkened further when the spectacular rally in a major US semiconductor stock, fuelled by optimism over artificial‑intelligence demand, abruptly reversed.
Shares initially spiked on bumper earnings and bullish guidance, driving indices to record highs.
Within hours, however, profit‑taking and concerns about stretched valuations triggered a sharp sell‑off that dragged the Nasdaq and S&P 500 into negative territory.
This whipsaw in equities reinforced the dollar's safe‑haven appeal and kept EUR/USD under pressure even as bond markets gyrated.
Non‑farm payrolls rose by 119,000 in October, comfortably beating expectations for a 53,000 increase, yet the previous month's figure was revised down and the unemployment rate ticked up to 4.4 % from 4.3 %.
Average hourly earnings growth eased to 0.2 % month on month, undershooting the consensus and suggesting wage pressures are moderating.
Weekly unemployment claims edged lower to 220,000 after two elevated readings, but the overall picture remains mixed.
In the absence of a clear trend, investors are balancing a better‑than‑expected jobs headline against signs of cooling wages and a higher jobless rate, leaving the path of US yields and broader sentiment as key drivers.
Meanwhile, recent euro‑zone figures have been underwhelming.
Construction output contracted for a second month and annual growth turned negative, while consumer confidence remains deeply depressed.
European Central Bank vice‑president Luis de Guindos acknowledged that inflation is converging towards the 2 % target but warned that high debt and trade tensions could amplify any downturn.
The combination of a fragile economy and hawkish U.S. policy has left analysts divided.
Some technical strategists warn that the euro's failure to hold above its 50‑day moving average signals further downside, with a head‑and‑shoulders pattern hinting at a slide towards the low‑1.14s.
Others see the decline as a temporary correction within a broader reversal pattern, suggesting that support around 1.15 could hold and that the pair might recover towards 1.17 if U.S. data weaken.
A few houses continue to argue that yield spreads justify a stronger euro over the longer term and retain a year‑end 2025 forecast of around 1.18.
The divergence underscores how little conviction there is in either direction.
Markets now turn to a busy data calendar.
In the euro area, investors will parse the final October inflation numbers, November's consumer confidence survey and Friday's flash Purchasing Managers' Indices.
De Guindos speaks twice, on Monday and Friday, and his remarks may help shape expectations ahead of the December ECB meeting.
Scotiabank's latest technical analysis describes EUR/USD as neutral to bearish.
A sharp mid‑week pullback dragged the pair back towards its early‑November lows and sent short‑term momentum indicators into negative territory.
Support is seen near the 5 November low in the mid‑1.14s; a break would shift focus towards the early‑August low around 1.14.
On the topside, rallies have failed to hold above the 50‑day moving average near 1.1660.
The bank expects the euro to trade in a narrow 1.1480–1.1580 band in the near term unless data releases provide a catalyst.
Yield differentials still lean slightly in favour of the euro, so dips towards the low‑1.14s may attract buyers, but any meaningful recovery will likely require evidence of a softer U.S. economy.
British retail sales tumbled in October and a closely watched gauge of household sentiment fell this month, adding to signs of waning consumer spending ahead of finance minister Rachel Reeves' budget next week.
Retail sales volumes fell by 1.1% in October compared with a month before, their first month-on-month fall since May, the Office for National Statistics said on Friday.
Economists polled by Reuters had expected sales to be flat compared with the previous month. Compared with October a year ago, retail sales were just 0.2% higher, against forecasts for a 1.5% annual increase.
Sterling fell briefly against the dollar but soon recovered.
Earlier on Friday, Britain's longest-running consumer survey, from GfK, showed a broad-based drop in consumer morale this month which suggested the public was "bracing for bad news" in Reeves' budget on Nov 26.
"The increasingly chaotic run-up to the budget has begun to weigh on consumer spending, judging by confidence nudging down in November and weakening retail sales growth lately," said Rob Wood, chief UK economist at Pantheon Macroeconomics, a consultancy.
Separate ONS data showed higher-than-expected government borrowing last month, underscoring the scale of the challenge facing Reeves.
She is expected to need to raise £20-30 billion (US$26 billion-US$39 billion or RM107.7 billion-RM161.6 billion) through higher taxes due to an expected growth downgrade from the government's budget watchdog as well as higher borrowing costs and an inability to pass planned welfare cuts through parliament.
Overall consumer spending has been subdued due to a continued high savings rate, which economists say may reflect a surge in inflation in 2022, a more recent weakening in the jobs market and concerns about tax rises in the budget.
Recent updates from major retailers have expressed nervousness about the impact of the upcoming budget on consumer sentiment, particularly for more discretionary purchases. However, supermarket Sainsbury's and food and clothing retailer Marks & Spencer were both upbeat on Christmas trading prospects.
The ONS said supermarket, clothing and mail order sales fell in October, with some retailers citing consumers delaying spending ahead of November's Black Friday discounts.
British retail sales volumes remain 3.3% lower than their pre-pandemic level of February 2020.

Sales at UK retailers slumped unexpectedly last month as shoppers waited for Black Friday deals, and uncertainty over the upcoming budget dampened consumer confidence.
Retail sales fell 1.1% month on month in October, the first fall since May, according to official figures from the Office for National Statistics (ONS). Economists had been expecting sales growth to be flat on the previous month.
Supermarkets, clothing stores and online mail order companies suffered sales declines, which some retailers said was due to consumers delaying purchases in the run-up to the annual Black Friday sales, according to the ONS.
Clothing, footwear and textile stores posted a 3.3% month-on-month drop in sales, the largest fall, after strong summer when shoppers were motivated to buy clothes during warm weather and sporting events improved consumers' mood.
Supermarkets recorded a sales decrease of 1.1% in October, the second consecutive monthly fall.
Online retail sales fell 1.7% month on month, while fuel sales dropped 2.4% in October compared with September.
Some analysts also attributed the surprise fall in sales in October to consumer jitters over the upcoming budget, which the chancellor, Rachel Reeves, will present next week.
"The uncertainty surrounding what the chancellor's budget next week will mean for individuals is only further dampening consumer confidence and spending intentions," said Rajeev Shaunak, the head of consumer at the accountancy and advisory firm MHA.
"The Christmas trading period will be critical, and early sales indicators are expected to confirm that consumer demand remains sluggish, creating a perfect storm for retailers."
On Friday, the research company GfK released data showing that consumer confidence has fallen on every measure of its index this month.
GFK's five sub-indexes record public opinion about people's personal financial situation, propensity to make big purchases and the UK's general economic situation.
The company recorded drops across all five sub-indexes compared with October, resulting in a two-point fall in overall confidence to -19.
The latest monthly survey, which dates back to 1974, showed particular anxiety among earners on salaries between £35,000 and £49,999, with substantial falls in their expectations for their own financial situation and future spending.
"This is a bleak set of results as we head towards next week's budget," said Neil Bellamy, the consumer insights director at GfK. "The public is bracing for difficult news, with little in the current climate to lift expectations."
The ONS revised retail sales for September up from 0.5% to 0.7%, but said August had been revised down from 0.6% to 0.5% growth.
Overall, retail sales remain 3.3% down compared with their pre-pandemic level from February 2020.

Many traders rely on myfastbroker.com forex brokers to find potential trading platforms, but the key question remains: how reliable are its latest picks? This article reviews how the platform selects brokers, what risks users should watch for, and how trustworthy its recommendations really are. We focus on clear safety checks, real-world usability, and practical guidance to help traders make confident decisions.
Myfastbroker is a broker comparison platform designed to help users explore different trading options without acting as an actual trading broker. Instead of executing trades, myfastbroker.com collects and displays information about various broker categories, including myfastbroker.com forex brokers, stock, and other financial services, allowing traders to compare features before making a choice.
The core role of myfastbroker.com is to act as an informational hub where users can view and compare brokers based on basic criteria such as services offered, trading tools, and general positioning.
While myfastbroker trading apps and myfastbroker trading platforms are sometimes mentioned, the site itself does not operate as a direct trading interface.
Although the main focus in this article remains on myfastbroker.com forex brokers, the platform also showcases a wide range of broker types.
| Broker Type | Typical Use Case |
|---|---|
| myfastbroker stock brokers | Equity and share trading |
| Forex brokers | Currency trading |
| Business brokers | Corporate investment or asset transfers |
| Insurance brokers | Risk coverage and policy services |
This broad coverage positions myfastbroker.com more as a general broker listing site than a specialised forex-only solution.
Compared with traditional broker review platforms, myfast broker.com places more emphasis on aggregation rather than in-depth verification.
By contrast, specialist review sites often provide structured scoring methods, regulatory cross-checks, and real user feedback data, which can offer deeper insight beyond what myfastbroker.com typically presents.
Understanding how myfastbroker.com forex brokers are chosen is essential when judging the reliability of its listings. The site claims to rely on a selection process, but the level of detail shared with users remains limited.
According to Myfastbroker, broker inclusion is based on several general factors such as:
However, there is no clear public breakdown of how each factor is weighted, making it difficult for users to fully assess how objective the selection process is.
It is not clearly stated whether myfastbroker.com relies more on human analysis or automated scoring systems. This lack of transparency raises questions about consistency and objectivity.
| Method | Characteristics | Potential Risks |
|---|---|---|
| Manual review | Subjective human judgment | Possible bias or inconsistency |
| Algorithm-based scoring | Data-driven metrics | Lack of transparency in scoring rules |
Many comparison platforms generate revenue through affiliate relationships, and myfastbroker.com is no exception. This model means that:
This does not automatically mean recommendations are unreliable, but it does highlight the importance of independent verification before trusting any listing from myfastbroker.com forex brokers.
Even when using myfastbroker.com forex brokers as a reference, traders should never rely solely on platform ratings. These five practical checks help you verify whether a broker listed on Myfastbroker or myfast broker.com is truly reliable before opening an account.
The first step is to confirm whether the broker is regulated by recognised authorities. Listings on myfastbroker.com may not always display full regulatory details, so direct verification is essential.
Brokers featured on myfastbroker.com should clearly state how client funds are handled. This applies to both myfastbroker stock brokers and forex platforms.
| Protection Factor | What to Look For |
|---|---|
| Segregated Accounts | Client money kept separate from company funds |
| Compensation Schemes | Investor protection coverage if broker fails |
| Transparency Policy | Clear explanation on fund handling |
Brokers promoted through myfastbroker trading platforms often highlight attractive spreads. These should be tested against real trading conditions.
Execution performance is rarely shown on myfastbroker.com trading apps listings, yet it directly affects profitability.
One of the most critical reliability signals for any broker found via myfastbroker.com is withdrawal performance.
A broker with consistent withdrawal problems should not be trusted, regardless of how prominently it appears on myfastbroker .com listings.
While myfastbroker.com forex brokers can be helpful as a starting point, trust should never be automatic. The platform is useful for quick discovery, but traders still need to decide whether its recommendations match real trading safety standards.
Brokers listed on Myfastbroker or myfast broker.com may be considered reasonably reliable when they meet clear, verifiable criteria.
Caution is necessary when listings on myfastbroker.com show warning signs that suggest commercial influence or weak oversight.
Myfastbroker serves as a useful discovery tool, but not a final authority. Traders should treat it as an initial filter rather than a guarantee of broker safety. The most reliable approach is to combine its listings with independent verification and personal testing.
Choosing a broker via myfastbroker.com should follow a simple and logical process. This approach helps reduce risk while still benefiting from the platform’s comparison features.
Different traders need different broker conditions. Whether you focus on myfastbroker stock brokers or forex trading, first identify what suits your strategy.
Always compare myfastbroker.com data with third-party resources such as regulatory sites or professional broker review platforms to confirm legitimacy and performance accuracy.
Before fully trusting any broker found via myfastbroker trading apps or myfastbroker trading platforms, start with a small or demo account to observe real performance.
The most trusted forex broker is usually one that holds strong regulation, offers transparent trading conditions, and has a long record of reliable withdrawals. Rather than relying solely on rankings from myfastbroker.com forex brokers, traders should verify licenses and review independent feedback before making a decision.
The best forex broker in the UK is typically regulated by the FCA and follows strict client protection rules. While Myfastbroker can highlight potential options, traders should always cross-check brokers with UK regulatory sources for confirmation.
To check if a forex broker is legitimate, confirm its regulatory license, check client fund protection policies, and review real trader complaints. Relying only on myfastbroker.com listings is not enough without additional verification.
Myfastbroker.com forex brokers can be a helpful starting point for discovering trading options, but reliability should never be assumed. Traders must verify regulation, test real trading conditions, and compare independent reviews before committing funds. Used carefully, myfastbroker.com forex brokers can support smarter choices, but true safety comes from personal checks and well-informed decision-making.
Today, the Hong Kong stock index HSI is showing downward momentum, dropping below 25,200 for the first time since mid-October.
Factors adding to selling pressure include (according to media reports):
→ Tech sector slump: Hong Kong is following the US, where investors have started offloading tech giants' shares amid fears of an AI "bubble." Market participants worry that current company valuations are overinflated. Even Nvidia's strong report released this week only provided a short-term boost.
→ Geopolitics: In addition to strained trade relations between China and the US, tensions with Japan have added to uncertainty.
→ China's economic data: Indicators continue to raise concerns despite government stimulus measures.
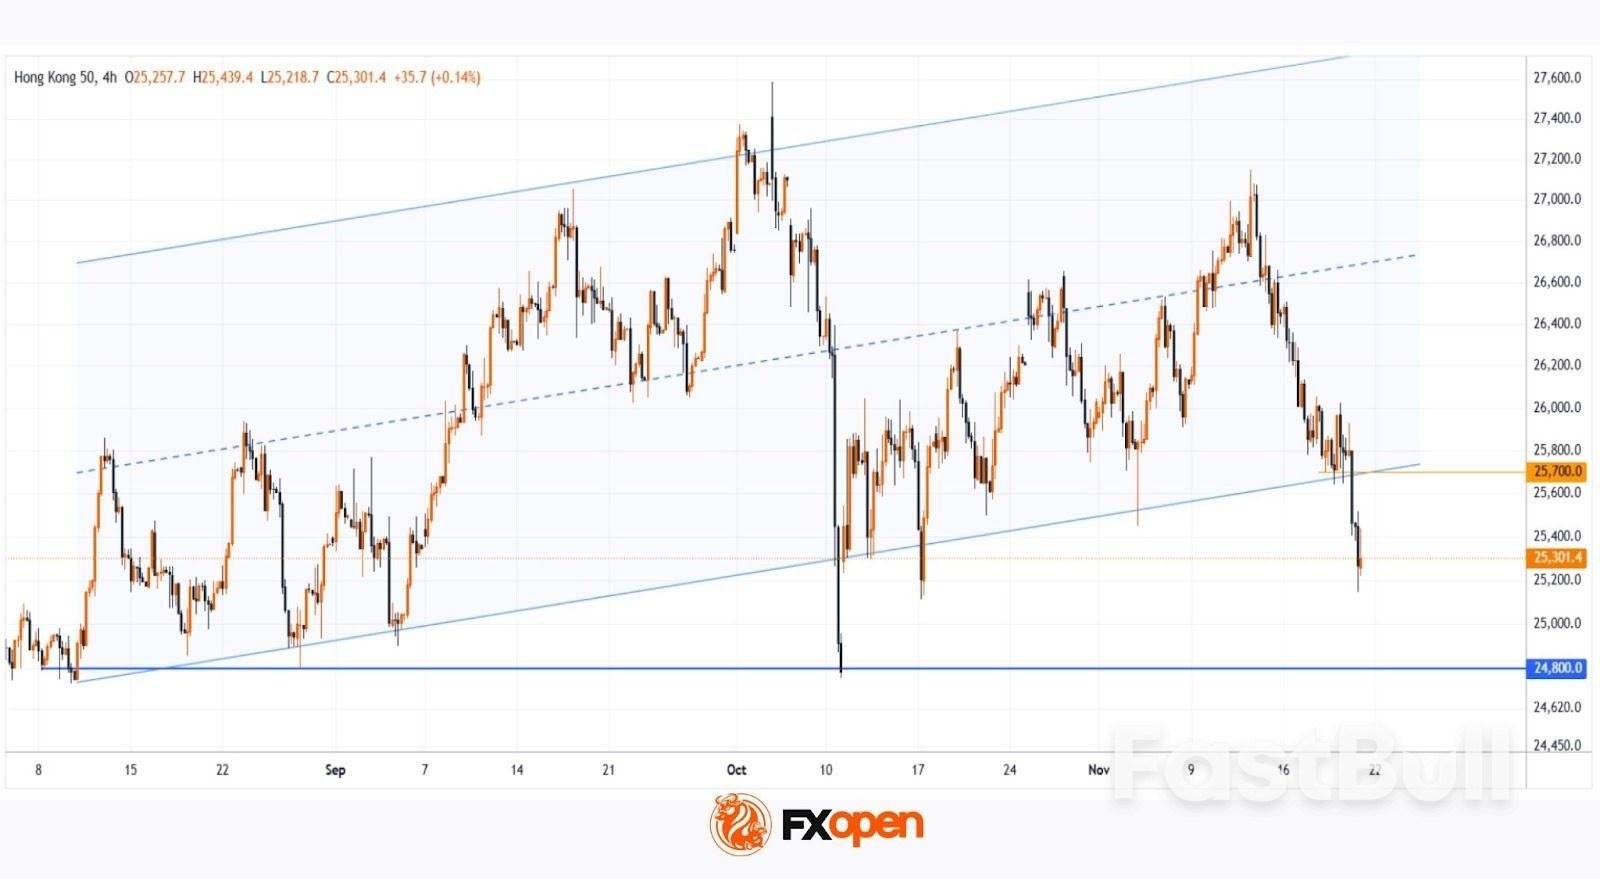
At the same time:
→ on 5 November, the price rebounded sharply from the lower boundary, confirming strong buying interest;
→ this week (as indicated by the arrow), it failed to reverse upwards.
As a result, bears have pushed through an important support level and are attempting to consolidate their gains.
It is possible that:
→ the 25,700 level (where the channel was broken) may act as resistance;
→ bears may grow more ambitious, potentially driving the HSI (Hong Kong 50 on FXOpen) down to test key support around 24,800 in the near term.
728 RM B 7/F GEE LOK IND BLDG NO 34 HUNG TO RD KWUN TONG KLN HONG KONG


White Label
Data API
Web Plug-ins
Poster Maker
Affiliate Program
The risk of loss in trading financial instruments such as stocks, FX, commodities, futures, bonds, ETFs and crypto can be substantial. You may sustain a total loss of the funds that you deposit with your broker. Therefore, you should carefully consider whether such trading is suitable for you in light of your circumstances and financial resources.
No decision to invest should be made without thoroughly conducting due diligence by yourself or consulting with your financial advisors. Our web content might not suit you since we don't know your financial conditions and investment needs. Our financial information might have latency or contain inaccuracy, so you should be fully responsible for any of your trading and investment decisions. The company will not be responsible for your capital loss.
Without getting permission from the website, you are not allowed to copy the website's graphics, texts, or trademarks. Intellectual property rights in the content or data incorporated into this website belong to its providers and exchange merchants.
Not Logged In
Log in to access more features

FastBull Membership
Not yet
Purchase


Log In
Sign Up


