


- XAUUSD
- XAGUSD
- WTI
- USDX


Markets
Analysis
User
24/7
Economic Calendar
Education
Data
- Names
- Latest
- Prev


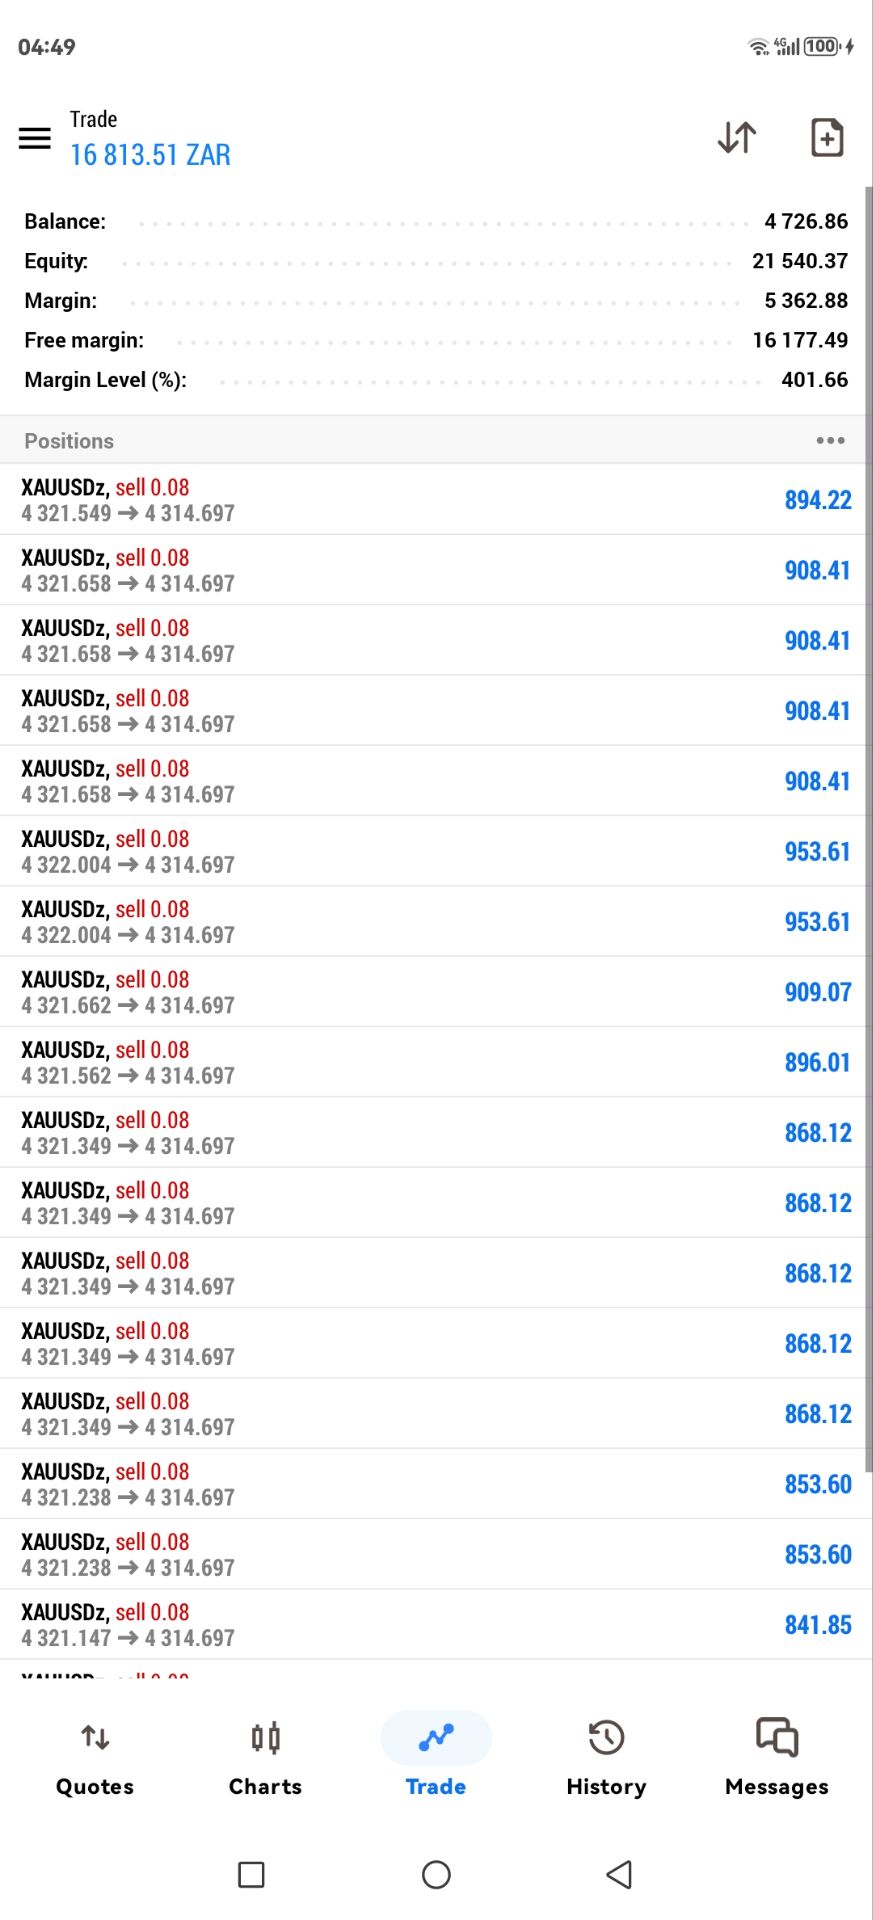
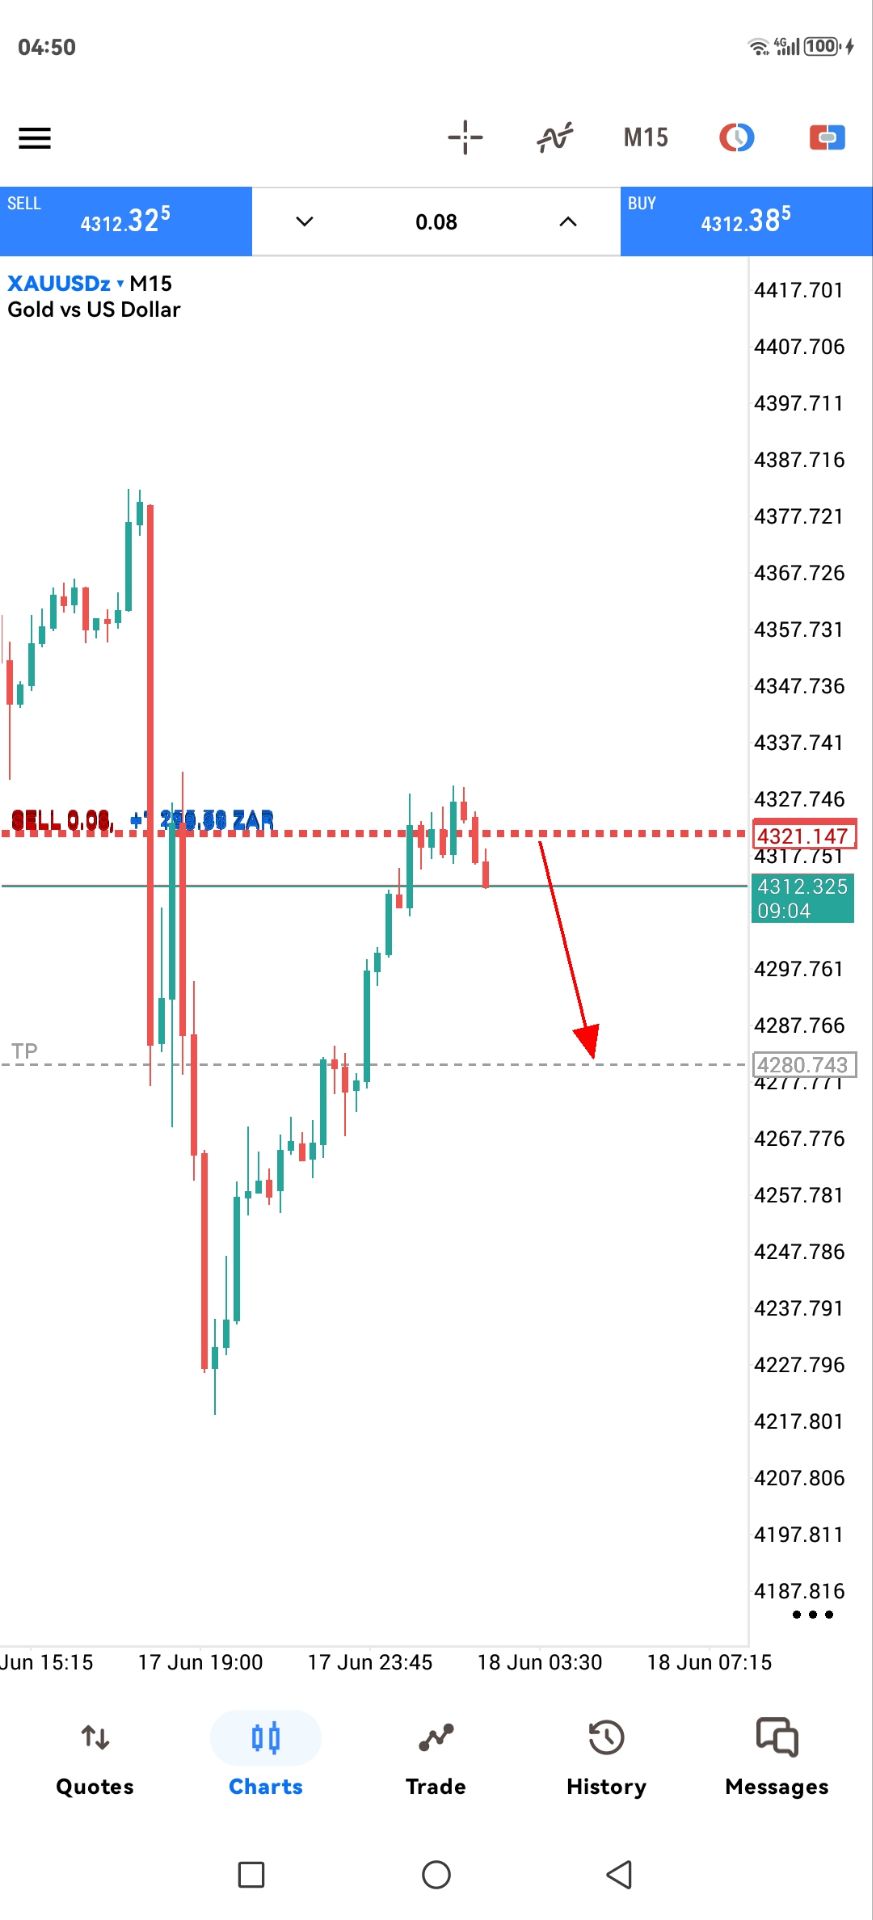
 早上你的多我没有进到还在睡觉…行情太迅猛了


Look past the volatility. We demystify the fundamental of shares, offering the rigorous, data-driven framework required to identify true business value today.
Understanding the fundamental of shares is the bedrock of successful, long-term investing. This guide helps smart investors look past daily market noise by evaluating a company's financial health, valuation metrics, and core business strength. You will learn how to read financial statements, spot red flags, and make data-driven decisions that build sustainable wealth.

Share fundamentals represent the core qualitative and quantitative factors that determine a company’s financial health and true intrinsic value. Unlike short-term price movements driven by market sentiment, fundamentals reflect the actual business reality. If a company consistently grows its revenue, manages debt efficiently, and increases profit margins, its stock price will eventually follow.
Warren Buffett and other legendary value investors emphasize that a share is simply a fractional ownership stake in a real business. When you understand the fundamental analysis of shares, you stop speculating on price charts and start evaluating business performance. Strong fundamentals act as a financial anchor, protecting investors during market downturns while driving compounding growth during bull markets.
A company's financial statements generate dozens of data points, but only a few metrics provide immediate insight into stock valuation. The most effective fundamental metrics help you gauge profitability, growth potential, and whether the market is pricing the stock fairly.
The P/E ratio is the most widely recognized valuation metric, calculated by dividing a company's current share price by its earnings per share. It tells you exactly how much you are paying for one dollar of the company's profit. A high P/E ratio suggests investors expect robust future growth, but it also increases the risk of overpaying.
Conversely, a low P/E ratio might indicate an undervalued stock or a company in terminal decline. Investors must always compare a company's P/E ratio against its historical averages and its direct industry peers. For example, tech companies typically command higher P/E ratios than mature utility companies.
Earnings Per Share (EPS) reveals how much of a company's net income is allocated to each outstanding share of common stock. It serves as the ultimate indicator of a company’s baseline profitability. When a company reports consistently rising EPS, it demonstrates that management is effectively generating profit for its owners.
There are two primary types of EPS to monitor: Trailing EPS (based on the past 12 months) and Forward EPS (based on projected earnings). Investors should focus on long-term EPS growth trends rather than isolated quarterly spikes, which can be distorted by one-time tax benefits or asset sales.
Traditionally, the Price-to-Book (P/B) ratio compared a company's market value to its net assets, helping investors find deeply discounted manufacturing or financial stocks. However, in today’s digital economy, the P/B ratio often fails to capture a modern company's true worth. Technology and service-based firms derive immense value from intangible assets like software, patents, and brand recognition, which do not appear at full value on the balance sheet.
Instead of relying solely on P/B, modern investors should evaluate the Price-to-Free-Cash-Flow (P/FCF) ratio. This metric tracks the actual cash leaving the business after capital expenditures, providing a much clearer picture of a modern company's financial flexibility. It highlights businesses that generate strong, unencumbered cash flows regardless of their hard asset footprint.
Dividend yield measures the annual cash dividend paid per share relative to the current stock price, offering a snapshot of your cash return on investment. For income-focused investors, a stable dividend yield is highly attractive, especially during sideways markets. However, a yield that looks artificially high can be a trap, signaling a recent stock price collapse rather than a generous payout policy.
To ensure the dividend is sustainable, you must check the payout ratio, which measures the percentage of earnings paid out as dividends. A healthy payout ratio typically sits below 60%, leaving the company with enough retained earnings to reinvest in future growth. If a company is paying out more than it earns, a dividend cut is almost inevitable.
Mastering financial statements is non-negotiable for serious investors. These three documents—the Income Statement, Balance Sheet, and Cash Flow Statement—interlock to reveal the true financial trajectory of the business.
The income statement, or profit and loss (P&L) statement, shows a company's revenues and expenses over a specific period. The top line represents total sales, while the bottom line reveals net income. Smart investors read this statement top-down to assess whether revenue growth is translating into higher profits.
It is crucial to analyze operating profit margins rather than just gross revenue. If revenue is growing at 10% but the cost of goods sold is rising at 20%, the business is becoming less efficient. Consistent margin expansion is one of the strongest indicators of a company's competitive advantage.
The balance sheet provides a financial snapshot of a company's assets, liabilities, and shareholders' equity at a specific moment in time. The fundamental accounting equation dictates that Assets must equal Liabilities plus Shareholders' Equity. This document helps you assess a company's liquidity and long-term solvency.
Investors should closely examine the debt-to-equity ratio and the current ratio. A business heavily burdened by short-term debt and low cash reserves is highly vulnerable to interest rate hikes and economic downturns. Conversely, a fortress balance sheet with high cash reserves provides management with the flexibility to acquire competitors or buy back stock.
Accounting rules allow companies to recognize revenue before cash actually changes hands, which can sometimes make the income statement look artificially robust. The cash flow statement strips away these accounting accruals to track the actual cash entering and exiting the company's bank accounts.
Operating cash flow is the most critical metric here, as it proves whether the core business model is sustainable. If a company reports massive net income on its P&L but shows negative operating cash flow year after year, it is a massive red flag. Cash flow ultimately pays the dividends and funds future business expansion.
Analyzing individual metrics in isolation is dangerous. Successful investing requires synthesizing these fundamental data points into a cohesive valuation model. You must determine whether the current stock price accurately reflects the business's intrinsic value.
No fundamental metric exists in a vacuum. To determine if a stock is cheap or expensive, you must benchmark its ratios against direct competitors and the broader industry average. A P/E of 25 might be expensive for an automotive manufacturer but dirt-cheap for a high-growth cloud computing firm.
Creating a comparative framework is one of the easiest ways to evaluate relative valuation:
| Valuation Metric | What It Measures | When It Signals Undervaluation | When It Signals Overvaluation |
|---|---|---|---|
| P/E Ratio | Price per dollar of earnings | Lower than peers with similar growth | Significantly higher than industry average |
| P/FCF | Price per dollar of free cash flow | Single-digit ratios with growing cash | High multiples with shrinking cash reserves |
| Debt-to-Equity | Financial leverage and risk | Below 1.0 (industry dependent) | Above 2.0 with rising interest rates |
| PEG Ratio | P/E ratio adjusted for growth | Below 1.0 indicates cheap growth | Above 2.0 indicates overpriced growth |
Even a company with a brilliant P/E ratio and strong revenue growth can be a wealth trap if qualitative red flags exist. Fundamental analysis requires reading the footnotes of official corporate earnings reports and tracking executive behavior.
Key warning signs include high executive turnover, sudden changes in accounting firms, or complex off-balance-sheet entities. Additionally, if management constantly issues new shares to fund operations, they are diluting your ownership stake. Always ensure that the leadership team's incentives align with long-term shareholder value.
For new investors, jumping into complex discounted cash flow models can be overwhelming. The best approach is to start with a structured, educational framework before risking real capital. Many business students learn the ropes by drafting a fundamental vs technical analysis of shares project, which teaches the core differences between assessing business value and predicting price trends based on chart patterns. Building a detailed fundamental vs technical analysis of shares project report is a great way to formalize your understanding of when to use each method practically.
Reading established literature is also a highly effective starting point. You might look for a fundamental analysis of shares book that breaks down concepts like return on equity, balance sheets, and competitive moats into digestible language. For instance, Fundamental Analysis of Shares by Ankit Gala is a popular text often used by retail investors to grasp intrinsic valuation concepts systematically.
To practice, try downloading a company's annual report or finding a free fundamental analysis of shares pdf online to study real-world examples. Begin by picking one industry you understand, mapping out the P/E and EPS of three competing companies, and deciding which offers the best overall value based on the data.
Fundamental analysis of stocks is the process of evaluating a company's intrinsic value by examining related economic, financial, and other qualitative and quantitative factors. It aims to determine whether a stock is currently overvalued or undervalued by the broader market.
You perform fundamental analysis by analyzing a company's financial statements, calculating valuation ratios like P/E and EPS, and assessing industry trends. You must also evaluate qualitative factors such as management quality, corporate governance, and competitive advantages.
Fundamental analysis evaluates a stock's intrinsic value based on financial performance and underlying business health. Technical analysis relies exclusively on historical price charts and trading volume to predict short-term market movements.
The most important fundamental metrics include the Price-to-Earnings (P/E) ratio, Earnings Per Share (EPS), Free Cash Flow, and Return on Equity (ROE). These metrics help investors determine baseline profitability, growth potential, and relative valuation compared to peers.
Mastering the fundamental of shares gives you the confidence to navigate volatile markets and identify high-quality businesses. By consistently evaluating financial health, key valuation metrics, and qualitative factors, you can build a highly resilient portfolio. Start applying these principles today to make smarter, long-term investment decisions.
728 RM B 7/F GEE LOK IND BLDG NO 34 HUNG TO RD KWUN TONG KLN HONG KONG


The risk of loss in trading financial instruments such as stocks, FX, commodities, futures, bonds, ETFs and crypto can be substantial. You may sustain a total loss of the funds that you deposit with your broker. Therefore, you should carefully consider whether such trading is suitable for you in light of your circumstances and financial resources.
No decision to invest should be made without thoroughly conducting due diligence by yourself or consulting with your financial advisors. Our web content might not suit you since we don't know your financial conditions and investment needs. Our financial information might have latency or contain inaccuracy, so you should be fully responsible for any of your trading and investment decisions. The company will not be responsible for your capital loss.
Without getting permission from the website, you are not allowed to copy the website's graphics, texts, or trademarks. Intellectual property rights in the content or data incorporated into this website belong to its providers and exchange merchants.
Not Logged In
Log in to access more features


Log In
Sign Up


