• Trade
  • Markets
  • Copy
  • Contests
  • News
  • 24/7
  • Calendar
  • Q&A
  • Chats
Trending
Screeners
SYMBOL
LAST
BID
ASK
HIGH
LOW
NET CHG.
%CHG.
SPREAD
SPX
S&P 500 Index
6806.01
6806.01
6806.01
6861.30
6801.50
-21.40
-0.31%
--
DJI
Dow Jones Industrial Average
48301.95
48301.95
48301.95
48679.14
48285.67
-156.09
-0.32%
--
IXIC
NASDAQ Composite Index
23059.70
23059.70
23059.70
23345.56
23012.00
-135.46
-0.58%
--
USDX
US Dollar Index
97.950
98.030
97.950
98.070
97.740
0.000
0.00%
--
EURUSD
Euro / US Dollar
1.17459
1.17468
1.17459
1.17686
1.17262
+0.00065
+ 0.06%
--
GBPUSD
Pound Sterling / US Dollar
1.33668
1.33677
1.33668
1.34014
1.33546
-0.00039
-0.03%
--
XAUUSD
Gold / US Dollar
4302.60
4303.03
4302.60
4350.16
4285.08
+3.21
+ 0.07%
--
WTI
Light Sweet Crude Oil
56.416
56.446
56.416
57.601
56.233
-0.817
-1.43%
--

Community Accounts

Signal Accounts
--
Profit Accounts
--
Loss Accounts
--
View More

Become a signal provider

Sell trading signals to earn additional income

View More

Guide to Copy Trading

Get started with ease and confidence

View More

Signal Accounts for Members

All Signal Accounts

Best Return
  • Best Return
  • Best P/L
  • Best MDD
Past 1W
  • Past 1W
  • Past 1M
  • Past 1Y

All Contests

  • All
  • Trump Updates
  • Recommend
  • Stocks
  • Cryptocurrencies
  • Central Banks
  • Featured News
Top News Only
Share

Russian Troops Control All Of Kupiansk - IFX Cites Russian Military

Share

On Monday (December 15), The South Korean Won Ultimately Rose 0.60% Against The US Dollar, Closing At 1468.91 Won. The Won Was On An Upward Trend Throughout The Day, Rising Significantly At 17:00 Beijing Time And Reaching A Daily High Of 1463.04 Won At 17:36

Share

Health Ministry: Israeli Forces Kill Palestinian Teen In West Bank

Share

New York Federal Reserve President Williams: Over Time, The Size Of Reserves Could Grow From $2.9 Trillion

Share

New York Fed President Williams: AI Valuations Are High, But There Is A Real Driving Factor

Share

New York Federal Reserve President Williams: The Job Market Is In Very Good Shape

Share

New York Fed President Williams: 'Very Supportive' Of USA Central Bank's Decision To Cut Interest Rates Last Week

Share

New York Fed President Williams: 'Too Early To Say' What Central Bank Should Do At January Meeting

Share

New York Fed President Williams: Strong Markets Part Of Reason Why Economy Will Grow Robustly In 2026

Share

New York Fed President Williams: What Constitutes Ample Reserves Will Change Over Time

Share

New York Fed President Williams: Market Valuations 'Elevated,' But There Are Reasons For Pricing

Share

New York Fed President Williams: Ample Reserves System Working Very Well

Share

New York Fed President Williams: Some Signs That Parts Of Underlying Economy Not As Strong As GDP Data Suggests

Share

New York Fed President Williams: Expects Coming Job Data Will Show Gradual Cooling

Share

Ukraine President Zelenskiy: Monitoring Of Ceasefire Should Be Part Of Security Guarantees

Share

Ukraine President Zelenskiy: Ukraine Needs Clear Understanding On Security Guarantees Before Taking Any Decisions Regarding Frontlines

Share

U.S. Commerce Secretary Rutnick Praised Korea Zinc Co. Ltd., Stating That The United States Will Have Priority Access To The Company's Products In 2026

Share

Ukraine President Zelenskiy: USA Passed On Russian Demands

Share

Zelenskiy Says: Don't Think USA Was Demanding Anything On Territories

Share

Merz: USA Has Offered Ukraine Considerable Security Guarantees

TIME
ACT
FCST
PREV
Japan Tankan Small Manufacturing Outlook Index (Q4)

A:--

F: --

P: --

Japan Tankan Large Non-Manufacturing Outlook Index (Q4)

A:--

F: --

P: --

Japan Tankan Large Manufacturing Outlook Index (Q4)

A:--

F: --

P: --

Japan Tankan Small Manufacturing Diffusion Index (Q4)

A:--

F: --

P: --

Japan Tankan Large-Enterprise Capital Expenditure YoY (Q4)

A:--

F: --

P: --

U.K. Rightmove House Price Index YoY (Dec)

A:--

F: --

P: --

China, Mainland Industrial Output YoY (YTD) (Nov)

A:--

F: --

P: --

China, Mainland Urban Area Unemployment Rate (Nov)

A:--

F: --

P: --

Saudi Arabia CPI YoY (Nov)

A:--

F: --

P: --

Euro Zone Industrial Output YoY (Oct)

A:--

F: --

P: --

Euro Zone Industrial Output MoM (Oct)

A:--

F: --

P: --

Canada Existing Home Sales MoM (Nov)

A:--

F: --

P: --

Canada National Economic Confidence Index

A:--

F: --

P: --

Canada New Housing Starts (Nov)

A:--

F: --

P: --
U.S. NY Fed Manufacturing Employment Index (Dec)

A:--

F: --

P: --

U.S. NY Fed Manufacturing Index (Dec)

A:--

F: --

P: --

Canada Core CPI YoY (Nov)

A:--

F: --

P: --

Canada Manufacturing Unfilled Orders MoM (Oct)

A:--

F: --

P: --

U.S. NY Fed Manufacturing Prices Received Index (Dec)

A:--

F: --

P: --

U.S. NY Fed Manufacturing New Orders Index (Dec)

A:--

F: --

P: --

Canada Manufacturing New Orders MoM (Oct)

A:--

F: --

P: --

Canada Core CPI MoM (Nov)

A:--

F: --

P: --

Canada Trimmed CPI YoY (SA) (Nov)

A:--

F: --

P: --

Canada Manufacturing Inventory MoM (Oct)

A:--

F: --

P: --

Canada CPI YoY (Nov)

A:--

F: --

P: --

Canada CPI MoM (Nov)

A:--

F: --

P: --

Canada CPI YoY (SA) (Nov)

A:--

F: --

P: --

Canada Core CPI MoM (SA) (Nov)

A:--

F: --

P: --

Canada CPI MoM (SA) (Nov)

A:--

F: --

P: --

Federal Reserve Board Governor Milan delivered a speech
U.S. NAHB Housing Market Index (Dec)

A:--

F: --

P: --

Australia Composite PMI Prelim (Dec)

--

F: --

P: --

Australia Services PMI Prelim (Dec)

--

F: --

P: --

Australia Manufacturing PMI Prelim (Dec)

--

F: --

P: --

Japan Manufacturing PMI Prelim (SA) (Dec)

--

F: --

P: --

U.K. 3-Month ILO Employment Change (Oct)

--

F: --

P: --

U.K. Unemployment Claimant Count (Nov)

--

F: --

P: --

U.K. Unemployment Rate (Nov)

--

F: --

P: --

U.K. 3-Month ILO Unemployment Rate (Oct)

--

F: --

P: --

U.K. Average Weekly Earnings (3-Month Average, Including Bonuses) YoY (Oct)

--

F: --

P: --

U.K. Average Weekly Earnings (3-Month Average, Excluding Bonuses) YoY (Oct)

--

F: --

P: --

France Services PMI Prelim (Dec)

--

F: --

P: --

France Composite PMI Prelim (SA) (Dec)

--

F: --

P: --

France Manufacturing PMI Prelim (Dec)

--

F: --

P: --

Germany Services PMI Prelim (SA) (Dec)

--

F: --

P: --

Germany Manufacturing PMI Prelim (SA) (Dec)

--

F: --

P: --

Germany Composite PMI Prelim (SA) (Dec)

--

F: --

P: --

Euro Zone Composite PMI Prelim (SA) (Dec)

--

F: --

P: --

Euro Zone Services PMI Prelim (SA) (Dec)

--

F: --

P: --

Euro Zone Manufacturing PMI Prelim (SA) (Dec)

--

F: --

P: --

U.K. Services PMI Prelim (Dec)

--

F: --

P: --

U.K. Manufacturing PMI Prelim (Dec)

--

F: --

P: --

U.K. Composite PMI Prelim (Dec)

--

F: --

P: --

Euro Zone ZEW Economic Sentiment Index (Dec)

--

F: --

P: --

Germany ZEW Current Conditions Index (Dec)

--

F: --

P: --

Germany ZEW Economic Sentiment Index (Dec)

--

F: --

P: --

Euro Zone Trade Balance (Not SA) (Oct)

--

F: --

P: --

Euro Zone ZEW Current Conditions Index (Dec)

--

F: --

P: --

Euro Zone Trade Balance (SA) (Oct)

--

F: --

P: --

Euro Zone Total Reserve Assets (Nov)

--

F: --

P: --

U.K. Inflation Rate Expectations

--

F: --

P: --

Q&A with Experts
    • All
    • Chatrooms
    • Groups
    • Friends
    Connecting
    .
    .
    .
    Type here...
    Add Symbol or Code

      No matching data

      All
      Trump Updates
      Recommend
      Stocks
      Cryptocurrencies
      Central Banks
      Featured News
      • All
      • Russia-Ukraine Conflict
      • Middle East Flashpoint
      • All
      • Russia-Ukraine Conflict
      • Middle East Flashpoint
      Search
      Products

      Charts Free Forever

      Chats Q&A with Experts
      Screeners Economic Calendar Data Tools
      Membership Features
      Data Warehouse Market Trends Institutional Data Policy Rates Macro

      Market Trends

      Market Sentiment Order Book Forex Correlations

      Top Indicators

      Charts Free Forever
      Markets

      News

      News Analysis 24/7 Columns Education
      From Institutions From Analysts
      Topics Columnists

      Latest Views

      Latest Views

      Trending Topics

      Top Columnists

      Latest Update

      Signals

      Copy Rankings Latest Signals Become a signal provider AI Rating
      Contests
      Brokers

      Overview Brokers Assessment Rankings Regulators News Claims
      Broker listing Forex Brokers Comparison Tool Live Spread Comparison Scam
      Q&A Complaint Scam Alert Videos Tips to Detect Scam
      More

      Business
      Events
      Careers About Us Advertising Help Center

      White Label

      Data API

      Web Plug-ins

      Affiliate Program

      Awards Institution Evaluation IB Seminar Salon Event Exhibition
      Vietnam Thailand Singapore Dubai
      Fans Party Investment Sharing Session
      FastBull Summit BrokersView Expo
      Recent Searches
        Top Searches
          Markets
          News
          Analysis
          User
          24/7
          Economic Calendar
          Education
          Data
          • Names
          • Latest
          • Prev

          View All

          No data

          Scan to Download

          Faster Charts, Chat Faster!

          Download App
          English
          • English
          • Español
          • العربية
          • Bahasa Indonesia
          • Bahasa Melayu
          • Tiếng Việt
          • ภาษาไทย
          • Français
          • Italiano
          • Türkçe
          • Русский язык
          • 简中
          • 繁中
          Open Account
          Search
          Products
          Charts Free Forever
          Markets
          News
          Signals

          Copy Rankings Latest Signals Become a signal provider AI Rating
          Contests
          Brokers

          Overview Brokers Assessment Rankings Regulators News Claims
          Broker listing Forex Brokers Comparison Tool Live Spread Comparison Scam
          Q&A Complaint Scam Alert Videos Tips to Detect Scam
          More

          Business
          Events
          Careers About Us Advertising Help Center

          White Label

          Data API

          Web Plug-ins

          Affiliate Program

          Awards Institution Evaluation IB Seminar Salon Event Exhibition
          Vietnam Thailand Singapore Dubai
          Fans Party Investment Sharing Session
          FastBull Summit BrokersView Expo

          Ethereum's Critical $4K Test: Could It Surge to $6K?

          Michelle

          Cryptocurrency

          Summary:

          Ethereum faces $4K resistance; a breakthrough could lead to a surge toward $6K. A rejection at $4K may trigger a pullback to $3,500-$3,200. ETH trading volume remains strong, but market caution prevails as it tests key resistance.

          Ethereum (ETH) has been trading at a significant price point, with the digital asset now nearing a key resistance level of $4000. This mark has drawn attention due to its potential to shape the next movement in the market.

          According to Crypto Patel, Ethereum's recent price rally has sparked optimism among investors, especially those who purchased the asset when its value was below $1500. As ETH continues its upward trajectory, traders are focused on the $4000 level, which has been acting as a multi-month resistance.

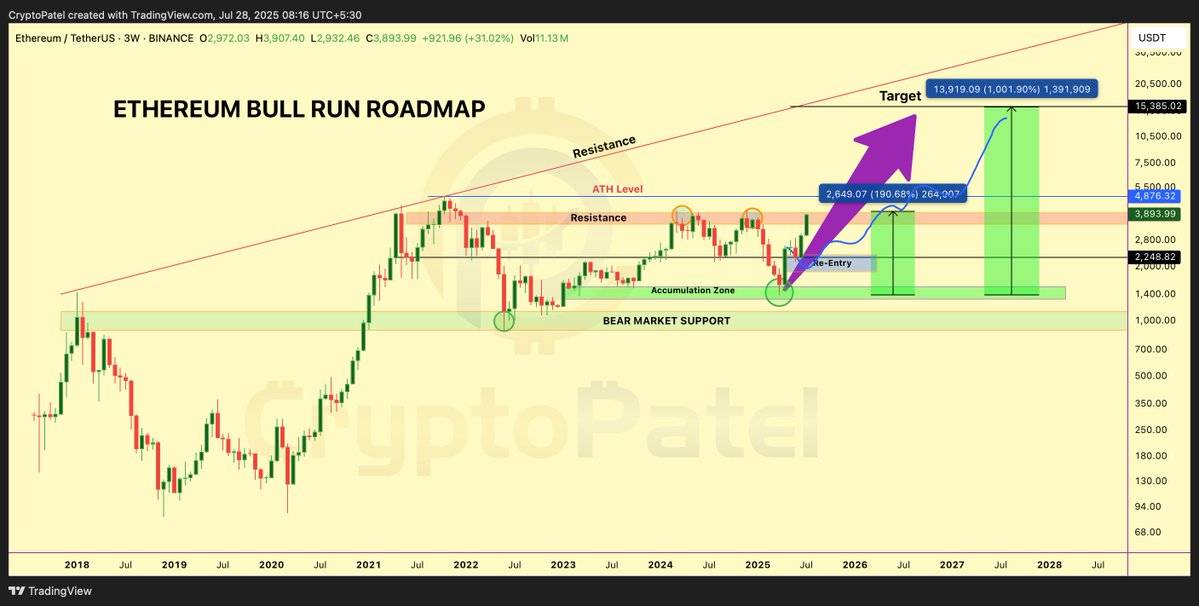
          Ethereum breakout | Source: X

          Ethereum breaks through this level, and there are expectations that it could head towards its previous all-time high (ATH) of $6000 or more. A sustained breakout above this resistance could signal continued strength in the asset's price. If rejected at this level, some experts anticipate a decline, potentially pulling ETH back below the $3500-$3200 range.

          Resistance and Support Dynamics

          Crypto analyst ZAYK Charts notes that if Ethereum manages to break above $4,000, it could open the door for a potential surge toward the $6,000 mark, a significant increase from its current price.

          A successful breakout could indicate continued strength and set the stage for further price growth in the coming months. However, it could also establish the $4000 level as a new support zone, further reinforcing the bullish sentiment surrounding Ethereum.

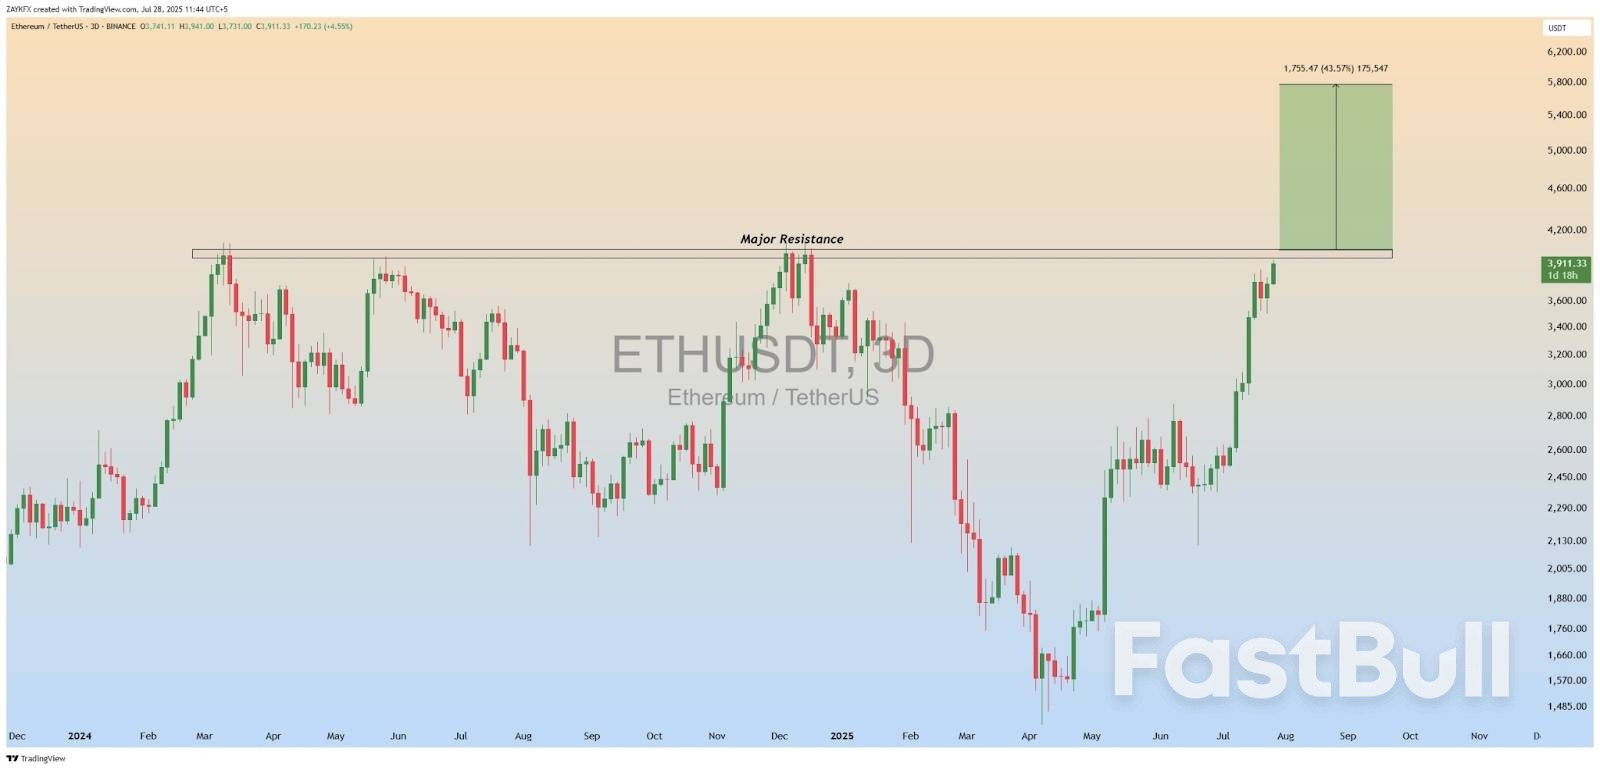
          Ethereum Bullish | Source: X

          Both short-term traders and long-term investors closely watch this price action. Many are considering the potential for Ethereum to move higher if the resistance at $4000 is cleared.

          Ethereum’s Trading Volume and Market Sentiment

          At the time of writing, ETH is priced at approximately $3,890, reflecting a 3.10% increase in the last 24 hours. Ethereum remains active in terms of trading volume, with over $34 billion in transactions reported within the past 24 hours.

          Despite this significant trading activity, market observers remain cautious as Ethereum faces its next critical decision point. Should the asset manage to surpass this level, a strong bullish trend may continue.

          Conversely, a rejection could lead to a consolidation phase or a downward adjustment in price. Traders are advised to monitor this crucial level closely.

          Source: CryptoSlate

          Risk Warnings and Disclaimers
          You understand and acknowledge that there is a high degree of risk involved in trading. Following any strategies or investment methods may lead to potential losses. The content on the site is provided by our contributors and analysts for information purposes only. You are solely responsible for determining whether any trading assets, securities, strategy, or any other product is suitable for investing based on your own investment objectives and financial situation.
          Add to Favorites
          Share

          U.S.-EU trade deal, U.S.-China talks kick off pivotal week - what’s moving markets

          Adam

          Economic

          U.S. stock futures tick up after the U.S. and European Union agree to a crucial deal that averts a potentially damaging trade war. Attention now turns to talks between the U.S. and China in Sweden, where media reports have suggested that the world’s two largest economies may decide to extend a trade truce. Along with an August 1 deadline for elevated "reciprocal" U.S. tariffs to kick in on a slate of countries, this pivotal week for markets will also feature a string of big-name corporate earnings, crucial economic data, and a much-anticipated Federal Reserve interest rate decision.

          Futures rise

          U.S. stock futures pointed higher on Monday, as investors digested key trade developments and looked ahead to a wave of major earnings, economic data and central bank decisions this week.
          By 03:25 ET (07:25 GMT), the Dow futures contract had risen by 146 points, or 0.3%, S&P 500 futures had climbed by 25 points, or 0.4%, and Nasdaq 100 futures had increased by 127 points, or 0.5%.
          The benchmark S&P 500 and tech-heavy Nasdaq both logged record closing highs at the end of the previous session on Friday, extending a strong run for Wall Street. Upbeat quarterly results, as well as the prospect of more certainty around often erratic U.S. tariff plans, have helped to support equities in recent weeks.
          U.S. stock markets looked to be receiving a strong handover from Europe, where their counterparts rose to a four-month high.

          U.S.-EU trade deal

          The United States and European Union have reached a landmark trade agreement that includes a 15% tariff on EU goods entering the U.S., President Donald Trump announced Sunday while in Scotland.
          The broad-strokes deal encompasses significant EU purchases of U.S. energy and military gear, along with substantial investments in the American economy.
          According to Trump, the European Union has committed to purchasing $750 billion worth of energy from the United States. He also stated that the EU has agreed to make $600 billion in investments in the U.S.
          "They are agreeing to open up their countries to trade at zero tariff," Trump told reporters. He added that the EU would "purchase a vast amount of military equipment" from the U.S.
          European Commission President Ursula von der Leyen confirmed the agreement would include 15% tariffs across the board, noting that this measure would help "rebalance" trade between the two major trading partners. Of the $3.3 trillion in goods imported by the U.S. last year, more than $600 billion came from the 27-member EU.
          The pact could help bring some calm to investors, who had been wary that both sides could fail to reach a deal before August 1, when Trump’s sweeping "reciprocal" tariffs are due to come into effect. The EU had been facing heightened levies of 30%, and had reportedly been pushing for a zero-for-zero agreement with the White House.

          U.S. and China to extend trade truce - reports

          The U.S. and China are expected to extend their tariff truce by an additional 90 days during trade talks starting Monday in Stockholm, the South China Morning Post (SCMP) reported on Sunday, citing sources close to the discussions.
          The temporary suspension of most tariffs, agreed in May, is set to expire on August 12.
          According to the SCMP report, both sides will use the third round of negotiations to outline their positions on unresolved issues, including U.S. concerns over China’s industrial overcapacity, rather than pursue immediate breakthroughs.
          Sources told SCMP that during the extension, neither side plans to impose new tariffs or escalate the trade conflict. Beijing is also expected to seek clarity from Washington over the 20% tariffs imposed on Chinese goods in March related to fentanyl concerns, the report said.
          Trump said Sunday the U.S. is “very close” to a deal with China, but did not elaborate. In an editorial on Sunday, China’s People’s Daily said Beijing remains committed to resolving disputes through equal dialogue and mutual respect.
          Meanwhile, the Financial Times reported that the U.S. has paused curbs on tech exports to China to avoid disrupting these talks.

          Jam-packed week ahead for markets

          Markets are now gearing up for a week that analysts at ING have described as a "massive" week for the U.S. economy.
          Along with a possible string of trade deals before August 1, the coming days will see a raft of corporate earnings, including returns from mega-cap tech titans like Facebook-owner Meta Platforms, Microsoft, Apple , and Amazon.
          July’s nonfarm payrolls report and a reading of inflation closely monitored by the Federal Reserve are also scheduled to be released, while the Fed itself will unveil its latest interest rate decision on Wednesday.
          Fed officials are widely anticipated to leave borrowing costs unchanged, even as Trump has placed intensifying pressure on the central bank -- and Chair Jerome Powell in particular -- to quickly lower rates. Policymakers have recently signaled a "wait-and-see" approach to further rate decisions, partly citing uncertainty around the trajectory of Trump’s levies and their impact on the wider economy.

          Gold holds firm

          Gold prices held firm on Monday, as traders eyed bolstered risk appetite following the trade deal between the U.S. and EU. and exercised caution ahead of the Fed interest rate decision this week.
          Investors may be particularly keen to hear what officials may have to say about the path ahead for the U.S. economy in the second half of 2025. The prospect of rate cuts later this year could provide some support to gold, which tends to do better in low borrowing-cost environments.
          Spot Gold edged up 0.1% to $3,340.02 an ounce, while Gold futures also gained 0.1% to $3,396.67/oz by 03:29 ET.
          Elsewhere, optimism that the U.S.-EU pact will avert a damaging trade war gave lift to oil prices, while the improved risk sentiment boosted Bitcoin.

          source: investing

          To stay updated on all economic events of today, please check out our Economic calendar
          Risk Warnings and Disclaimers
          You understand and acknowledge that there is a high degree of risk involved in trading. Following any strategies or investment methods may lead to potential losses. The content on the site is provided by our contributors and analysts for information purposes only. You are solely responsible for determining whether any trading assets, securities, strategy, or any other product is suitable for investing based on your own investment objectives and financial situation.
          Add to Favorites
          Share

          S&P 500 Rally Faces $11 Trillion Gauntlet of Big Tech Earnings

          Glendon

          Economic

          Stocks

          The S&P 500 Index’s relentless advance to record highs faces a crucial test this week, with four technology behemoths worth a combined $11.3 trillion reporting earnings over a two-day stretch.

          This earnings season is off to a solid start, but now all eyes are on quarterly results from Microsoft Corp. and Meta Platforms Inc. on Wednesday, and Apple Inc. and Amazon.com Inc. on Thursday. The announcements will give investors a key glimpse into the health of businesses ranging from electronic devices and software to cloud-computing and e-commerce.

          A strong showing is critical to sustaining the S&P 500’s rally. The four firms — members of the Magnificent Seven — account for a fifth of the market-capitalization-weighted benchmark. What’s more, Meta and Microsoft are among the top three point gainers in the S&P this year, after Nvidia Corp. With valuations climbing, the focus will be not only on whether they beat estimates, but also on their outlook for the coming quarters.

          “The bar is set pretty high,” said Michael Arone, chief investment strategist at State Street Investment Management. “The Magnificent Seven in particular, they really need to deliver now to keep this momentum going.”

          So far, Corporate America appears to be taking President Donald Trump’s tariffs in stride. With about a third of S&P 500 members having reported, roughly 82% have beaten profit forecasts, on track for the best quarter in about four years, data compiled by Bloomberg Intelligence show. The performance has helped lift the benchmark by about 2% since the cycle kicked off around two weeks ago.

          To be fair, analysts had slashed estimates over the past few months amid concerns about the impact of tariffs on consumer spending and profit margins. While Big-Tech projections have come down too, the surge in stock prices has kept expectations elevated.

          The Magnificent Seven, which also includes Nvidia, Alphabet Inc. and Tesla Inc., is projected to deliver combined year-over-year earnings growth of 16% in the second quarter, according to data compiled by BI. That’s down from expectations of 19% at the end of March, before Trump announced his sweeping tariffs. Nvidia is the final member of the group to report, in late August.

          The S&P 500, meanwhile, is expected to show annual profit growth of 4.5%, down from the 7.5% projected in March.

          Source: Yahoo Finance

          To stay updated on all economic events of today, please check out our Economic calendar
          Risk Warnings and Disclaimers
          You understand and acknowledge that there is a high degree of risk involved in trading. Following any strategies or investment methods may lead to potential losses. The content on the site is provided by our contributors and analysts for information purposes only. You are solely responsible for determining whether any trading assets, securities, strategy, or any other product is suitable for investing based on your own investment objectives and financial situation.
          Add to Favorites
          Share

          London Midday: Stocks Pare Gains as Investors Assess US-EU Trade Deal

          Warren Takunda

          Economic

          Stocks

          London stocks had pared earlier gains to trade just a touch higher by midday on Monday as investors continued to assess the impact of the US-EU trade deal struck over the weekend.
          The FTSE 100 was up 0.1% at 9,124.65.
          Sentiment was lifted after US President Donald Trump and European Commission President Ursula von der Leyen agreed a trade deal that will see the EU pay 15% tariffs on most goods entering the US. Trump had threatened to implement a 30% tariff from Friday.
          Russ Mould, investment director at AJ Bell, said: "The much-awaited trade agreement between the US and the EU has finally been struck, sending a wave of relief across financial markets.
          "As widely expected, the agreed tariffs aren’t as high as previously feared, which means investors are taking the trade agreement as a massive win.
          "In reality, this is far from a done deal. It is only a framework and still needs to be signed into law. Furthermore, Donald Trump has form in constantly tinkering at the edges and what he says one day might not be the same as the next.
          "Investors are taking each bit of news one day at a time and today is one of celebration. The agreement is significant because it avoids a trade war between the US and the EU, which could have been troublesome for economic growth and investor sentiment."
          On home shores, the latest survey from the Confederation of British Industry showed that retail sales continued to struggle in July as rising prices and economic uncertainty weighed on household demand, although the pace of decline slowed from June.
          The retail sales volume balance was -34%, up from -46% a month earlier, but marking the tenth consecutive month of decline.
          The balance of expected sales improved to -31 in July from -49 the month before, with retailers expecting sales to fall at a broadly similar pace next month.
          Martin Sartorius, principal economist at the CBI, said: "Retail annual sales volumes continued to fall in July, although the pace of decline moderated from June’s sharp drop. Firms reported that elevated price pressures - driven by rising labour costs - and economic uncertainty continue to weigh on household demand, which has contributed to sales volumes falling since October 2024. These trends of weak demand and uncertainty were mirrored across the wider distribution sector, with wholesale and motor trades also seeing declining sales.
          "With long-term strategic ambitions outlined, the government must now seek to build shorter term confidence in its growth mission. It can do this by collaborating with business to deliver an Autumn Budget that acknowledges the burden firms are facing and sets clear policy delivery targets. This includes providing clarity on how the government will deliver its action plan to tackle regulatory barriers to growth, position businesses to invest in the people they need through a flexible Growth and Skills Levy, and find an appropriate landing zone for the Employment Rights Bill."
          In equity markets, GSK rallied after saying it has entered into a partnership with Chinese pharmaceutical outfit Hengrui Pharma to jointly develop up to 12 medicines, providing new growth opportunities for the UK pharmaceutical group beyond 2031.
          FirstGroup advanced after saying it has bought Tetley's Coaches, a Leeds-based coach and bus operator that has been in operation for over 75 years, for an undisclosed sum.
          IT support and services firm Computacenter reversed earlier heavy losses as it said it continues to expect FY25 adjusted operating profits to be ahead of FY26 after delivering "strong” revenue growth in the first half.
          However, it also said it experienced softer trading in Germany and France in the second quarter, with the performance in France significantly weaker than last year.
          Computacenter said that while the broader geopolitical and macro uncertainty is expected to persist, it expects some recovery in public sector activity in Germany in the second half while France is expected to remain challenging.
          On the downside, food producer Cranswick turned lower after it held annual guidance as like-for-like revenue rose 7.9% on the back of new business wins and increasing consumer demand for natural protein.
          Cranswick still expects adjusted profit before tax to be in line with consensus expectations of between £206.5m and £213.6m.
          Ocean Wilsons - a supplier of maritime services in Brazil - tumbled after it agreed a £900m all-share merger with Hansa Investment Company.

          Source: Sharecast

          To stay updated on all economic events of today, please check out our Economic calendar
          Risk Warnings and Disclaimers
          You understand and acknowledge that there is a high degree of risk involved in trading. Following any strategies or investment methods may lead to potential losses. The content on the site is provided by our contributors and analysts for information purposes only. You are solely responsible for determining whether any trading assets, securities, strategy, or any other product is suitable for investing based on your own investment objectives and financial situation.
          Add to Favorites
          Share

          Japan: Opportunity Trumps Politics

          Winkelmann

          Stocks

          Economic

          The striking of a better-than-feared trade deal with the U.S. last week has removed a significant economic uncertainty for Japan, further bolstering the improving fundamentals of the country, and helping lift equities to near-record highs.

          Driving this was some relief among investors that while the agreed 15% tariffs on Japanese imports is higher than the 10% rate that was in force while the countries negotiated, it is lower than the 25% levy President Donald Trump had threatened. Importantly, Japan’s automotive sector, a pillar of the country’s economy and biggest contributor to its $63 billion trade surplus with the U.S., will incur the 15% rate and face no quotas on the volume of imports.The greater clarity that comes with the deal is welcome. However, in recent days, fresh political uncertainties have emerged in Japan following the July 20 elections, when the ruling coalition led by Prime Minister Ishiba lost control of the upper house of parliament.

          This was the third major election defeat after losing a majority of seats in the October 2024 lower house election and most recently in the Tokyo prefectural (metropolitan assembly) vote, which have led to calls within Ishiba’s own party for him to resign. Ishiba has said he has no plans to step down. However, mounting speculation over the Prime Minister’s potential successor and the prospect of them forming a coalition with any one of the resurgent opposition parties, which have been calling for more fiscal stimulus and lower taxes, has led to a fresh spike in long-dated Japanese government bond yields.

          As we highlighted in our analysis last month, Japan has led the march higher this year in long-dated government bond yields among advanced economies amid a renewed and sharper focus by investors on fiscal stability.

          Seeing Through the Politics

          In our view, such political machinations and volatility in the government bond market are to be closely watched, but they don’t alter our long-held constructive view on the country. We were overweight Japan equities before the U.S. trade deal was announced on July 22.

          Indeed, we see the election results as unsurprising given a number of factors—including the current administration’s mishandling of inflation and political scandals—and view any change in leadership as immaterial to Japan’s sustainable economic growth and development over the medium term. Seen another way, we believe any potential change in leadership (Ishiba was still in power at the time of writing although the situation is fluid) could even help to bring in new views and ideas on sustaining the country’s growth trajectory.There are fundamental reasons why we remain constructive on the country, as we outlined earlier this year in our white paper on Japanese equities and more recently in our Q3 Equity Market Outlook.

          First, Japan’s economy continues to gain momentum. Inflation is modestly stabilizing above the Bank of Japan’s targeted 2% and is high enough in our view to invigorate revenue and profit growth, while low unemployment and recent wage increases due to structural labor shortages have helped to boost spending among Gen-Z and Millennials. Meanwhile the stronger Japanese currency versus year-ago levels has helped to curb imported cost inflation.

          Second, thanks to the corporate governance and capital management reforms of the past several years, Japanese companies are becoming increasingly conscious of corporate value from a shareholder’s perspective. This has resulted in companies reducing their cash hoard and streamlining their cross-shareholdings, as well as making better use of their capital through growth investments, which we view as accretive for EPS growth over the medium to long term.

          Third, despite potentially stronger growth, record corporate buybacks and ongoing shareholder-friendly corporate reforms, Japanese equities remain under-owned and relatively attractive compared to global peers. For instance, the aggregate forward price-to-earnings ratio represented by the MSCI Japan Index currently stands at 15.2 times compared to 19.0 times and 22.4 times for the MSCI ACWI and S&P 500 indexes, respectively. *

          Long-Term Growth Opportunity

          As we continue to closely watch the political situation and any fresh developments in the government bond market, we maintain our constructive outlook on Japan, choosing to look through these short-term moments of flux in a country that is in a new period of economic transition.Clearly near-term risks remain, including volatile currency swings from monetary policy adjustments, which disrupted equity markets last August, but we believe high-quality Japanese companies may be an attractive long-term investment opportunity.

          Source: Neuberger Berman

          To stay updated on all economic events of today, please check out our Economic calendar
          Risk Warnings and Disclaimers
          You understand and acknowledge that there is a high degree of risk involved in trading. Following any strategies or investment methods may lead to potential losses. The content on the site is provided by our contributors and analysts for information purposes only. You are solely responsible for determining whether any trading assets, securities, strategy, or any other product is suitable for investing based on your own investment objectives and financial situation.
          Add to Favorites
          Share

          Key Elements of EU-US Trade Deal

          Michelle

          Economic

          The United States and the European Union agreed on aframework trade deal, ending months of uncertainty for industries and consumers on both sides of the Atlantic.

          Here are the main elements of the deal:

          * Almost all EU goods entering the U.S. will be subject to a 15% baseline tariff, including cars, which currently face 27.5%, as well as semiconductors and pharmaceuticals. The 15% tariff is the maximum tariff and is not added to any existing rates.

          * The U.S. is to announce the result of its 232 trade investigations in a few weeks and decide on tariff rates for the sectors under investigation. But the EU-U.S. deal already secures a 15% tariff for European chips and pharmaceuticals, so the results of the investigations will not change that, U.S. officials said. It is not yet clear, however, if the same 15% rate has been set for timber and copper, which are also under U.S. 232 investigation.

          * The U.S. and EU will have zero-for-zero tariffs on all aircraft and their components, certain chemicals, certain generic drugs, semiconductor equipment, some agricultural products, natural resources and critical raw materials. More products would be added.

          * The situation for wine and spirits - a point of friction on both sides of the Atlantic - is still to be established.

          * Tariffs on European steel and aluminium will stay at 50%, but European Commission President Ursula von der Leyen said these would later be cut and replaced by a quota system.

          * The EU pledged to make $750 billion in strategic purchases, covering oil, gas, nuclear, fuel and chips during U.S. President Donald Trump's term in office.

          * The EU pledged to buy U.S. military equipment.

          * European companies are to invest $600 billion in the U.S. over the course of Trump's second term. Unlike Japan’s package - which Tokyo says will consist of equity, loans and guarantees from state-run agencies of up to $550 billion to be invested at Trump's discretion - EU officials said the Europe's $600 billion investment pledge is based on private sector projects already in the pipeline.

          Source: Reuters

          To stay updated on all economic events of today, please check out our Economic calendar
          Risk Warnings and Disclaimers
          You understand and acknowledge that there is a high degree of risk involved in trading. Following any strategies or investment methods may lead to potential losses. The content on the site is provided by our contributors and analysts for information purposes only. You are solely responsible for determining whether any trading assets, securities, strategy, or any other product is suitable for investing based on your own investment objectives and financial situation.
          Add to Favorites
          Share

          EU And US Reach A Deal, Euro Slips

          Blue River

          Technical Analysis

          The euro is busy on Monday morning. EUR/USD started the week in positive territory and rose as much as 0.30%, but has reversed directions in the European session and is trading at 1.1677, down 0.54% on the day.

          EU and the US reach a trade deal

          US President Trump can add another feather to his MAGA cap, with news that the European Union and the United States reached a trade agreement over the weekend. President Trump had threatened to hit the EU with 30% tariffs if a deal wasn’t reached by Aug. 1 and the specter of a nasty trade war between the largest two economies in the world has been averted.

          A deal is of course good news but it’s important to keep in mind that the sides have agreed to a framework agreement, which is thin on details. Some contentious issues remain, such as the US tariff of 50% on steel and aluminum.

          The deal mirrors the US-Japan agreement which was announced last week. The US will eliminate some tariffs, such as on aircraft parts and generic drugs, but most European products will face a tariff of 15%, which will make European imports more expensive for US consumers. The EU has also agreed to increase investment in the US by $600 billion and purchase $750 billion in US energy products.

          The German auto industry is one of the deal’s big winners, as the 15% tariff will be easier to swallow than the current rate of 27.5%. The US-Japan deal puts a 15% tariff on Japanese motor vehicles, which would have put European automakers at a major disadvantage without a EU-US deal.

          Trump is moving ahead and reaching deals with major trade partners, which is removing uncertainty and raising risk appetite. Investors are hoping that other key nations, such as Canada and South Korea, will follow soon with trade agreements with the US.

          EUR/USD Technical

          • EUR/USD has pushed below support at 1.1735 and 1.1710 and is testing 1.1677. Below, there is support at 1.1652
          • There is resistance at 1.1768 and 1.1793

          EURUSD 1-Day Chart, July 28, 2025

          Source: ACTIONFOREX

          Risk Warnings and Disclaimers
          You understand and acknowledge that there is a high degree of risk involved in trading. Following any strategies or investment methods may lead to potential losses. The content on the site is provided by our contributors and analysts for information purposes only. You are solely responsible for determining whether any trading assets, securities, strategy, or any other product is suitable for investing based on your own investment objectives and financial situation.
          Add to Favorites
          Share
          FastBull
          Copyright © 2025 FastBull Ltd

          728 RM B 7/F GEE LOK IND BLDG NO 34 HUNG TO RD KWUN TONG KLN HONG KONG

          TelegramInstagramTwitterfacebooklinkedin
          App Store Google Play Google Play
          Products
          Charts

          Chats

          Q&A with Experts
          Screeners
          Economic Calendar
          Data
          Tools
          Membership
          Features
          Function
          Markets
          Copy Trading
          Latest Signals
          Contests
          News
          Analysis
          24/7
          Columns
          Education
          Company
          Careers
          About Us
          Contact Us
          Advertising
          Help Center
          Feedback
          User Agreement
          Privacy Policy
          Business

          White Label

          Data API

          Web Plug-ins

          Poster Maker

          Affiliate Program

          Risk Disclosure

          The risk of loss in trading financial instruments such as stocks, FX, commodities, futures, bonds, ETFs and crypto can be substantial. You may sustain a total loss of the funds that you deposit with your broker. Therefore, you should carefully consider whether such trading is suitable for you in light of your circumstances and financial resources.

          No decision to invest should be made without thoroughly conducting due diligence by yourself or consulting with your financial advisors. Our web content might not suit you since we don't know your financial conditions and investment needs. Our financial information might have latency or contain inaccuracy, so you should be fully responsible for any of your trading and investment decisions. The company will not be responsible for your capital loss.

          Without getting permission from the website, you are not allowed to copy the website's graphics, texts, or trademarks. Intellectual property rights in the content or data incorporated into this website belong to its providers and exchange merchants.

          Not Logged In

          Log in to access more features

          FastBull Membership

          Not yet

          Purchase

          Become a signal provider
          Help Center
          Customer Service
          Dark Mode
          Price Up/Down Colors

          Log In

          Sign Up

          Position
          Layout
          Fullscreen
          Default to Chart
          The chart page opens by default when you visit fastbull.com