


Markets
News
Analysis
User
24/7
Economic Calendar
Education
Data
- Names
- Latest
- Prev


There is a positive indication of Ethereum, as technical and derivatives data indicate that it might break past levels in excess of 4000 dollars.
There is a positive indication of Ethereum, as technical and derivatives data indicate that it might break past levels in excess of 4000 dollars. The price action aligns with wave theory and increasing open interest, signaling market strength. ETH is trading near $3,681, and a push toward $4,500 is becoming a key focus.
The structure of the price movement of Ethereum shows that a full corrective Wave 4 is completed, and Wave 5 might be underway on the 3-day chart. Analysts point out that ETH pulled back at the 50 percent Fibonacci retracement as the past support is visible. A zone of Fibonacci between 0.618 and 0.65 served as a bouncing zone, resisting the downward trend.
Elliott Wave labeling shows sub-waves forming, which supports an extended upward move if ETH maintains current levels. The chart reflects earlier waves with strong impulses, indicating that price continuation is likely. If ETH surpasses $4,000, the wave structure suggests $4,500 is a logical target.ETHUSD now trades under heavy observation, as it must break the $4,000 resistance to validate the fifth wave projection. Previous peaks align with strong rejection zones, but volume and trend structure show readiness for a breakout. Traders are watching for a firm candle close above $4,000.
ETH futures open interest has steadily increased since June, aligning with price gains across spot and derivative markets. Data from Coinglass confirms a surge in open interest, which reached multi-year highs as ETH neared $4,500. This pattern reflects strong market participation and capital inflows.
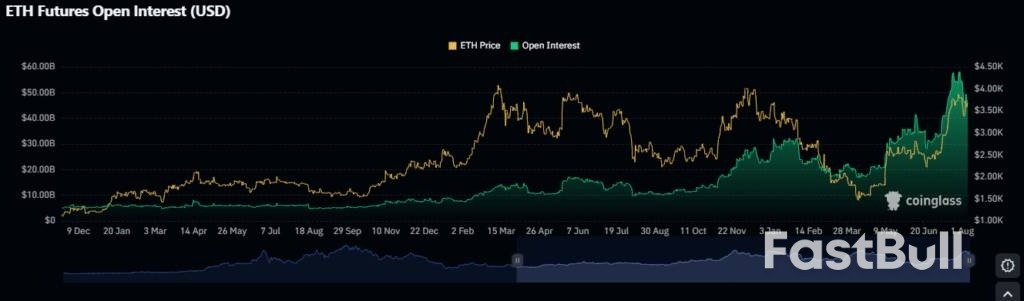
Open interest rising with price usually indicates new capital rather than profit-taking, suggesting stronger positioning. The current trend supports the wave structure analysis and confirms bullish behavior. If open interest continues climbing, Ethereum may extend gains without deep retracements.Unlike past cycles, this rise shows sustained demand and leveraged exposure without major sell-offs. Earlier phases saw drops after peaks, but this rally has broader participation. ETH may soon test the $4,500 level if support zones hold and sentiment remains aligned.
On the weekly chart, Ethereum faced four rejections at the $3,950–$4,000 zone but has continued forming higher lows. Price remains inside a tight consolidation range, but the longer it holds, the higher the breakout probability. ETH’s price action shows pressure building just under resistance.
Repeated failures to break $4,000 usually indicate exhaustion, but not in this case. Market structure holds, and the reaction to pullbacks is quick and shallow. This behavior supports the view that ETH will make another attempt soon.Support levels below include $3,200 and $2,400, but these remain untouched in the latest rally. The higher lows suggest strength despite resistance. ETH is close to unlocking the next move, and the target remains $4,500.
728 RM B 7/F GEE LOK IND BLDG NO 34 HUNG TO RD KWUN TONG KLN HONG KONG


The risk of loss in trading financial instruments such as stocks, FX, commodities, futures, bonds, ETFs and crypto can be substantial. You may sustain a total loss of the funds that you deposit with your broker. Therefore, you should carefully consider whether such trading is suitable for you in light of your circumstances and financial resources.
No decision to invest should be made without thoroughly conducting due diligence by yourself or consulting with your financial advisors. Our web content might not suit you since we don't know your financial conditions and investment needs. Our financial information might have latency or contain inaccuracy, so you should be fully responsible for any of your trading and investment decisions. The company will not be responsible for your capital loss.
Without getting permission from the website, you are not allowed to copy the website's graphics, texts, or trademarks. Intellectual property rights in the content or data incorporated into this website belong to its providers and exchange merchants.
Not Logged In
Log in to access more features

FastBull Membership
Not yet
Purchase


Log In
Sign Up


