Markets
News
Analysis
User
24/7
Economic Calendar
Education
Data
- Names
- Latest
- Prev


Signal Accounts for Members
All Signal Accounts
All Contests


U.K. Trade Balance Non-EU (SA) (Oct)A:--
F: --
P: --
U.K. Trade Balance (Oct)A:--
F: --
P: --
U.K. Services Index MoMA:--
F: --
P: --
U.K. Construction Output MoM (SA) (Oct)A:--
F: --
P: --
U.K. Industrial Output YoY (Oct)A:--
F: --
P: --
U.K. Trade Balance (SA) (Oct)A:--
F: --
P: --
U.K. Trade Balance EU (SA) (Oct)A:--
F: --
P: --
U.K. Manufacturing Output YoY (Oct)A:--
F: --
P: --
U.K. GDP MoM (Oct)A:--
F: --
P: --
U.K. GDP YoY (SA) (Oct)A:--
F: --
P: --
U.K. Industrial Output MoM (Oct)A:--
F: --
P: --
U.K. Construction Output YoY (Oct)A:--
F: --
P: --
France HICP Final MoM (Nov)A:--
F: --
P: --
China, Mainland Outstanding Loans Growth YoY (Nov)A:--
F: --
P: --
China, Mainland M2 Money Supply YoY (Nov)A:--
F: --
P: --
China, Mainland M0 Money Supply YoY (Nov)A:--
F: --
P: --
China, Mainland M1 Money Supply YoY (Nov)A:--
F: --
P: --
India CPI YoY (Nov)A:--
F: --
P: --
India Deposit Gowth YoYA:--
F: --
P: --
Brazil Services Growth YoY (Oct)A:--
F: --
P: --
Mexico Industrial Output YoY (Oct)A:--
F: --
P: --
Russia Trade Balance (Oct)A:--
F: --
P: --
Philadelphia Fed President Henry Paulson delivers a speech
Canada Building Permits MoM (SA) (Oct)A:--
F: --
P: --
Canada Wholesale Sales YoY (Oct)A:--
F: --
P: --
Canada Wholesale Inventory MoM (Oct)A:--
F: --
P: --
Canada Wholesale Inventory YoY (Oct)A:--
F: --
P: --
Canada Wholesale Sales MoM (SA) (Oct)A:--
F: --
P: --
Germany Current Account (Not SA) (Oct)A:--
F: --
P: --
U.S. Weekly Total Rig CountA:--
F: --
P: --
U.S. Weekly Total Oil Rig CountA:--
F: --
P: --
Japan Tankan Large Non-Manufacturing Diffusion Index (Q4)--
F: --
P: --
Japan Tankan Small Manufacturing Outlook Index (Q4)--
F: --
P: --
Japan Tankan Large Non-Manufacturing Outlook Index (Q4)--
F: --
P: --
Japan Tankan Large Manufacturing Outlook Index (Q4)--
F: --
P: --
Japan Tankan Small Manufacturing Diffusion Index (Q4)--
F: --
P: --
Japan Tankan Large Manufacturing Diffusion Index (Q4)--
F: --
P: --
Japan Tankan Large-Enterprise Capital Expenditure YoY (Q4)--
F: --
P: --
U.K. Rightmove House Price Index YoY (Dec)--
F: --
P: --
China, Mainland Industrial Output YoY (YTD) (Nov)--
F: --
P: --
China, Mainland Urban Area Unemployment Rate (Nov)--
F: --
P: --
Saudi Arabia CPI YoY (Nov)--
F: --
P: --
Euro Zone Industrial Output YoY (Oct)--
F: --
P: --
Euro Zone Industrial Output MoM (Oct)--
F: --
P: --
Canada Existing Home Sales MoM (Nov)--
F: --
P: --
Euro Zone Total Reserve Assets (Nov)--
F: --
P: --
U.K. Inflation Rate Expectations--
F: --
P: --
Canada National Economic Confidence Index--
F: --
P: --
Canada New Housing Starts (Nov)--
F: --
P: --
U.S. NY Fed Manufacturing Employment Index (Dec)--
F: --
P: --
U.S. NY Fed Manufacturing Index (Dec)--
F: --
P: --
Canada Core CPI YoY (Nov)--
F: --
P: --
Canada Manufacturing Unfilled Orders MoM (Oct)--
F: --
P: --
Canada Manufacturing New Orders MoM (Oct)--
F: --
P: --
Canada Core CPI MoM (Nov)--
F: --
P: --
Canada Manufacturing Inventory MoM (Oct)--
F: --
P: --
Canada CPI YoY (Nov)--
F: --
P: --
Canada CPI MoM (Nov)--
F: --
P: --
Canada CPI YoY (SA) (Nov)--
F: --
P: --
Canada Core CPI MoM (SA) (Nov)--
F: --
P: --


No matching data
Latest Views
Latest Views
Trending Topics
Top Columnists
Latest Update
White Label
Data API
Web Plug-ins
Affiliate Program
View All

No data
The calm in today’s Asian forex session belies a volatile backdrop forming beneath the surface. Dollar remains pinned near at bottom of the performance board this week, despite a shallow bounce. Investors are keeping their powder dry ahead of several key catalysts: Thursday's non-farm payrolls report, the looming July...
The calm in today’s Asian forex session belies a volatile backdrop forming beneath the surface. Dollar remains pinned near at bottom of the performance board this week, despite a shallow bounce. Investors are keeping their powder dry ahead of several key catalysts: Thursday’s non-farm payrolls report, the looming July 9 tariff truce deadline, and a pivotal House vote on US President Donald Trump’s USD 3.3 trillion tax-and-spending bill. Volatility looks set to rise as these themes come to a head.
So far this week, Swiss Franc is the best-performing major currency, followed by Yen and Euro, suggesting defensive positioning remains intact. Sterling and Loonie trail the field after Dollar, while Aussie and Kiwi sit in middle positions.
The US Senate narrowly passed Trump’s legislation overnight—thanks to a tie-breaking vote from Vice President JD Vance. The measure now faces another battle in the House before July 4, where Republicans hold only a slim majority. Passage would intensify deficit concerns already weighing on Dollar.
Fed Chair Jerome Powell’s remarks at the ECB Forum yesterday were deliberately noncommittal, reiterating that all decisions depend on incoming data. With inflation still running above target and tariff uncertainty unresolved, most FOMC members have signaled reluctance to cut rates in July. Unless labor market weakness becomes more evident, the bar for near-term easing remains high. That puts even more focus on this week’s jobs data as the primary swing factor for Fed policy expectations and Dollar direction.
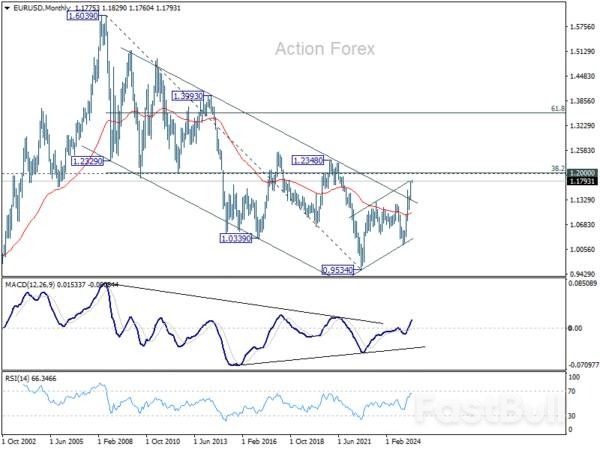
On the European front, ECB officials have taken the unusual step of pinpointing Euro levels. Vice President Luis de Guindos said that EUR/USD levels above 1.20 could become problematic for inflation. Latvian Governor Kazaks flagged the combined impact of tariffs and a stronger exchange rate as a drag on exports. This shift signals a degree of discomfort with Euro’s 9% rise against Dollar since early April.
EUR/USD is currently trading around 1.18, still below the informal ECB red line. For now, the pair still has room to run, but traders may begin to tread more carefully as it approaches the 1.2 zone. Technically, that also coincides with a long term fibonacci level, 38.2% retracement of 1.6039 (2008 high) to 0.9534 (2022 low) at 1.2019. EUR/USD’s reaction to this level is crucial in determining whether it’s just in a medium term corrective pattern from 0.9534. Or it’s actually reversing the down trend that lasted more than a decade and a half.

In Asia, at the time of writing, Nikkei is down -0.33%. Hong Kong HSI is up 0.74%. China Shanghai SSE is up 0.05%. Singapore Strait Times is up 0.46%. Japan 10-year JGB yield is up 0.04 at 1.432. Overnight, DOW rose 0.91%. S&P 500 fell -0.11%. NASDAQ fell -0.82%. 10-year yield rose 0.021 to 4.251.
Looking ahead, Eurozone unemployment rate is the only feature in European session. Later in the day, US ADP employment will offer a prelude to tomorrow’s non-farm payrolls.
Australia’s retail sales rose just 0.2% mom in May, falling short of expectations for a 0.3% rise. The modest increase was largely due to a rebound in clothing purchases, while spending on food fell and household goods remained flat.
Robert Ewing, ABS head of business statistics, noted that aside from the lift in clothing, retail spending was generally “restrained”.
He also noted that this dataset is nearing its conclusion, with July’s release set to be the last edition of Retail Trade. Going forward, the Monthly Household Spending Indicator (MHSI), which leverages administrative data, will replace it as a more comprehensive tool for tracking household consumption trends.
Daily Pivots: (S1) 0.6561; (P) 0.6576; (R1) 0.6597;
Intraday bias in AUD/USD stays on the upside for the moment. Current rise from 0.5913 should target 0.6713 fibonacci level. On the downside, below 0.6507 will turn intraday bias neutral again. But outlook will remain bullish as long as 0.6372 support holds, in case of retreat.

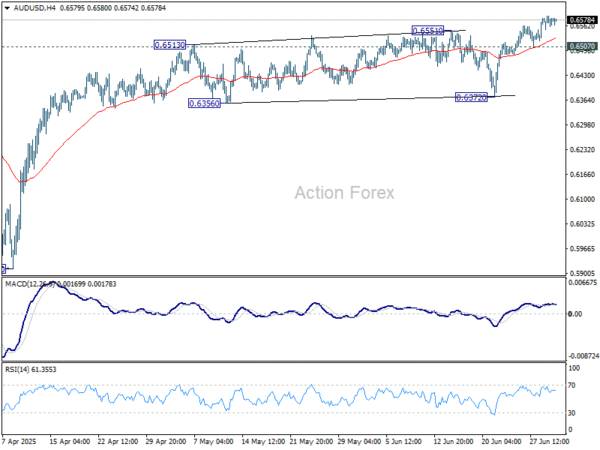
In the bigger picture, there is no clear sign that down trend from 0.8006 (2021 high) has completed. Rebound from 0.5913 is seen as a corrective move. While stronger rally cannot be ruled out, outlook will remain bearish as long as 38.2% retracement of 0.8006 to 0.5913 at 0.6713 holds. Nevertheless, considering bullish convergence condition in W MACD, even in case of another fall through 0.5913, downside should be contained above 0.5506 (2020 low).
Gold prices held steady in Asian trade on Wednesday after sharp gains in the past two sessions, supported by U.S. fiscal deficit concerns as the Senate passed President Donald Trump’s tax-and-spending megabill.
Bullion was also supported by uncertainty over U.S. trade deals ahead of Trump’s July 9 tariff deadline.
Spot Gold was largely unchanged at $3,337.25 an ounce, while Gold Futures for August edged 0.1% lower to $3,347.40/oz by 01:52 ET (05:52 GMT).
Gold has risen more than 2% this week so far, erasing losses from last week when Israel-Iran ceasefire reduced its safe-haven appeal.
Senate Republicans narrowly passed Trump’s sweeping tax-cut and spending bill on Tuesday.
The bill—aimed at cutting taxes, curbing social programs, and increasing military and immigration enforcement funding—is projected to add $3.3 trillion to the national debt.
It will now move to the House of Representatives for potential final approval, with Trump aiming to sign it into law by the July 4 Independence Day holiday.
Meanwhile, Federal Reserve Chair Jerome Powell repeated on Tuesday that the central bank will wait and learn about tariff impacts before cutting rates, defying Trump’s calls for swift, deep cuts.
Investors parsed Powell’s recent comments as slightly dovish as he did not rule out the chances of a rate cut next month.
Markets now await Thursday’s nonfarm payrolls report to gauge the chances of a July rate cut, while a reduction in September is largely priced in.
Expectations of lower interest rates and U.S. fiscal deficit concerns supported gold prices, while uncertainty over U.S. trade deals ahead of the looming July 9 deadline further aided sentiment.
Trump said he had no plans to extend the deadline and would instead notify countries of the tariff rates they will face through formal letters.
He said India may ease curbs on U.S. firms, opening the door to a deal, but added that he was doubtful about a deal with Japan.
The US Dollar Index remained subdued in Asian trading hours, wallowing near its lowest level since February 2022.
Still, metal markets were largely subdued as investors sought clarity on trade deals and sectoral tariffs.
Silver Futures were largely muted at $36.05 per ounce, while Platinum Futures edged up 0.2% to $1,369.05.
Meanwhile, benchmark Copper Futures on the London Metal Exchange rose 0.4% $9,968.65 a ton, while U.S. Copper Futures jumped 1.6% to $5.1165 a pound.
The Loonie is having trouble extending its downswings near a key support zone!
Think it means CAD/JPY is ready to extend a longer-term uptrend?
Let’s take a closer look at the 4-hour time frame!

Japanese yen traders found some support from slightly better-than-expected manufacturing surveys and comments from BOJ Governor Ueda at the ECB Forum, where he noted that underlying inflation remains below the central bank’s 2% target. Still, the yen gave back some of its weekly gains on Tuesday as geopolitical tensions and trade war concerns began to ease.
Over in Canada, a modest rebound in crude oil prices and signs of progress on a potential U.S.-Canada trade deal helped limit the Loonie’s losses, even though it remains one of the less favored major currencies when risk appetite returns.
Remember that directional biases and volatility conditions in market price are typically driven by fundamentals. If you haven’t yet done your homework on the Canadian dollar and the Japanese yen, then it’s time to check out the economic calendar and stay updated on daily fundamental news!
CAD/JPY has been slipping since hitting resistance at 107.00 last week, and is now trading near the 105.00 psychological level.
As you can see, this area lines up with the 100 SMA on the 4-hour chart, the S1(104.67) Pivot Point, and the ascending channel support that has held since May.
If the pair holds above 105.00 and prints bullish candlesticks, it could resume its longer-term uptrend. A move toward the 106.00 Pivot Point or even a retest of the 107.00 highs would be on the table.
But if downside momentum picks up and CAD/JPY breaks below the channel support, the uptrend could be in trouble. In that case, watch for a possible drop toward the 104.00 handle or the S2 Pivot Point near 103.69.
Whichever bias you end up trading, don’t forget to practice proper risk management and stay aware of top-tier catalysts that could influence overall market sentiment.
A seasonal lift for Asian equities in July may be hard to come by this year, as tariff and macroeconomic concerns dampen sentiment.
Markets are bracing for heightened volatility ahead of the July 9 deadline for countries to cut trade deals with the US. Uncertainty over the outcome of these negotiations poses a hurdle for regional shares to maintain an average return of 1.36% for July — the second-best performing month of the year — over the past decade.
Investors are “somewhat holding back on fresh allocations to emerging Asia,” said Christian Nolting, global chief investment officer at Deutsche Bank’s Private Bank. “While recent comments from high-level negotiators suggest constructive progress in ongoing talks with major Asian trading partners,” uncertainties remain high, given that trade disputes during US President Donald Trump’s first term lasted one and a half years, he added.
While the MSCI Asia Pacific Index has gained for three consecutive months through June, a potential return of “Liberation Day” tariff rates could send shares plunging in a similar way they did in early April.

Trump ruled out delaying the July 9 deadline for imposing higher levies on trading partners and renewed threats to hike tariffs on Japan. That saw Japanese shares leading losses in Asia early on Wednesday, with the Nikkei 225 down about 1%.
Even if trade deals materialise, some levels of tariffs are likely to stay. That would be a drag on the region’s export-led economies. A number of central banks in Asia have lowered their growth outlooks for the year. Meanwhile, elevated US interest rates may curb the scope for Asian central banks to further lower borrowing costs.
“The third quarter looks to have lots of dangerous potholes, with higher inflation and the prospect of slower growth,” said Gary Dugan, chief executive officer of the Global CIO Office. “We are not so convinced [that] the US Federal Reserve (Fed) will have sufficient reasons to cut rates at the pace the market prices.”
To be sure, a milder-than-expected tariff outcome and more dovish signalling from the Fed may encourage flows into the region. Current positioning in Asian assets leaves room for upside, said Gary Tan, a portfolio manager at Allspring Global Investments.
The US central bank has refrained from cutting interest rates this year, as it assesses the impact of Trump’s tariffs on inflation. The Trump administration though, has been applying pressure to lower borrowing costs, and two Fed governors in recent days have said a cut could be appropriate as soon as July.
The MSCI Asia Pacific gauge has risen 12% so far this year, outperforming the US, with shares in South Korea and Hong Kong seeing renewed interest. Still, some markets in Southeast Asia, where countries were hit with among the highest tariff rates, remain under pressure.
“We continue to expect choppy markets over the summer,” Nomura Holdings Inc strategists, including Chetan Seth, wrote in a recent note. “We recommend [that] investors focus on stock selection and on idiosyncratic themes that provide insulation from policy uncertainty and ones that offer better visibility.”
White Label
Data API
Web Plug-ins
Poster Maker
Affiliate Program
The risk of loss in trading financial instruments such as stocks, FX, commodities, futures, bonds, ETFs and crypto can be substantial. You may sustain a total loss of the funds that you deposit with your broker. Therefore, you should carefully consider whether such trading is suitable for you in light of your circumstances and financial resources.
No decision to invest should be made without thoroughly conducting due diligence by yourself or consulting with your financial advisors. Our web content might not suit you since we don't know your financial conditions and investment needs. Our financial information might have latency or contain inaccuracy, so you should be fully responsible for any of your trading and investment decisions. The company will not be responsible for your capital loss.
Without getting permission from the website, you are not allowed to copy the website's graphics, texts, or trademarks. Intellectual property rights in the content or data incorporated into this website belong to its providers and exchange merchants.
Not Logged In
Log in to access more features

FastBull Membership
Not yet
Purchase
Log In
Sign Up