• Trade
  • Markets
  • Copy
  • Contests
  • News
  • 24/7
  • Calendar
  • Q&A
  • Chats
Trending
Screeners
SYMBOL
LAST
BID
ASK
HIGH
LOW
NET CHG.
%CHG.
SPREAD
SPX
S&P 500 Index
6836.20
6836.20
6836.20
6861.30
6834.81
+8.79
+ 0.13%
--
DJI
Dow Jones Industrial Average
48491.37
48491.37
48491.37
48679.14
48476.78
+33.33
+ 0.07%
--
IXIC
NASDAQ Composite Index
23194.16
23194.16
23194.16
23345.56
23186.20
-1.00
0.00%
--
USDX
US Dollar Index
97.800
97.880
97.800
98.070
97.790
-0.150
-0.15%
--
EURUSD
Euro / US Dollar
1.17595
1.17602
1.17595
1.17597
1.17262
+0.00201
+ 0.17%
--
GBPUSD
Pound Sterling / US Dollar
1.33953
1.33961
1.33953
1.34014
1.33546
+0.00246
+ 0.18%
--
XAUUSD
Gold / US Dollar
4319.21
4319.55
4319.21
4350.16
4294.68
+19.82
+ 0.46%
--
WTI
Light Sweet Crude Oil
56.719
56.749
56.719
57.601
56.666
-0.514
-0.90%
--

Community Accounts

Signal Accounts
--
Profit Accounts
--
Loss Accounts
--
View More

Become a signal provider

Sell trading signals to earn additional income

View More

Guide to Copy Trading

Get started with ease and confidence

View More

Signal Accounts for Members

All Signal Accounts

Best Return
  • Best Return
  • Best P/L
  • Best MDD
Past 1W
  • Past 1W
  • Past 1M
  • Past 1Y

All Contests

  • All
  • Trump Updates
  • Recommend
  • Stocks
  • Cryptocurrencies
  • Central Banks
  • Featured News
Top News Only
Share

S&P 500 Financial Sector Trading At All-Time Highs, Last Up 0.4%

Share

Poland Had Equivalent Of EUR 4.87 Billion On Its Forex Accounts At End Of November

Share

Ukraine's Military Says It Hit Russian Gas Processing Plant In Astrakhan

Share

Ukraine's Top Negotiator: Talks With USA Have Been Constructive And Productive

Share

The Nasdaq Golden Dragon China Index Fell 0.9% In Early Trading

Share

The S&P 500 Opened 32.78 Points Higher, Or 0.48%, At 6860.19; The Dow Jones Industrial Average Opened 136.31 Points Higher, Or 0.28%, At 48594.36; And The Nasdaq Composite Opened 134.87 Points Higher, Or 0.58%, At 23330.04

Share

Miran: Goods Inflation Could Be Settling In At A Higher Level Than Was Normal Before The Pandemic, But That Will Be More Than Offset By Housing Disinflation

Share

Miran, Who Dissented In Favor Of A Larger Cut At Last Fed Meeting, Repeats Keeping Policy Too Tight Will Lead To Job Losses

Share

Miran: Does Not Think Higher Goods Inflation Is Mostly From Tariffs, But Acknowledges Does Not Have A Full Explanation For It

Share

Toronto Stock Index .GSPTSE Rises 67.16 Points, Or 0.21 Percent, To 31594.55 At Open

Share

Miran: Excluding Housing And Non-Market Based Items, Core Pce Inflation May Be Below 2.3%, “Within Noise” Of The Fed's 2% Target

Share

Polish State Assets Minister Balczun Says Jsw Needs Over USD 830 Million Financing To Keep Liquidity For A Year

Share

Miran: Prices Are “Once Again Stable” And Monetary Policy Should Reflect That

Share

Fed's Miran: Current Excess Inflation Is Not Reflective Of Underlying Supply And Demand In The Economy

Share

Portugal Treasury Puts 2026 Net Financing Needs At 13 Billion Euros, Up From 10.8 Billion In 2025

Share

Portugal Treasury Expects 2026 Net Financing Needs At 29.4 Billion Euros, Up From 25.8 Billion In 2025

Share

Bank Of America Says With Indonesia's Smelter Now Ramping Up, It Expects Aluminium Supply Growth To Accelerate To 2.6% Year On Year In 2026

Share

Bank Of America Expects A Deficit In Aluminium Next Year And Sees Prices Pushing Above $3000/T

Share

Fed Data - USA Effective Federal Funds Rate At 3.64 Percent On 12 December On $102 Billion In Trades Versus 3.64 Percent On $99 Billion On 11 December

Share

Brazil's Petrobras Says No Impact Seen On Oil, Petroleum Products Output As Workers Start Planned Strike

TIME
ACT
FCST
PREV
Japan Tankan Large Non-Manufacturing Outlook Index (Q4)

A:--

F: --

P: --

Japan Tankan Large Manufacturing Outlook Index (Q4)

A:--

F: --

P: --

Japan Tankan Small Manufacturing Diffusion Index (Q4)

A:--

F: --

P: --

Japan Tankan Large Manufacturing Diffusion Index (Q4)

A:--

F: --

P: --

Japan Tankan Large-Enterprise Capital Expenditure YoY (Q4)

A:--

F: --

P: --

U.K. Rightmove House Price Index YoY (Dec)

A:--

F: --

P: --

China, Mainland Industrial Output YoY (YTD) (Nov)

A:--

F: --

P: --

China, Mainland Urban Area Unemployment Rate (Nov)

A:--

F: --

P: --

Saudi Arabia CPI YoY (Nov)

A:--

F: --

P: --

Euro Zone Industrial Output YoY (Oct)

A:--

F: --

P: --

Euro Zone Industrial Output MoM (Oct)

A:--

F: --

P: --

Canada Existing Home Sales MoM (Nov)

A:--

F: --

P: --

Canada National Economic Confidence Index

A:--

F: --

P: --

Canada New Housing Starts (Nov)

A:--

F: --

P: --
U.S. NY Fed Manufacturing Employment Index (Dec)

A:--

F: --

P: --

U.S. NY Fed Manufacturing Index (Dec)

A:--

F: --

P: --

Canada Core CPI YoY (Nov)

A:--

F: --

P: --

Canada Manufacturing Unfilled Orders MoM (Oct)

A:--

F: --

P: --

U.S. NY Fed Manufacturing Prices Received Index (Dec)

A:--

F: --

P: --

U.S. NY Fed Manufacturing New Orders Index (Dec)

A:--

F: --

P: --

Canada Manufacturing New Orders MoM (Oct)

A:--

F: --

P: --

Canada Core CPI MoM (Nov)

A:--

F: --

P: --

Canada Trimmed CPI YoY (SA) (Nov)

A:--

F: --

P: --

Canada Manufacturing Inventory MoM (Oct)

A:--

F: --

P: --

Canada CPI YoY (Nov)

A:--

F: --

P: --

Canada CPI MoM (Nov)

A:--

F: --

P: --

Canada CPI YoY (SA) (Nov)

A:--

F: --

P: --

Canada Core CPI MoM (SA) (Nov)

A:--

F: --

P: --

Canada CPI MoM (SA) (Nov)

A:--

F: --

P: --

Federal Reserve Board Governor Milan delivered a speech
U.S. NAHB Housing Market Index (Dec)

--

F: --

P: --

Australia Composite PMI Prelim (Dec)

--

F: --

P: --

Australia Services PMI Prelim (Dec)

--

F: --

P: --

Australia Manufacturing PMI Prelim (Dec)

--

F: --

P: --

Japan Manufacturing PMI Prelim (SA) (Dec)

--

F: --

P: --

U.K. 3-Month ILO Employment Change (Oct)

--

F: --

P: --

U.K. Unemployment Claimant Count (Nov)

--

F: --

P: --

U.K. Unemployment Rate (Nov)

--

F: --

P: --

U.K. 3-Month ILO Unemployment Rate (Oct)

--

F: --

P: --

U.K. Average Weekly Earnings (3-Month Average, Including Bonuses) YoY (Oct)

--

F: --

P: --

U.K. Average Weekly Earnings (3-Month Average, Excluding Bonuses) YoY (Oct)

--

F: --

P: --

France Services PMI Prelim (Dec)

--

F: --

P: --

France Composite PMI Prelim (SA) (Dec)

--

F: --

P: --

France Manufacturing PMI Prelim (Dec)

--

F: --

P: --

Germany Services PMI Prelim (SA) (Dec)

--

F: --

P: --

Germany Manufacturing PMI Prelim (SA) (Dec)

--

F: --

P: --

Germany Composite PMI Prelim (SA) (Dec)

--

F: --

P: --

Euro Zone Composite PMI Prelim (SA) (Dec)

--

F: --

P: --

Euro Zone Services PMI Prelim (SA) (Dec)

--

F: --

P: --

Euro Zone Manufacturing PMI Prelim (SA) (Dec)

--

F: --

P: --

U.K. Services PMI Prelim (Dec)

--

F: --

P: --

U.K. Manufacturing PMI Prelim (Dec)

--

F: --

P: --

U.K. Composite PMI Prelim (Dec)

--

F: --

P: --

Euro Zone ZEW Economic Sentiment Index (Dec)

--

F: --

P: --

Germany ZEW Current Conditions Index (Dec)

--

F: --

P: --

Germany ZEW Economic Sentiment Index (Dec)

--

F: --

P: --

Euro Zone Trade Balance (Not SA) (Oct)

--

F: --

P: --

Euro Zone ZEW Current Conditions Index (Dec)

--

F: --

P: --

Euro Zone Trade Balance (SA) (Oct)

--

F: --

P: --

U.S. Retail Sales MoM (Excl. Automobile) (SA) (Oct)

--

F: --

P: --

Q&A with Experts
    • All
    • Chatrooms
    • Groups
    • Friends
    Connecting
    .
    .
    .
    Type here...
    Add Symbol or Code

      No matching data

      All
      Trump Updates
      Recommend
      Stocks
      Cryptocurrencies
      Central Banks
      Featured News
      • All
      • Russia-Ukraine Conflict
      • Middle East Flashpoint
      • All
      • Russia-Ukraine Conflict
      • Middle East Flashpoint
      Search
      Products

      Charts Free Forever

      Chats Q&A with Experts
      Screeners Economic Calendar Data Tools
      Membership Features
      Data Warehouse Market Trends Institutional Data Policy Rates Macro

      Market Trends

      Market Sentiment Order Book Forex Correlations

      Top Indicators

      Charts Free Forever
      Markets

      News

      News Analysis 24/7 Columns Education
      From Institutions From Analysts
      Topics Columnists

      Latest Views

      Latest Views

      Trending Topics

      Top Columnists

      Latest Update

      Signals

      Copy Rankings Latest Signals Become a signal provider AI Rating
      Contests
      Brokers

      Overview Brokers Assessment Rankings Regulators News Claims
      Broker listing Forex Brokers Comparison Tool Live Spread Comparison Scam
      Q&A Complaint Scam Alert Videos Tips to Detect Scam
      More

      Business
      Events
      Careers About Us Advertising Help Center

      White Label

      Data API

      Web Plug-ins

      Affiliate Program

      Awards Institution Evaluation IB Seminar Salon Event Exhibition
      Vietnam Thailand Singapore Dubai
      Fans Party Investment Sharing Session
      FastBull Summit BrokersView Expo
      Recent Searches
        Top Searches
          Markets
          News
          Analysis
          User
          24/7
          Economic Calendar
          Education
          Data
          • Names
          • Latest
          • Prev

          View All

          No data

          Scan to Download

          Faster Charts, Chat Faster!

          Download App
          English
          • English
          • Español
          • العربية
          • Bahasa Indonesia
          • Bahasa Melayu
          • Tiếng Việt
          • ภาษาไทย
          • Français
          • Italiano
          • Türkçe
          • Русский язык
          • 简中
          • 繁中
          Open Account
          Search
          Products
          Charts Free Forever
          Markets
          News
          Signals

          Copy Rankings Latest Signals Become a signal provider AI Rating
          Contests
          Brokers

          Overview Brokers Assessment Rankings Regulators News Claims
          Broker listing Forex Brokers Comparison Tool Live Spread Comparison Scam
          Q&A Complaint Scam Alert Videos Tips to Detect Scam
          More

          Business
          Events
          Careers About Us Advertising Help Center

          White Label

          Data API

          Web Plug-ins

          Affiliate Program

          Awards Institution Evaluation IB Seminar Salon Event Exhibition
          Vietnam Thailand Singapore Dubai
          Fans Party Investment Sharing Session
          FastBull Summit BrokersView Expo

          Dollar (DXY) Pauses At 98.00 As Markets Await Clarity – What’s Next?

          Blue River

          Technical Analysis

          Summary:

          The morning NA session follows a quasi-dead European overnight trading.

          The morning NA session follows a quasi-dead European overnight trading.

          This tends to happen when a lack of data adds to the Summer trading when volumes are typically subdued.

          The Dollar Index had been in the middle of many headwinds, as per usual. After a stellar July followed by and N-shaped (for nope) downward spiral in the beginning of August, it has been difficult to spot where the Greenback is heading.

          Forex volatility tends to calm during summers and lack of decisive trends exacerbate this rangebound trading – When the path is unclear, rangebound trading is typical (particularly in currencies.)

          With Markets awaiting more developments after the White House gathered heads from Russia, Ukraine and the EU, the Dollar is forming a temporary bottom around the 98.00 Handle.

          This region had already formed the post-Liberation day bottom (quickly broken in May).

          The White House meetings went well and the US will now attempt to create a Putin-Zelenskyy meeting.

          Donald Trump, the author of the Art of the Deal, is an unpredictable leader but one sure thing, he is a monster negotiator, and this is giving back some confidence in the US.

          In our most recent DXY analysis, we mentioned an expectation of a more balanced Dollar as a lack of continuation upwards and a not-broken bottom show indecision.

          Let’s see if this indecision shall continue, at least to the technical side.

          Dollar Index (DXY) Technical Analysis

          Dollar Index Daily Chart

          Dollar Index Daily Chart, August 19, 2025 – Source: TradingView

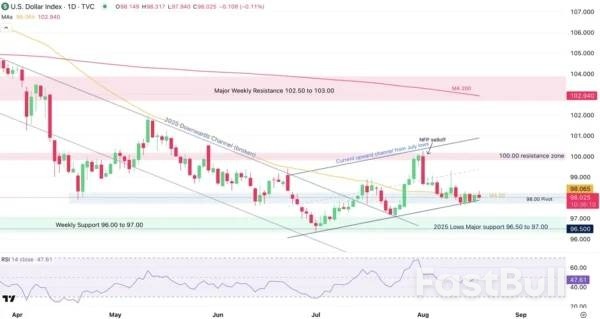
          The US Dollar is holding its low-sloped ascending channel in a 5 day consolidation around the 98.00 handle.

          The post-CPI data had created a new offer for the US Dollar as Markets rushed to price the September cut to 97% before the surprising PPI data changed the course of action.

          With the future US inflation expectations rising considerably, the fundamental background for the Dollar (like its rate outlook) is more uncertain.

          The Daily RSI is way into the Neutral territory and the Daily doji is an indecision one. All of this is also happening right around the 50-Day MA (currently at 98.065).

          Let’s have a closer look to spot what breakout points could be in play when the action picks up again.
          Dollar Index 2H Chart

          Such indecisive price action doesn’t warrant analysis across many timeframes – it is better in this environment to look at where we see the most.

          Dollar Index 2H Chart, August 19, 2025 – Source: TradingView

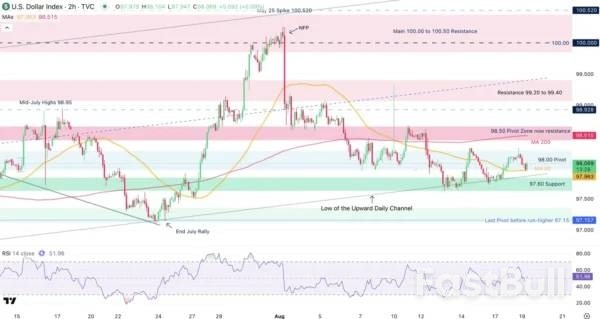
          The Dollar Index is stuck between the 97.60 Support and the 98.50 Resistance Zones.

          With the Price action rebounding from the lows of the Daily upward Channel supplemented by the 2H MA 50 acting as support, it seems that the preferred path would be to the upside.

          If things were so sure however, the Dollar would have risen already to test the following resistance zone.

          Typically, in this environment, it is good to look at the highs (98.30) and lows of the session (97.94) to see where if the action breaks out from there.

          To the upside, look at the 2H MA 200 currently at 98.515.

          To the downside, look at the 97.60 Support Zone, then the 97.15 July upward pivot.

          Levels to place on your DXY Charts:

          Resistance Levels

          • 98.50 Pivot Zone now resistance (confluence with 2H MA 200)
          • Resistance 99.20 to 99.40
          • Main 100.00 to 100.50 Resistance

          Support Levels

          • 2H MA 50 (97.94)
          • 97.60 Support
          • July Pivot before run-higher 97.15

          Safe Trades!

          Source: ACTIONFOREX

          Risk Warnings and Disclaimers
          You understand and acknowledge that there is a high degree of risk involved in trading. Following any strategies or investment methods may lead to potential losses. The content on the site is provided by our contributors and analysts for information purposes only. You are solely responsible for determining whether any trading assets, securities, strategy, or any other product is suitable for investing based on your own investment objectives and financial situation.
          Add to Favorites
          Share

          A suite of retail data is set to decode the resilient consumer

          Adam

          Economic

          Despite the Federal Reserve restricting the economy; a new, protectionist trade regime; and seemingly never-ending uncertainty, the American consumer is still powering through it.
          At several key moments over the past year, as sentiment flagged and talk of a coming slowdown grew louder, spending data acted like a jolt of energy, a slap in the face of pessimistic readings of the economic outlook.
          But viewing the resilience of the American consumer through the lens of a K-shaped economy, observing the sharp divergence between top earners and the rest of the population, helps explain why those things can be happening at the same time.
          This week will deliver more insight into the strength of the consumer via scouting reports from the other side of the cash register.
          Retail giants Home Depot (HD), Lowe's (LOW), Target (TGT), and Walmart (WMT) are reporting earnings and outlooks, helping shed light on the impacts of tariffs and how households are coping with pricing pressures. Areas of growth or stagnation will also hold importance, as the shopping dynamics of putting off purchases, bargain hunting, and trading down can signal how consumers are interpreting and reacting to their own financial standing.
          Even when spending in aggregate increases, drilling down into who and where the boosts are coming from and going to can be revealing. Total credit and debit card spending per household increased nearly 2% in July, compared to a year ago, according to a new report from the Bank of America Institute. But, while that figure looks encouraging, the report noted that a widening gap has opened up between lower-income households and higher-income cohorts and "is the largest since February 2021."
          Results in other sectors have already shown elements of unbothered consumption on the one hand and more cautious spending on the other. Airlines, for instance, showcased a tidy contrast between affluent consumers and everyone else. At Delta (DAL), premium ticket sales rose 5%, while main cabin revenue fell 5% last quarter, underscoring the economic split.
          A paper published last week by the Boston Fed, examining the resilience of consumer spending since 2022, supports the K-shaped framing.
          "Credit card data indicate that since 2022, spending by higher-income consumers has remained resilient and has been driving growth in aggregate spending," the paper found. "By contrast, spending growth of low-income consumers has not been as strong."
          Retailers will tell us more. The engine room of the nation's GDP has been humming along. But it's worth pinpointing where all that resilience is coming from.

          Source: finance.yahoo

          To stay updated on all economic events of today, please check out our Economic calendar
          Risk Warnings and Disclaimers
          You understand and acknowledge that there is a high degree of risk involved in trading. Following any strategies or investment methods may lead to potential losses. The content on the site is provided by our contributors and analysts for information purposes only. You are solely responsible for determining whether any trading assets, securities, strategy, or any other product is suitable for investing based on your own investment objectives and financial situation.
          Add to Favorites
          Share

          Rising Cocoa Prices Spark Strong Return Potential For Growers — Malaysian Cocoa Board

          Winkelmann

          Economic

          Commodity

          Forex

          World cocoa prices are currently on the rise, thus making the crop a commodity with high potential to generate lucrative returns.The Malaysian Cocoa Board (LKM) in a statement on Tuesday said that in 2024, the average price of dry cocoa beans grew by 141% to RM24,274 per tonne compared to RM10,073 per tonne in the previous year.“The Cocoa Cultivation Promotion Programme for the Plantation Sector will be implemented by the board from 2025 to 2030 with an allocation of RM550,000 per year.

          “Via this programme, LKM will distribute high-quality cocoa seedlings for free, provide technical guidance, practical training and continuous monitoring to ensure that cocoa planting is carried out according to the best agricultural practices,” the board said.So far, it said, several Malaysian plantation companies have participated in the programme, with a total area of 360 hectares.Companies selected to participate in the programme would receive incentives in the form of 5,000 high-quality cocoa seedlings worth RM50,000, in addition to technical advisory services including nursery development, planting systems and others, it said.

          “Within five years, the programme aims to expand the cocoa plantation area by 2,750 hectares nationwide.“The plantation sector is an important driver in increasing cocoa production sustainably to meet the demand of local manufacturers, while supporting efforts to make Malaysia a producer of premium cocoa and ‘single origin’ cocoa beans, which are increasingly gaining traction in the world market,” said LKM.Earlier, LKM organised the Cocoa Cultivation Promotion Engagement Programme for the Plantation Sector for the Sarawak Region here on Tuesday.

          Officiated by the Ministry of Plantation and Commodities’s cocoa and pepper industry development division secretary Cheah Chee Fong, the event was attended by 94 participants, consisting of plantation companies, individual entrepreneurs, farmer groups, and representatives of relevant government agencies.It aimed to provide information on the incentives offered to plantation companies to cultivate cocoa crops, as well as the potential of the industry.

          Source: Theedgemarkets

          To stay updated on all economic events of today, please check out our Economic calendar
          Risk Warnings and Disclaimers
          You understand and acknowledge that there is a high degree of risk involved in trading. Following any strategies or investment methods may lead to potential losses. The content on the site is provided by our contributors and analysts for information purposes only. You are solely responsible for determining whether any trading assets, securities, strategy, or any other product is suitable for investing based on your own investment objectives and financial situation.
          Add to Favorites
          Share

          Canada: Inflation Moves Lower in July, Keeping Door Open for Further Rate Relief

          Glendon

          Economic

          Forex

          Headline CPI inflation for July came in at 1.7% year-on-year (y/y), cooling from the 1.9% in June and below expectations for a 1.8% y/y print.

          Gasoline prices falling 0.7% on the month on lower geopolitical tensions and increased OPEC+ output were a drag on the index.

          Shelter price inflation rose for the first time since February 2024, rising 3.0% y/y from 2.9% in June. This was mostly attributed to a greater influence from the natural gas and rent indexes. The contraction in natural gas prices slowed in July, propping up shelter costs while tent inflation increased to 5.1% y/y, from 4.7% in June.

          The Bank of Canada’s (BoC) CPI-trim measure was unchanged for the third month in a row at 3.0% y/y, while the CPI-median index ticked higher to 3.1% y/y. The CPI excluding food and energy ticked down to 2.5% y/y from 2.6% the month prior and the CPI excluding the eight most volatile components and indirect taxes (CPIX) also took a step back to 2.6% y/y (from 2.7% in June). All four of the core measures decelerated on a seasonally adjusted monthly basis in July, with the trim and median registering 0.18% m/m and 0.19% m/m, respectively, while the CPI excluding food and energy and CPIX were effectively flat at 0.06% m/m.

          Key Implications

          Energy prices continue to do the heavy lifting on the top-line measure, but the softer trend in core inflation is what really jumps out from this report. The monthly pattern is suggestive of an economy where prices pressures are increasingly offset by growing economic slack.

          On a go-forward basis this report builds on what we saw last month, slowing momentum in core prices as slack in the economy builds. Between February (when trade tensions really flared) and July the economy has added a total of 27k jobs, and now core inflation appears to be losing steam. All together this looks like the scenario the BoC highlighted as giving rise to the “need for a further reduction in the policy interest rate”. From our lens, we think the BoC will have room to deliver more easing later this year as the economic slack continues to build and offset inflation pressure.

          Source: ACTIONFOREX

          To stay updated on all economic events of today, please check out our Economic calendar
          Risk Warnings and Disclaimers
          You understand and acknowledge that there is a high degree of risk involved in trading. Following any strategies or investment methods may lead to potential losses. The content on the site is provided by our contributors and analysts for information purposes only. You are solely responsible for determining whether any trading assets, securities, strategy, or any other product is suitable for investing based on your own investment objectives and financial situation.
          Add to Favorites
          Share

          Nasdaq 100: Intel Rallies on SoftBank Bet—Forecast Eyes Breakout Above $27.55

          Adam

          Stocks

          SoftBank’s $2B Investment Reignites Interest in Intel Stock

          Intel shares have regained investor attention following a $2 billion equity investment from SoftBank, signaling a renewed vote of confidence in the chipmaker’s turnaround plan. The deal, priced at $23 per share, makes SoftBank Intel’s sixth-largest shareholder and marks a rare public bet by Masayoshi Son on a traditional semiconductor name. Traders are viewing this as a key validation point, especially after Intel’s prolonged underperformance.
          SoftBank’s stake, representing just under 2% of Intel’s shares, is purely financial—there’s no board representation, and no commitments on chip purchases. Yet, the investment suggests a belief that Intel is positioned to play a central role in U.S.-based semiconductor manufacturing. It also comes at a time when Intel is trying to recover from an $18.8 billion loss and sharpen its competitive stance against AMD, Nvidia, and TSMC.

          Federal Backing and Strategic Leadership Add Tailwinds

          Intel’s recovery narrative is gaining momentum not just from SoftBank, but also from potential government support. Reports of Washington considering a 10% equity stake underscore Intel’s strategic importance to national tech infrastructure. Combined with new CEO Lip-Bu Tan—formerly on SoftBank’s board—Intel now appears better positioned to access capital, political support, and key industry relationships.
          This backing is crucial as Intel tries to rebuild its foundry ambitions and claw back lost market share. The company’s dual role as both designer and manufacturer gives it a rare position in the U.S. chip ecosystem, offering traders a long-term angle that extends beyond quarterly earnings noise.

          Technical Setup Signals Bullish Breakout Potential

          Nasdaq 100: Intel Rallies on SoftBank Bet—Forecast Eyes Breakout Above $27.55_1Weekly Intel Corporation

          From a technical standpoint, Intel has established a strong support base on the weekly chart between $17.67 and $27.55. Trading near $24.56, the stock remains above key support levels—the 50-week moving average at $21.80 and the 50% retracement level at $22.61. This setup suggests dips may be limited and well-supported.
          A breakout above the February high at $27.55 could trigger momentum-driven buying. If that level clears, the next resistance zones sit around $33.01 (200-week MA) and $34.48, offering up to 40% upside from current prices. Risk remains tied to tech sector volatility, which could drag Intel lower regardless of its internal progress.

          Market Outlook: Cautiously Bullish with Sector Risk Caveats

          Intel offers a compelling risk-reward profile for traders looking at strategic plays in the semiconductor space. SoftBank’s investment and potential U.S. government backing provide meaningful support for the stock’s recovery narrative. With strong technical footing and identifiable upside targets, Intel looks poised for a push toward $27.55 and beyond.
          However, broader tech weakness remains a key risk. Traders should manage exposure accordingly, recognizing that Intel’s rebound, while promising, may be vulnerable to sector-wide selling pressure.

          Source: fxempire

          Risk Warnings and Disclaimers
          You understand and acknowledge that there is a high degree of risk involved in trading. Following any strategies or investment methods may lead to potential losses. The content on the site is provided by our contributors and analysts for information purposes only. You are solely responsible for determining whether any trading assets, securities, strategy, or any other product is suitable for investing based on your own investment objectives and financial situation.
          Add to Favorites
          Share

          Tariffs Temper Malaysia's Trade Outlook Despite July's Export Rebound

          Michelle

          Forex

          Economic

          While Malaysia's exports saw a stronger-than-expected rebound in July, economists say the country's overall trade outlook remains clouded by the risks of US tariffs and softening global demand.

          Malaysia's exports climbed 6.8% year on year to RM140.45 billion — the highest since September 2022 — reversing two consecutive months of contraction, thanks largely to a 22.5% jump in electrical and electronics (E&E) shipments, according to the Ministry of Investment, Trade and Industry (Miti).

          While the rebound offered short-term relief, RHB Investment Bank said it maintains "a cautious view on the trade outlook, as the impact of tariffs would gradually set in later in the year, likely affecting Malaysia’s trade and manufacturing sectors".

          In a note, the bank added that two factors could support exports in the second half of 2025, namely "clearer guidance on US tariffs on Malaysia and easing US–China trade tensions". It also flagged the potential introduction of sector-specific levies, particularly on semiconductors, as a key downside risk.

          Front-loading lifts shipments

          UOB Global Economics & Markets Research said July's positive surprise was mainly a result of "revived front-loading activities ahead of higher US reciprocal tariffs confirmed on Aug 1 and effective from Aug 8".

          While UOB has maintained its full-year export growth forecast at 3.8%, it cautioned that Malaysia’s trade outlook for the remainder of the year is still subject to downside risks, including the progress of the US-China trade truce, the confirmation of sector-specific tariffs, the effects of higher reciprocal tariffs, and weaker demand.

          Similarly, MBSB Research expects a moderation after July's surge, reflecting a more cautious outlook amid ongoing trade uncertainties. While E&E exports provided a buffer, MBSB warned that "the 19% US tariff on Malaysia’s exports is expected to lead to slower trade in the latter part of the year, with softer demand from key trading partners adding to the downside risks."

          The research house added that "efforts to diversify markets and deepen bilateral ties should cushion the US tariff impact, while resilient domestic consumption will remain a key driver to sustain growth in Malaysia’s economy amid external uncertainties".

          CIMB Treasury and Markets Research, who also noted that the July rebound was partly fuelled by tariff-related front-loading, noted this was especially for E&E shipments through Singapore. "Growth in exports to the US, Hong Kong, and Singapore was partly driven by tariff-related front-loading, while higher imports from mainland China and Taiwan point to stockpiling of intermediate goods," it said.

          According to Miti, July's export rebound was also supported by gains in optical and scientific equipment, processed food, and machinery, equipment and parts. However, petroleum products, palm oil, and liquefied natural gas exports contracted.

          Imports rose 0.6% year-on-year, driven by capital goods, while intermediate and consumption goods saw a decline. This lifted the trade surplus to RM14.98 billion, more than double the previous month.

          Source: Theedgemarkets

          To stay updated on all economic events of today, please check out our Economic calendar
          Risk Warnings and Disclaimers
          You understand and acknowledge that there is a high degree of risk involved in trading. Following any strategies or investment methods may lead to potential losses. The content on the site is provided by our contributors and analysts for information purposes only. You are solely responsible for determining whether any trading assets, securities, strategy, or any other product is suitable for investing based on your own investment objectives and financial situation.
          Add to Favorites
          Share

          European defense stocks slide as Trump-Zelenskyy meeting raises hopes of peace for Ukraine

          Adam

          Stocks

          European stocks edged higher on Tuesday as global markets reacted positively to the outcome of talks between U.S. President Donald Trump, Ukrainian President Volodymyr Zelenskyy and European leaders at the White House on Monday.
          The pan-European Stoxx 600 was 0.1% higher by 8:11 a.m. in London (3:11 a.m. ET), with most sectors in positive territory.
          Defense stocks were among the worst performers in the index during early trade, as investors digested the news of talks in Washington. The Stoxx Europe Aerospace and Defense index was last seen trading 2.2% lower.
          German tank parts manufacturer Renk was 6.7% lower, Italian defense giant Leonardo shed 6.6%, Germany’s Hensoldt lost 6% and Sweden’s Saab
          was down 5.5%.
          At the closely watched talks on Monday, Trump said peace negotiations can take place while both countries are still fighting, dropping his earlier calls for a ceasefire. He also said security guarantees for Ukraine would be “provided” by European countries with “coordination with the U.S.”
          Zelenskyy said a package of coveted security guarantees for Ukraine — expected to include a massive purchase of American weapons — would be “formalized on paper within the next week to 10 days.”
          The U.S. president also said a meeting between Russian President Vladimir Putin and Zelenskyy is being planned, to be followed by a trilateral meeting which will include Trump.
          Asia-Pacific markets traded mixed overnight following declines on Wall Street, while U.S. stock futures ticked down early Tuesday ahead of key speeches from Fed officials this week.
          Central bank officials from around the globe will convene in Jackson Hole, Wyoming, for the Fed’s annual economic symposium which begins Thursday. Investors are awaiting clues from Fed Chair Jerome Powell as to what will happen at the central bank’s remaining policy meetings this year.
          The Fed funds futures market is indicating an 83% chance for a quarter-point rate cut at the Fed’s next policy meeting in September, according to CME’s FedWatch tool.
          There are no major earnings or data releases in Europe on Tuesday.

          Source: cnbc

          Risk Warnings and Disclaimers
          You understand and acknowledge that there is a high degree of risk involved in trading. Following any strategies or investment methods may lead to potential losses. The content on the site is provided by our contributors and analysts for information purposes only. You are solely responsible for determining whether any trading assets, securities, strategy, or any other product is suitable for investing based on your own investment objectives and financial situation.
          Add to Favorites
          Share
          FastBull
          Copyright © 2025 FastBull Ltd

          728 RM B 7/F GEE LOK IND BLDG NO 34 HUNG TO RD KWUN TONG KLN HONG KONG

          TelegramInstagramTwitterfacebooklinkedin
          App Store Google Play Google Play
          Products
          Charts

          Chats

          Q&A with Experts
          Screeners
          Economic Calendar
          Data
          Tools
          Membership
          Features
          Function
          Markets
          Copy Trading
          Latest Signals
          Contests
          News
          Analysis
          24/7
          Columns
          Education
          Company
          Careers
          About Us
          Contact Us
          Advertising
          Help Center
          Feedback
          User Agreement
          Privacy Policy
          Business

          White Label

          Data API

          Web Plug-ins

          Poster Maker

          Affiliate Program

          Risk Disclosure

          The risk of loss in trading financial instruments such as stocks, FX, commodities, futures, bonds, ETFs and crypto can be substantial. You may sustain a total loss of the funds that you deposit with your broker. Therefore, you should carefully consider whether such trading is suitable for you in light of your circumstances and financial resources.

          No decision to invest should be made without thoroughly conducting due diligence by yourself or consulting with your financial advisors. Our web content might not suit you since we don't know your financial conditions and investment needs. Our financial information might have latency or contain inaccuracy, so you should be fully responsible for any of your trading and investment decisions. The company will not be responsible for your capital loss.

          Without getting permission from the website, you are not allowed to copy the website's graphics, texts, or trademarks. Intellectual property rights in the content or data incorporated into this website belong to its providers and exchange merchants.

          Not Logged In

          Log in to access more features

          FastBull Membership

          Not yet

          Purchase

          Become a signal provider
          Help Center
          Customer Service
          Dark Mode
          Price Up/Down Colors

          Log In

          Sign Up

          Position
          Layout
          Fullscreen
          Default to Chart
          The chart page opens by default when you visit fastbull.com