• Trade
  • Markets
  • Copy
  • Contests
  • News
  • 24/7
  • Calendar
  • Q&A
  • Chats
Trending
Screeners
SYMBOL
LAST
BID
ASK
HIGH
LOW
NET CHG.
%CHG.
SPREAD
SPX
S&P 500 Index
6844.56
6844.56
6844.56
6861.30
6844.22
+17.15
+ 0.25%
--
DJI
Dow Jones Industrial Average
48579.54
48579.54
48579.54
48679.14
48557.21
+121.50
+ 0.25%
--
IXIC
NASDAQ Composite Index
23243.96
23243.96
23243.96
23345.56
23243.96
+48.80
+ 0.21%
--
USDX
US Dollar Index
97.830
97.910
97.830
98.070
97.810
-0.120
-0.12%
--
EURUSD
Euro / US Dollar
1.17556
1.17563
1.17556
1.17596
1.17262
+0.00162
+ 0.14%
--
GBPUSD
Pound Sterling / US Dollar
1.33959
1.33967
1.33959
1.33970
1.33546
+0.00252
+ 0.19%
--
XAUUSD
Gold / US Dollar
4330.67
4331.08
4330.67
4350.16
4294.68
+31.28
+ 0.73%
--
WTI
Light Sweet Crude Oil
56.860
56.890
56.860
57.601
56.789
-0.373
-0.65%
--

Community Accounts

Signal Accounts
--
Profit Accounts
--
Loss Accounts
--
View More

Become a signal provider

Sell trading signals to earn additional income

View More

Guide to Copy Trading

Get started with ease and confidence

View More

Signal Accounts for Members

All Signal Accounts

Best Return
  • Best Return
  • Best P/L
  • Best MDD
Past 1W
  • Past 1W
  • Past 1M
  • Past 1Y

All Contests

  • All
  • Trump Updates
  • Recommend
  • Stocks
  • Cryptocurrencies
  • Central Banks
  • Featured News
Top News Only
Share

The Nasdaq Golden Dragon China Index Fell 0.9% In Early Trading

Share

The S&P 500 Opened 32.78 Points Higher, Or 0.48%, At 6860.19; The Dow Jones Industrial Average Opened 136.31 Points Higher, Or 0.28%, At 48594.36; And The Nasdaq Composite Opened 134.87 Points Higher, Or 0.58%, At 23330.04

Share

Miran: Goods Inflation Could Be Settling In At A Higher Level Than Was Normal Before The Pandemic, But That Will Be More Than Offset By Housing Disinflation

Share

Miran, Who Dissented In Favor Of A Larger Cut At Last Fed Meeting, Repeats Keeping Policy Too Tight Will Lead To Job Losses

Share

Miran: Does Not Think Higher Goods Inflation Is Mostly From Tariffs, But Acknowledges Does Not Have A Full Explanation For It

Share

Toronto Stock Index .GSPTSE Rises 67.16 Points, Or 0.21 Percent, To 31594.55 At Open

Share

Miran: Excluding Housing And Non-Market Based Items, Core Pce Inflation May Be Below 2.3%, “Within Noise” Of The Fed's 2% Target

Share

Polish State Assets Minister Balczun Says Jsw Needs Over USD 830 Million Financing To Keep Liquidity For A Year

Share

Miran: Prices Are “Once Again Stable” And Monetary Policy Should Reflect That

Share

Fed's Miran: Current Excess Inflation Is Not Reflective Of Underlying Supply And Demand In The Economy

Share

Portugal Treasury Puts 2026 Net Financing Needs At 13 Billion Euros, Up From 10.8 Billion In 2025

Share

Portugal Treasury Expects 2026 Net Financing Needs At 29.4 Billion Euros, Up From 25.8 Billion In 2025

Share

Bank Of America Says With Indonesia's Smelter Now Ramping Up, It Expects Aluminium Supply Growth To Accelerate To 2.6% Year On Year In 2026

Share

Bank Of America Expects A Deficit In Aluminium Next Year And Sees Prices Pushing Above $3000/T

Share

Fed Data - USA Effective Federal Funds Rate At 3.64 Percent On 12 December On $102 Billion In Trades Versus 3.64 Percent On $99 Billion On 11 December

Share

Brazil's Petrobras Says No Impact Seen On Oil, Petroleum Products Output As Workers Start Planned Strike

Share

Statement: US Travel Group Warns New Proposed Trump Administration Requirements For Foreign Tourists To Provide Social Media Histories Could Mean Millions Of People Opting Not To Visit

Share

Blackrock: Kerry White Will Become Head Of Citi Investment Management At Citi Wealth

Share

Blackrock: Rob Jasminski, Head Of Citi Investment Management, Has Joined With Team

Share

Blackrock: Effective Dec 15, Citi Investment Management Employees Will Join Blackrock

TIME
ACT
FCST
PREV
Japan Tankan Small Manufacturing Outlook Index (Q4)

A:--

F: --

P: --

Japan Tankan Large Non-Manufacturing Outlook Index (Q4)

A:--

F: --

P: --

Japan Tankan Large Manufacturing Outlook Index (Q4)

A:--

F: --

P: --

Japan Tankan Small Manufacturing Diffusion Index (Q4)

A:--

F: --

P: --

Japan Tankan Large Manufacturing Diffusion Index (Q4)

A:--

F: --

P: --

Japan Tankan Large-Enterprise Capital Expenditure YoY (Q4)

A:--

F: --

P: --

U.K. Rightmove House Price Index YoY (Dec)

A:--

F: --

P: --

China, Mainland Industrial Output YoY (YTD) (Nov)

A:--

F: --

P: --

China, Mainland Urban Area Unemployment Rate (Nov)

A:--

F: --

P: --

Saudi Arabia CPI YoY (Nov)

A:--

F: --

P: --

Euro Zone Industrial Output YoY (Oct)

A:--

F: --

P: --

Euro Zone Industrial Output MoM (Oct)

A:--

F: --

P: --

Canada Existing Home Sales MoM (Nov)

A:--

F: --

P: --

Canada National Economic Confidence Index

A:--

F: --

P: --

Canada New Housing Starts (Nov)

A:--

F: --

P: --
U.S. NY Fed Manufacturing Employment Index (Dec)

A:--

F: --

P: --

U.S. NY Fed Manufacturing Index (Dec)

A:--

F: --

P: --

Canada Core CPI YoY (Nov)

A:--

F: --

P: --

Canada Manufacturing Unfilled Orders MoM (Oct)

A:--

F: --

P: --

U.S. NY Fed Manufacturing Prices Received Index (Dec)

A:--

F: --

P: --

U.S. NY Fed Manufacturing New Orders Index (Dec)

A:--

F: --

P: --

Canada Manufacturing New Orders MoM (Oct)

A:--

F: --

P: --

Canada Core CPI MoM (Nov)

A:--

F: --

P: --

Canada Trimmed CPI YoY (SA) (Nov)

A:--

F: --

P: --

Canada Manufacturing Inventory MoM (Oct)

A:--

F: --

P: --

Canada CPI YoY (Nov)

A:--

F: --

P: --

Canada CPI MoM (Nov)

A:--

F: --

P: --

Canada CPI YoY (SA) (Nov)

A:--

F: --

P: --

Canada Core CPI MoM (SA) (Nov)

A:--

F: --

P: --

Canada CPI MoM (SA) (Nov)

A:--

F: --

P: --

Federal Reserve Board Governor Milan delivered a speech
U.S. NAHB Housing Market Index (Dec)

--

F: --

P: --

Australia Composite PMI Prelim (Dec)

--

F: --

P: --

Australia Services PMI Prelim (Dec)

--

F: --

P: --

Australia Manufacturing PMI Prelim (Dec)

--

F: --

P: --

Japan Manufacturing PMI Prelim (SA) (Dec)

--

F: --

P: --

U.K. 3-Month ILO Employment Change (Oct)

--

F: --

P: --

U.K. Unemployment Claimant Count (Nov)

--

F: --

P: --

U.K. Unemployment Rate (Nov)

--

F: --

P: --

U.K. 3-Month ILO Unemployment Rate (Oct)

--

F: --

P: --

U.K. Average Weekly Earnings (3-Month Average, Including Bonuses) YoY (Oct)

--

F: --

P: --

U.K. Average Weekly Earnings (3-Month Average, Excluding Bonuses) YoY (Oct)

--

F: --

P: --

France Services PMI Prelim (Dec)

--

F: --

P: --

France Composite PMI Prelim (SA) (Dec)

--

F: --

P: --

France Manufacturing PMI Prelim (Dec)

--

F: --

P: --

Germany Services PMI Prelim (SA) (Dec)

--

F: --

P: --

Germany Manufacturing PMI Prelim (SA) (Dec)

--

F: --

P: --

Germany Composite PMI Prelim (SA) (Dec)

--

F: --

P: --

Euro Zone Composite PMI Prelim (SA) (Dec)

--

F: --

P: --

Euro Zone Services PMI Prelim (SA) (Dec)

--

F: --

P: --

Euro Zone Manufacturing PMI Prelim (SA) (Dec)

--

F: --

P: --

U.K. Services PMI Prelim (Dec)

--

F: --

P: --

U.K. Manufacturing PMI Prelim (Dec)

--

F: --

P: --

U.K. Composite PMI Prelim (Dec)

--

F: --

P: --

Euro Zone ZEW Economic Sentiment Index (Dec)

--

F: --

P: --

Germany ZEW Current Conditions Index (Dec)

--

F: --

P: --

Germany ZEW Economic Sentiment Index (Dec)

--

F: --

P: --

Euro Zone Trade Balance (Not SA) (Oct)

--

F: --

P: --

Euro Zone ZEW Current Conditions Index (Dec)

--

F: --

P: --

Euro Zone Trade Balance (SA) (Oct)

--

F: --

P: --

U.S. Retail Sales MoM (Excl. Automobile) (SA) (Oct)

--

F: --

P: --

Q&A with Experts
    • All
    • Chatrooms
    • Groups
    • Friends
    Connecting
    .
    .
    .
    Type here...
    Add Symbol or Code

      No matching data

      All
      Trump Updates
      Recommend
      Stocks
      Cryptocurrencies
      Central Banks
      Featured News
      • All
      • Russia-Ukraine Conflict
      • Middle East Flashpoint
      • All
      • Russia-Ukraine Conflict
      • Middle East Flashpoint
      Search
      Products

      Charts Free Forever

      Chats Q&A with Experts
      Screeners Economic Calendar Data Tools
      Membership Features
      Data Warehouse Market Trends Institutional Data Policy Rates Macro

      Market Trends

      Market Sentiment Order Book Forex Correlations

      Top Indicators

      Charts Free Forever
      Markets

      News

      News Analysis 24/7 Columns Education
      From Institutions From Analysts
      Topics Columnists

      Latest Views

      Latest Views

      Trending Topics

      Top Columnists

      Latest Update

      Signals

      Copy Rankings Latest Signals Become a signal provider AI Rating
      Contests
      Brokers

      Overview Brokers Assessment Rankings Regulators News Claims
      Broker listing Forex Brokers Comparison Tool Live Spread Comparison Scam
      Q&A Complaint Scam Alert Videos Tips to Detect Scam
      More

      Business
      Events
      Careers About Us Advertising Help Center

      White Label

      Data API

      Web Plug-ins

      Affiliate Program

      Awards Institution Evaluation IB Seminar Salon Event Exhibition
      Vietnam Thailand Singapore Dubai
      Fans Party Investment Sharing Session
      FastBull Summit BrokersView Expo
      Recent Searches
        Top Searches
          Markets
          News
          Analysis
          User
          24/7
          Economic Calendar
          Education
          Data
          • Names
          • Latest
          • Prev

          View All

          No data

          Scan to Download

          Faster Charts, Chat Faster!

          Download App
          English
          • English
          • Español
          • العربية
          • Bahasa Indonesia
          • Bahasa Melayu
          • Tiếng Việt
          • ภาษาไทย
          • Français
          • Italiano
          • Türkçe
          • Русский язык
          • 简中
          • 繁中
          Open Account
          Search
          Products
          Charts Free Forever
          Markets
          News
          Signals

          Copy Rankings Latest Signals Become a signal provider AI Rating
          Contests
          Brokers

          Overview Brokers Assessment Rankings Regulators News Claims
          Broker listing Forex Brokers Comparison Tool Live Spread Comparison Scam
          Q&A Complaint Scam Alert Videos Tips to Detect Scam
          More

          Business
          Events
          Careers About Us Advertising Help Center

          White Label

          Data API

          Web Plug-ins

          Affiliate Program

          Awards Institution Evaluation IB Seminar Salon Event Exhibition
          Vietnam Thailand Singapore Dubai
          Fans Party Investment Sharing Session
          FastBull Summit BrokersView Expo

          China Mulls Asking Firms Run By Central Government To Buy Homes

          Samantha Luan

          Stocks

          Political

          Economic

          Summary:

          China is preparing to mobilize companies owned by the central government in Beijing to purchase unsold homes from distressed property developers, following the limited success of a previous initiative that relied on local governments, according to people familiar with the matter.

          China is preparing to mobilize companies owned by the central government in Beijing to purchase unsold homes from distressed property developers, following the limited success of a previous initiative that relied on local governments, according to people familiar with the matter.Regulators are planning to ask some of the biggest state-owned enterprises and bad debt managers including China Cinda Asset Management Co. to help clear the housing glut, said the people, asking not to be identified discussing a private matter. The firms will be allowed to tap 300 billion yuan ($41.8 billion) of funding that the central bank earmarked for the program last year, one of the people said.

          The renewed effort, which is still under discussion, could help speed up the clearance of China’s 408 million square meters of excess inventory - larger than the size of Detroit - and ease the financial burden of the troubled developers. Officials are also considering scrapping a price cap for the program, in a bid to accelerate the process and improve the economics of the plan for both developers and state buyers, people familiar said in March.

          The housing ministry and Cinda didn’t immediately respond to requests for comment.

          While the move to enlist bad-debt managers might help improve sentiment, the impact may be limited by the firms’ own stretched finances. The plan comes as China’s property sector hits a new low with the delisting of China Evergrande Group and new-home sales by the 100 largest developers falling more than 20% for two consecutive months.The People’s Bank of China launched a nationwide relending program in May 2024 to help local state-owned companies buy unsold homes, and said a few months later it will ramp up the initiative. There are about 60 million unsold apartments in the country, which will take more than four years to sell without government aid, Bloomberg Economics estimated in May last year.

          However, progress has been slow with less than 6% of the announced loans approved so far, according to a Bloomberg Intelligence report early this month. Acceleration of the program might be unlikely given a mismatch in the locations of unsold homes and demand for affordable housing, the report said.When China’s property sector started falling into distress more than four years ago, Beijing sought help from bad-debt managers. Regulators told firms including Huarong Asset Management Co. and Cinda to participate in the restructuring of weak developers, acquire stalled property projects and buy soured loans.

          Then, in early 2023, the PBOC channeled 80 billion yuan of loans through these bad banks to selected developers at an annual interest rate of 1.75%, while encouraging the bad banks to match that amount with funds from their own reserves, people said at the time.However, few projects have actually been implemented under the policy, and its effect has been lackluster. The four largest bad-debt managers themselves were grappling with souring loans after over-extending during China’s real estate boom.

          China’s efforts to put a floor under the years-long real estate slump have underwhelmed as domestic demand and the job market remain weak.

          Regulators have also yet to offer more drastic stimulus. Chinese President Xi Jinping called for the acceleration of a “new model” for property development at the Central Urban Work Conference last month, promoting a more balanced approach to urban planning and renovation — while falling short of some investors’ expectations for more aggressive measures.The country’s home sales extended their slump in July as declining prices failed to attract buyers. Analysts including those from UBS Group AG have delayed expectations of China’s property recovery to mid-to-late 2026.

          Source: Bloomberg Europe

          To stay updated on all economic events of today, please check out our Economic calendar
          Risk Warnings and Disclaimers
          You understand and acknowledge that there is a high degree of risk involved in trading. Following any strategies or investment methods may lead to potential losses. The content on the site is provided by our contributors and analysts for information purposes only. You are solely responsible for determining whether any trading assets, securities, strategy, or any other product is suitable for investing based on your own investment objectives and financial situation.
          Add to Favorites
          Share

          Vietnam's Recovery Gathers Momentum, but Global Uncertainties Continue to Challenge Macroeconomic Stability

          Gerik

          Economic

          Exports and Consumption Rebound Amid Positive Growth Signals

          Vietnam’s July economic performance reflects a complex but generally encouraging picture. Export growth surged by 16% year-on-year, supporting a continued trade surplus of over $2 billion for the second consecutive month. This surplus is substantially higher than the average of less than $900 million per month recorded in the first five months of 2025. This trade performance has helped stabilize foreign exchange supply, contributing positively to exchange rate management and offering room for future monetary easing.
          Retail sales also recovered, rising 9.2% year-on-year after three consecutive months of decline, marking an improvement from June’s 8.3% growth, though still below the annual target of 11-12%. This rebound signals stronger domestic demand, supported partly by robust tourism activity during the summer months. International arrivals rose by 35.7%, primarily from China and South Korea, reflecting a partial base effect but also a sustained recovery in the services sector.

          Investment Flows Remain Solid Despite External Risks

          Foreign direct investment (FDI) maintained positive momentum, with a 10.3% increase in disbursed capital in July and an accumulated 8% rise over the first seven months. The processing and manufacturing sector alone attracted nearly $1.6 billion. Although newly registered capital declined slightly, the trend indicates continued investor confidence in Vietnam’s industrial capacity and strategic position in global supply chains.
          Public investment also played a critical role in sustaining economic momentum. Disbursements reached approximately 885 trillion VND, nearly 30% higher than the previous year’s pace. This injection has provided crucial fiscal support amid global volatility and further expanded growth potential.

          Structural Weaknesses Persist in Domestic Export Segments

          Despite overall export growth, domestic sector exports have declined for three consecutive months, with electronics and steel products particularly affected. This reflects both a structural reliance on external demand and the vulnerability of value-added manufacturing to global cyclical slowdowns.
          The July Manufacturing Purchasing Managers’ Index (PMI) rose to 52.4, the highest since August 2024, driven by domestic orders. However, export orders continued to contract, illustrating a divergent trend where internal demand compensates for external softness, highlighting a correlation rather than a causal turnaround in global trade flows.

          Inflation Stable but Facing Future Supply-Side Pressures

          Consumer price index (CPI) inflation remained under the government’s 4–4.5% target. However, underlying risks persist. One key concern is the possible resurgence of African swine fever. Although pork prices are temporarily subdued due to early slaughtering, slow restocking may lead to shortages by year-end. Pork, which has significant weight in Vietnam’s CPI basket, could thus trigger renewed inflationary pressure during the high-consumption period at the end of the year.
          This scenario demonstrates a cause-effect risk chain: a disrupted supply of pork leads to price spikes, which then elevate headline inflation and reduce policy flexibility. Policymakers are advised to closely monitor livestock conditions and intervene if needed.

          Global Volatility Complicates Domestic Policy Maneuvers

          Global factors remain central to Vietnam’s policy outlook. According to Trần Ngọc Báu from WiGroup, recent signs of a slowdown in the U.S. economy such as declines in manufacturing and services PMI, as well as a deceleration in job creation have led to increased expectations of Federal Reserve rate cuts.
          However, this is not perceived as a signal of outright weakness but rather a regulatory adjustment to stabilize inflation and ensure balanced GDP growth. A Fed rate cut, if confirmed, would ease global monetary conditions and relieve pressure on emerging market currencies, including the Vietnamese đồng.
          Nonetheless, risks are compounded by U.S. trade policy adjustments. Planned tariff changes especially those targeting transshipped goods could disproportionately affect Vietnamese exports in sectors like textiles and electronics. These sectors are particularly exposed due to their reliance on imported components, and thus would need to comply more strictly with rules of origin to retain preferential access. This represents a direct cause-effect linkage between trade policy changes and Vietnamese exporters’ supply chain strategies.

          Exchange Rate Management Faces a Narrowing Buffer

          On the domestic front, policy direction remains growth-supportive. There is speculation about removing the credit growth ceiling to support GDP expansion toward the 8.3–8.5% target. However, both Nguyễn Hoàng Linh and Trần Ngọc Báu warn that excessive credit expansion, if unmatched by real economic absorption capacity, could trigger inflation and asset bubbles. Thus, any easing must be tempered with prudence.
          Moreover, exchange rate management is becoming increasingly constrained. With an operational buffer estimated at just 1.5–2%, the State Bank of Vietnam must balance three simultaneous objectives: exchange rate stability, inflation control, and growth support. This tri-objective approach is complicated by seasonal pressures toward the end of the year and by narrowing policy space due to global uncertainty.

          Navigating Recovery Amid External Shocks

          Vietnam’s economic trajectory in July points to a firm recovery foundation, bolstered by trade surpluses, investment inflows, and retail momentum. Yet, the road ahead is complex. Global volatility, evolving trade dynamics, and potential supply shocks particularly in food are likely to test the adaptability of Vietnam’s macroeconomic policies.
          For now, authorities must navigate this recovery phase with a balanced approach, ensuring that the gains from internal demand and public investment are not undermined by inflation, external shocks, or premature policy shifts. The emphasis going forward will be on fine-tuning rather than stimulus, with risk management at the center of Vietnam’s economic strategy.
          To stay updated on all economic events of today, please check out our Economic calendar
          Risk Warnings and Disclaimers
          You understand and acknowledge that there is a high degree of risk involved in trading. Following any strategies or investment methods may lead to potential losses. The content on the site is provided by our contributors and analysts for information purposes only. You are solely responsible for determining whether any trading assets, securities, strategy, or any other product is suitable for investing based on your own investment objectives and financial situation.
          Add to Favorites
          Share

          UK Economy Grows By Stronger-than-expected 0.3% In 2Q

          James Whitman

          Economic

          Britain's economy grew by a faster-than-expected 0.3% in the second quarter of 2025 after growth of 0.7% in the first three months of the year, offering a boost to finance minister Rachel Reeves, official figures showed on Thursday.

          Economists polled by Reuters, as well as the Bank of England, had forecast 0.1% growth in gross domestic product for the April-June period.

          Thursday's data from the Office for National Statistics showed British GDP rose by 0.4% in June alone after a 0.1% fall in output in May due to surprisingly strong growth across services, industrial output and construction.

          Output in the second quarter overall was up 1.2% from the same period last year compared to a median forecast from economists for 1.0% growth.

          Sterling rose slightly against the dollar after the data.

          Reeves has been keen to highlight that British economic growth in the first quarter of the year was the fastest in the Group of Seven large advanced economies, but the outlook for the second half of 2025 is more subdued.

          Britain faces headwinds from ongoing global trade uncertainty due to increased US import tariffs as well as a slowdown in hiring at home — partly reflecting higher employment taxes and a big increase in the minimum wage.

          Last month the International Monetary Fund forecast Britain's economy would grow 1.2% this year and 1.4% in 2026 — slightly faster than the euro zone and Japan but slower than the United States and Canada.

          Source: Reuters

          To stay updated on all economic events of today, please check out our Economic calendar
          Risk Warnings and Disclaimers
          You understand and acknowledge that there is a high degree of risk involved in trading. Following any strategies or investment methods may lead to potential losses. The content on the site is provided by our contributors and analysts for information purposes only. You are solely responsible for determining whether any trading assets, securities, strategy, or any other product is suitable for investing based on your own investment objectives and financial situation.
          Add to Favorites
          Share

          Trump Downplays Tariff Inflation, but Wall Street Economists Warn of Rising Consumer Prices

          Gerik

          Economic

          Tariffs Take Center Stage as Economists Forecast Inflation Surge

          President Donald Trump has publicly rejected warnings that his administration’s recent tariffs will trigger inflation, brushing off Goldman Sachs’ analysis and ridiculing its CEO David Solomon. However, leading economists across Wall Street are converging on a different conclusion: the inflationary impact of these tariffs is not only probable, but already unfolding.
          The clash emerged after Goldman Sachs projected that new tariffs imposed in early 2025 especially those introduced in February and April would increase consumer prices significantly by fall. According to David Mericle, the bank’s chief economist, two-thirds of the cost of these tariffs would eventually be passed on to consumers. This estimate builds upon observed price patterns from earlier tariff rounds and suggests a cause-and-effect sequence between policy action and retail price escalation.

          Wall Street Concerns Extend Beyond Goldman

          Goldman Sachs is not alone in its warning. UBS economist Brian Rose stated that the downtrend in core inflation has already been interrupted, pointing to retail price pressures building through the supply chain. Meanwhile, JPMorgan Chase’s chief U.S. economist Michael Feroli anticipates that tariffs could contribute an additional 1% to 1.5% to the inflation rate, part of which he believes has already materialized.
          These views suggest a consensus forming among analysts that the disinflationary momentum observed in 2023 may have reached a turning point. This implies a causal relationship where escalating trade barriers are directly altering the inflation outlook, even as nominal rates remain high and wage pressures moderate.

          Political Pushback and Central Bank Implications

          President Trump’s reaction was not limited to dismissing inflation projections. He also criticized Solomon’s dual role as Goldman CEO and part-time DJ, mocking his qualifications and suggesting he find “a new economist.” Yet Trump’s comments may reflect deeper political calculations, particularly as he considers replacing current Federal Reserve Chair Jerome Powell with one of 11 potential candidates. This list reportedly includes former Fed officials and financial market strategists such as Rick Rieder of BlackRock and David Zervos of Jefferies.
          The stakes are high. If tariff-driven inflation rises faster than expected, it could influence both the Fed's rate path and the president’s relationship with monetary policymakers. Should inflation breach comfort thresholds, the Fed may delay rate cuts or even signal renewed tightening, which would challenge the bullish sentiment currently driving equity markets.

          Markets Remain Upbeat Despite Diverging Risks

          In a striking contradiction to these inflationary concerns, U.S. equity markets remain buoyant. The S&P 500 gained 0.32%, the Dow rose over 463 points, and the Nasdaq Composite hit another record close. The resilience is partly attributed to investor belief that the Federal Reserve will begin cutting rates in September, a view not yet fully tested by consumer price data from the second half of the year.
          Even as stocks rally, the euro has appreciated nearly 3% this month, reflecting expectations that while the Federal Reserve will pivot toward easing, the European Central Bank will maintain its current rate levels. This currency movement illustrates a correlative divergence between central bank outlooks across the Atlantic, influenced partly by differences in perceived inflation risk and fiscal policy direction.

          Historical Context Highlights Uncertainty in Forecasting

          The skepticism surrounding economists’ inflation warnings is not without precedent. In 2023, a widely predicted recession failed to materialize, with the U.S. economy instead expanding by 2.5%. This historical disconnect underscores the challenges of forecasting economic inflection points and the limitations of consensus views. Nonetheless, the alignment of major institutions on tariff-related inflation presents a compelling case for caution.
          While President Trump insists tariffs have not and will not stoke inflation, the weight of economic analysis from Goldman Sachs, UBS, and JPMorgan suggests otherwise. These assessments indicate that higher import costs are beginning to feed into the retail sector and are likely to intensify in the coming months.
          If these projections prove accurate, the economic consequences will extend beyond pricing. They could alter the Federal Reserve’s policy trajectory, test consumer resilience, and inject volatility into financial markets. Trump’s political dismissal of these warnings may play well rhetorically, but the economic fundamentals point toward a measurable and potentially persistent rise in inflation tied directly to his own trade policies.

          Source: CNBC

          To stay updated on all economic events of today, please check out our Economic calendar
          Risk Warnings and Disclaimers
          You understand and acknowledge that there is a high degree of risk involved in trading. Following any strategies or investment methods may lead to potential losses. The content on the site is provided by our contributors and analysts for information purposes only. You are solely responsible for determining whether any trading assets, securities, strategy, or any other product is suitable for investing based on your own investment objectives and financial situation.
          Add to Favorites
          Share

          Voltify Aims to Electrify U.S. Freight Rail with Batteries, Eyeing a $10 Billion Opportunity

          Gerik

          Economic

          A Bold Electrification Vision for Rail Freight

          Voltify, a startup founded in 2023 by Daphna Langer and Alon Kessel, is spearheading a radical transformation of the U.S. freight railroad system by advocating for battery-electric locomotives. Their ambition aligns with global decarbonization goals, particularly as the rail industry faces pressure to reduce emissions by 5% annually through 2030, according to the International Energy Agency. Voltify believes its battery systems, combined with a decentralized grid of solar-powered microgrids, can meet this challenge while delivering financial savings of $94 billion over 20 years, as projected by a 2021 Nature Energy study.
          At the heart of Voltify’s model is the VoltCar: a mobile, sodium-ion battery unit designed to attach to existing diesel freight locomotives. This approach offers a modular and flexible path to electrification without requiring massive investments in overhead catenary systems.
          The economic justification is compelling. U.S. Class 1 freight rail companies, including Union Pacific and CSX, currently spend over $11 billion annually on diesel, with Union Pacific alone spending $2.5 billion in 2024. Voltify’s proposition directly targets this cost base, offering a cleaner and ultimately cheaper alternative, presenting a causal relationship between diesel replacement and cost savings.

          Strategic Focus: Converting Six Rail Giants

          The company’s initial strategy focuses on converting the six largest freight railroad firms, which control most of the U.S.’s 140,000-mile rail freight network. Langer argues that convincing a relatively small number of players could generate widespread systemic impact. However, this effort has met with institutional skepticism rooted in the industry’s deep reliance on uptime and operational consistency.
          This resistance reflects the industry’s justifiable concern that battery power may not yet provide the level of reliability diesel offers. To address these doubts, Voltify invested a year developing a predictive algorithm that estimates energy demands on specific routes and is simultaneously building solar-powered microgrids to ensure continuous power availability.

          Voltify’s Infrastructure Solution: Energy Microgrids

          Voltify’s microgrid plan is essential to its scalability. The company is constructing its first solar-powered site, which is expected to be operational by the end of 2025. The vision is ambitious: a continent-wide network of 1,400 microgrids capable of powering all North American freight routes. This plan reflects a cause-effect approach if reliable charging infrastructure is available, then operator reluctance diminishes.
          Voltify has entered advanced discussions with three of the largest North American rail operators and is preparing a pilot project with a smaller railroad by late 2025. A trial with a Class 1 railroad is scheduled for early 2026 and is expected to transition into full-scale commercial deployment.
          These pilots aim to demonstrate not only technological feasibility but also operational compatibility, especially with respect to turnaround time and reliability key metrics for freight operators with tightly scheduled logistics chains.

          Competition and Technological Landscape

          Voltify is not alone in this space. Wabtec, a legacy player in rail technology, introduced the FLXdrive battery-electric locomotive in 2019, achieving 30% emissions reductions. However, the company acknowledges persistent obstacles related to charging time, battery density, and infrastructure investment. This suggests a correlation between technological maturity and industry adoption: as reliability improves, uptake will follow.
          Siemens Mobility has also entered the battery-electric market with its Charger B+AC locomotives. While initially targeted at passenger transport, these locomotives provide useful proof-of-concept for future freight applications. Siemens’ dual-mode trains (overhead and battery) underscore the transition's dependence on hybrid adaptability and infrastructure readiness.

          Scalability Depends on Infrastructure and Industry Alignment

          The potential for battery-electric rail transport hinges on infrastructure readiness. While Voltify’s algorithmic energy modeling and microgrid strategy attempt to solve this, the full transition depends on broader buy-in and aligned investment from freight operators and energy suppliers. The causal chain is clear: reliable power infrastructure must precede large-scale fleet conversion.
          Moreover, government policy though not yet a pillar of Voltify’s strategy could accelerate deployment. Notably, Voltify avoids dependency on subsidies, distinguishing itself from many climate tech ventures and appealing directly to bottom-line metrics and operational viability.

          Disrupting an $80 Billion Industry from Within

          Voltify’s strategy of retrofitting existing locomotives and deploying a decentralized energy grid reflects a pragmatic and scalable approach to electrifying freight rail. With mounting financial and environmental pressure on rail operators, the company's success will depend on its ability to demonstrate reliability, cost efficiency, and operational compatibility.
          While other players like Wabtec and Siemens are actively developing battery rail technology, Voltify’s end-to-end solution, from mobile battery units to energy microgrids, positions it as a serious disruptor in a traditionally slow-moving industry. If early pilots succeed, the transformation of U.S. freight rail from diesel to battery-electric could accelerate rapidly, with substantial environmental and economic rewards.

          Source: CNBC

          To stay updated on all economic events of today, please check out our Economic calendar
          Risk Warnings and Disclaimers
          You understand and acknowledge that there is a high degree of risk involved in trading. Following any strategies or investment methods may lead to potential losses. The content on the site is provided by our contributors and analysts for information purposes only. You are solely responsible for determining whether any trading assets, securities, strategy, or any other product is suitable for investing based on your own investment objectives and financial situation.
          Add to Favorites
          Share

          Asian Markets Lose Momentum After Rally, Eyes Turn to US Rate Cut Prospects

          Gerik

          Economic

          Stocks

          Markets Cool After Multi-Day Gains Amid Cautious Sentiment

          Asian equities delivered a scattered performance on Thursday, interrupting a string of gains fueled by growing optimism over potential U.S. interest rate cuts. The shift reflected a more cautious investor sentiment, where early enthusiasm began to taper despite favorable cues from Wall Street and rising risk assets such as Bitcoin.
          The uneven session marked a moment of recalibration rather than reversal. Investors responded to a combination of technical resistance levels, profit-taking after record highs, and lingering macroeconomic concerns, particularly around inflation data and monetary policy divergence across regions.

          Profit Taking Weighs on Japan’s Nikkei Despite Record Levels

          The Nikkei 225 in Tokyo declined 1.4% to 42,657.94, reversing some of its recent surge as investors moved to lock in profits. This short-term pullback followed a series of all-time highs, suggesting a correlation between stretched valuations and the strategic repositioning of portfolios. The sell-off was also catalyzed by comments from U.S. Treasury Secretary Scott Bessent, who criticized Japan’s slow pace of monetary tightening. This assessment drove the yen higher and weighed on export-heavy equities.
          The yen's strength against the U.S. dollar, with the exchange rate dropping from 147.39 to 146.55, highlighted how currency appreciation can directly impact exporters by making their goods less competitive abroad. The relationship between yen strength and stock market weakness in Japan is consistent with historical patterns, reinforcing a cause-effect link.

          Diverging Trends Across Asia Reflect Local Risk Appetite

          Performance across other major Asian indices was varied. The Hang Seng in Hong Kong dipped marginally by less than 0.1%, while the Shanghai Composite Index posted a modest gain of 0.2%, indicating investor preference for mainland Chinese equities amid regulatory stability and stimulus expectations.
          South Korea’s Kospi fell 0.3%, and Taiwan’s TAIEX lost 0.4%, suggesting investor caution in export-driven markets sensitive to global trade flows and monetary tightening cycles. Conversely, Australia’s ASX 200 rose 0.5% to 8,871.80, boosted by commodity optimism and firm corporate earnings.
          India’s Sensex edged up by 0.1%, reflecting steady domestic momentum. Stephen Innes of SPI Asset Management likened the regional mood to a “party running out of champagne,” implying that while the bullish momentum persists, enthusiasm is waning without fresh catalysts.

          Wall Street Rallies on Rate Cut Hopes, Boosting Global Risk Appetite

          The subdued tone in Asia contrasted with continued strength on Wall Street. The S&P 500 rose 0.3% to close at 6,466.58, marking another all-time high. The Dow gained 1% to 44,922.27, while the Nasdaq added 0.1% to a record 21,713.14.
          The equity rally in the U.S. reflects a growing belief that the Federal Reserve may begin cutting interest rates in September. This belief is underpinned by easing Treasury yields and sectoral gains in rate-sensitive stocks such as homebuilders. Companies like PulteGroup and Lennar rose 5.4% and 5.2%, respectively, highlighting the direct benefit of lower mortgage costs on housing demand.
          This is a clear example of causal linkage: anticipated rate cuts reduce borrowing costs, which in turn lift asset values and economic activity in sectors most exposed to interest rates.

          Cryptocurrency Surge Signals Broader Risk Appetite

          Bitcoin broke past the $123,000 mark, climbing over 3% and setting a new record, according to CoinDesk. This surge aligns with increased demand for alternative assets in an environment of expected monetary easing. Similarly, cryptocurrency exchange Bullish completed its IPO with an 84% gain, closing at $68 per share, underlining investor appetite for high-risk, high-reward opportunities.
          The strong performance of cryptocurrencies amid softening monetary policy expectations illustrates a correlative relationship where excess liquidity and risk-on sentiment tend to lift speculative assets.

          Inflation Data and Fed Uncertainty Remain Key Market Anchors

          Despite the market’s optimism, the Federal Reserve remains cautious. Fed officials have reiterated the need to assess upcoming inflation data before committing to a rate path. President Donald Trump’s public demands for aggressive rate cuts, coupled with his threats of broader tariffs, add political volatility to the equation. The Fed is balancing these pressures carefully, wary of inflationary risks that may be exacerbated by Trump’s trade stance.
          Thursday's upcoming U.S. wholesale inflation report is expected to show a slight acceleration to 2.4% in July from 2.3% in June. A stronger-than-expected print could delay the Fed’s rate-cutting timeline, introducing short-term volatility in rate-sensitive sectors and currencies.

          Oil Prices Edge Up, Supporting Inflationary Pressure

          Energy markets added to the inflation narrative. U.S. benchmark crude rose 24 cents to $62.89 per barrel, and Brent crude increased 27 cents to $65.90. While the gains were modest, they reflect ongoing geopolitical tensions and supply concerns, which could contribute to higher input costs globally.
          The mixed performance of Asian markets reflects a nuanced investor stance. While hopes for U.S. rate cuts continue to support risk assets, regional divergence in economic fundamentals and policy responses are prompting selective repositioning. With Wall Street leading the charge and Bitcoin breaking new ground, the overall market tone remains constructive. However, persistent inflation concerns and policy uncertainty especially around the Federal Reserve’s next move keep investors on guard, with upcoming U.S. data releases likely to define the near-term direction of both equity and currency markets.

          Source: AP

          To stay updated on all economic events of today, please check out our Economic calendar
          Risk Warnings and Disclaimers
          You understand and acknowledge that there is a high degree of risk involved in trading. Following any strategies or investment methods may lead to potential losses. The content on the site is provided by our contributors and analysts for information purposes only. You are solely responsible for determining whether any trading assets, securities, strategy, or any other product is suitable for investing based on your own investment objectives and financial situation.
          Add to Favorites
          Share

          UK GDP Surprise Puts BoE Rate Cut Timeline in Question; GBP/USD Reverses Earlier Losses

          Glendon

          Economic

          Forex

          UK Economy Returns to Growth: Will the BoE Delay Further Rate Cuts?

          Will June GDP recovery put Bank of England policy easing on ice? Here’s what the data, experts, and markets are saying.

          The UK economy grew 0.4% month-on-month in June, recovering from May’s 0.1% contraction, and above a consensus of 0.1%.

          On a quarterly basis, the economy expanded by 0.3% in Q2, down from 0.7% in Q1. However, annual growth accelerated from 0.7% in Q1 to 1.2% in Q2. Economists had expected quarterly and annual growth of 0.1% and 1%, respectively, in the second quarter.

          According to the Office for National Statistics:

          • Services sector output rose by 0.4% and construction by 1.2% quarter-on-quarter, the largest contributors to overall output growth.
          • Production fell by 0.3% after a 1.3% increase in Q1. However, manufacturing production grew 0.3% after increasing 1.1% in the previous quarter.
          • Household consumption increased 0.1% in Q2 2025, driven by rising spending on miscellaneous goods and services, transport, clothing and footwear, and housing.

          Overall, the data signaled a pickup in economic momentum, with services, private consumption, and manufacturing providing upward momentum.

          Experts Highlight Inflation Risks: Higher Inflation Could Delay Further Easing

          The latest GDP figures may reduce market expectations for the BoE to cut rates in September. Softer wage growth may signal a pullback in consumer spending, dampening demand-driven inflation. Average earnings, including bonuses, rose 4.6% in June, down from 5% in May. However, inflation forecasts could challenge expectations of further policy easing.

          James Smith, Research Director at the Resolution Foundation, remarked:

          “Elsewhere, there was grim news about the cost of living… Let’s start with inflation – that is now expected to peak at 4.0% in September, having previously been expected to peak at 3.7%. Inflation is expected to now be higher across the BoE’s forecast period.”

          The Bank of England reduced interest rates by 25 basis points to 4% on August 7. A 5-4 vote in favor of cutting rates reflected a divided Monetary Policy Committee, likely increasing focus on inflation.

          The next UK CPI report, out on August 20, will likely dictate near-term bets on further BoE rate cuts. Economists forecast the annual inflation rate to rise from 3.6% in June to 4% in July. The BoE may be reluctant to cut rates if inflation climbs higher, pushing back a potential rate cut to November or possibly December.

          ING Economics signaled a November BoE rate cut, stating:

          “We still think the Bank’s concerns about inflation will prove overblown. There’s no reason in and of itself that inflation will become more entrenched, simply because headline CPI is sitting above target. It relies on workers being able to chase higher wages, as they bid to retain purchasing power.”

          However, ING Economics warned:

          “We’re sticking to our call, but were the next couple of inflation reports to surprise to the upside, or if the recent falls in private-sector employment start to ease off, then we’ll be rethinking.”

          GBP/USD Reaction to the Q2 GDP Report

          Before the UK GDP Report, the GBP/USD fell to a low of $1.35639 before climbing to a high of $1.35919.

          However, in response to the report, the GBP/USD briefly tumbled to a low of $1.35685 before rising to a high of $1.35858 amid easing bets on a September BoE rate cut.

          On Friday, August 14, the GBP/USD was up 0.05% to $1.35806.

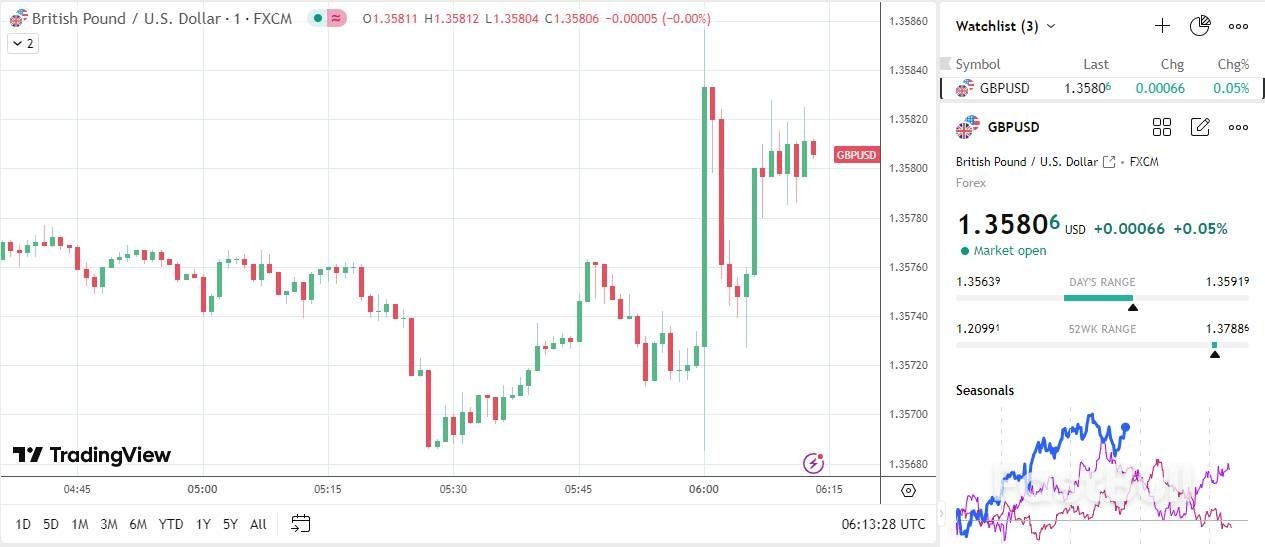
          GBPUSD – 5 Minute Chart – 140825

          Source: FX Empire

          To stay updated on all economic events of today, please check out our Economic calendar
          Risk Warnings and Disclaimers
          You understand and acknowledge that there is a high degree of risk involved in trading. Following any strategies or investment methods may lead to potential losses. The content on the site is provided by our contributors and analysts for information purposes only. You are solely responsible for determining whether any trading assets, securities, strategy, or any other product is suitable for investing based on your own investment objectives and financial situation.
          Add to Favorites
          Share
          FastBull
          Copyright © 2025 FastBull Ltd

          728 RM B 7/F GEE LOK IND BLDG NO 34 HUNG TO RD KWUN TONG KLN HONG KONG

          TelegramInstagramTwitterfacebooklinkedin
          App Store Google Play Google Play
          Products
          Charts

          Chats

          Q&A with Experts
          Screeners
          Economic Calendar
          Data
          Tools
          Membership
          Features
          Function
          Markets
          Copy Trading
          Latest Signals
          Contests
          News
          Analysis
          24/7
          Columns
          Education
          Company
          Careers
          About Us
          Contact Us
          Advertising
          Help Center
          Feedback
          User Agreement
          Privacy Policy
          Business

          White Label

          Data API

          Web Plug-ins

          Poster Maker

          Affiliate Program

          Risk Disclosure

          The risk of loss in trading financial instruments such as stocks, FX, commodities, futures, bonds, ETFs and crypto can be substantial. You may sustain a total loss of the funds that you deposit with your broker. Therefore, you should carefully consider whether such trading is suitable for you in light of your circumstances and financial resources.

          No decision to invest should be made without thoroughly conducting due diligence by yourself or consulting with your financial advisors. Our web content might not suit you since we don't know your financial conditions and investment needs. Our financial information might have latency or contain inaccuracy, so you should be fully responsible for any of your trading and investment decisions. The company will not be responsible for your capital loss.

          Without getting permission from the website, you are not allowed to copy the website's graphics, texts, or trademarks. Intellectual property rights in the content or data incorporated into this website belong to its providers and exchange merchants.

          Not Logged In

          Log in to access more features

          FastBull Membership

          Not yet

          Purchase

          Become a signal provider
          Help Center
          Customer Service
          Dark Mode
          Price Up/Down Colors

          Log In

          Sign Up

          Position
          Layout
          Fullscreen
          Default to Chart
          The chart page opens by default when you visit fastbull.com