


Markets
News
Analysis
User
24/7
Economic Calendar
Education
Data
- Names
- Latest
- Prev


According to a report from Statistics Canada, Canada’s labor market showed unexpected resilience in May, adding 8,800 jobs compared to consensus expectations for a decline of 11,900. The unemployment rate, meanwhile, edged up to 7.0%, in line with projections, as labor force participation remained steady.
According to a report from Statistics Canada, Canada’s labor market showed unexpected resilience in May, adding 8,800 jobs compared to consensus expectations for a decline of 11,900. The unemployment rate, meanwhile, edged up to 7.0%, in line with projections, as labor force participation remained steady.
The employment rate held at 60.8%, reflecting stable engagement in the labor market despite weak job creation in recent months. While May’s headline gain was marginal, it marked an upside surprise following a nearly flat April and comes amid growing concern over labor market slack.
Core-aged women drove the gains, adding 42,000 jobs and lifting their employment rate to 80.1%, partially rebounding from a significant drop in April. However, employment among core-aged men fell 31,000 in the month, pushing their employment rate to its lowest level in nearly seven years, excluding pandemic disruptions.
Sectoral gains were led by wholesale and retail trade (+43,000) and information, culture and recreation (+19,000), while losses in public administration (-32,000) and accommodation and food services (-16,000) capped broader expansion. Private sector hiring rose 61,000, its first monthly gain since January, while self-employment dropped by 30,000, signaling possible shifts in worker preferences or employer demand.
On a regional basis, British Columbia, Nova Scotia, and New Brunswick (NYSE:BC) posted job gains, while Quebec and Manitoba contracted. Ontario remained flat on the month, with some of the country’s highest unemployment rates concentrated in industrial centers like Windsor (10.8%) and Oshawa (9.1%).
Wage growth remained firm, with average hourly earnings rising 3.4% year-over-year to $36.14, mirroring April’s pace. Total hours worked were unchanged month-over-month, though up 0.9% compared to May 2024, pointing to moderate improvements in labor productivity.
While the unemployment rate has now risen for three straight months, May’s increase was modest and anticipated. With 1.6 million Canadians unemployed and rising job search durations, the labor market continues to show signs of loosening, even as headline numbers defy short-term expectations.
728 RM B 7/F GEE LOK IND BLDG NO 34 HUNG TO RD KWUN TONG KLN HONG KONG


The risk of loss in trading financial instruments such as stocks, FX, commodities, futures, bonds, ETFs and crypto can be substantial. You may sustain a total loss of the funds that you deposit with your broker. Therefore, you should carefully consider whether such trading is suitable for you in light of your circumstances and financial resources.
No decision to invest should be made without thoroughly conducting due diligence by yourself or consulting with your financial advisors. Our web content might not suit you since we don't know your financial conditions and investment needs. Our financial information might have latency or contain inaccuracy, so you should be fully responsible for any of your trading and investment decisions. The company will not be responsible for your capital loss.
Without getting permission from the website, you are not allowed to copy the website's graphics, texts, or trademarks. Intellectual property rights in the content or data incorporated into this website belong to its providers and exchange merchants.
Not Logged In
Log in to access more features

FastBull Membership
Not yet
Purchase


Log In
Sign Up


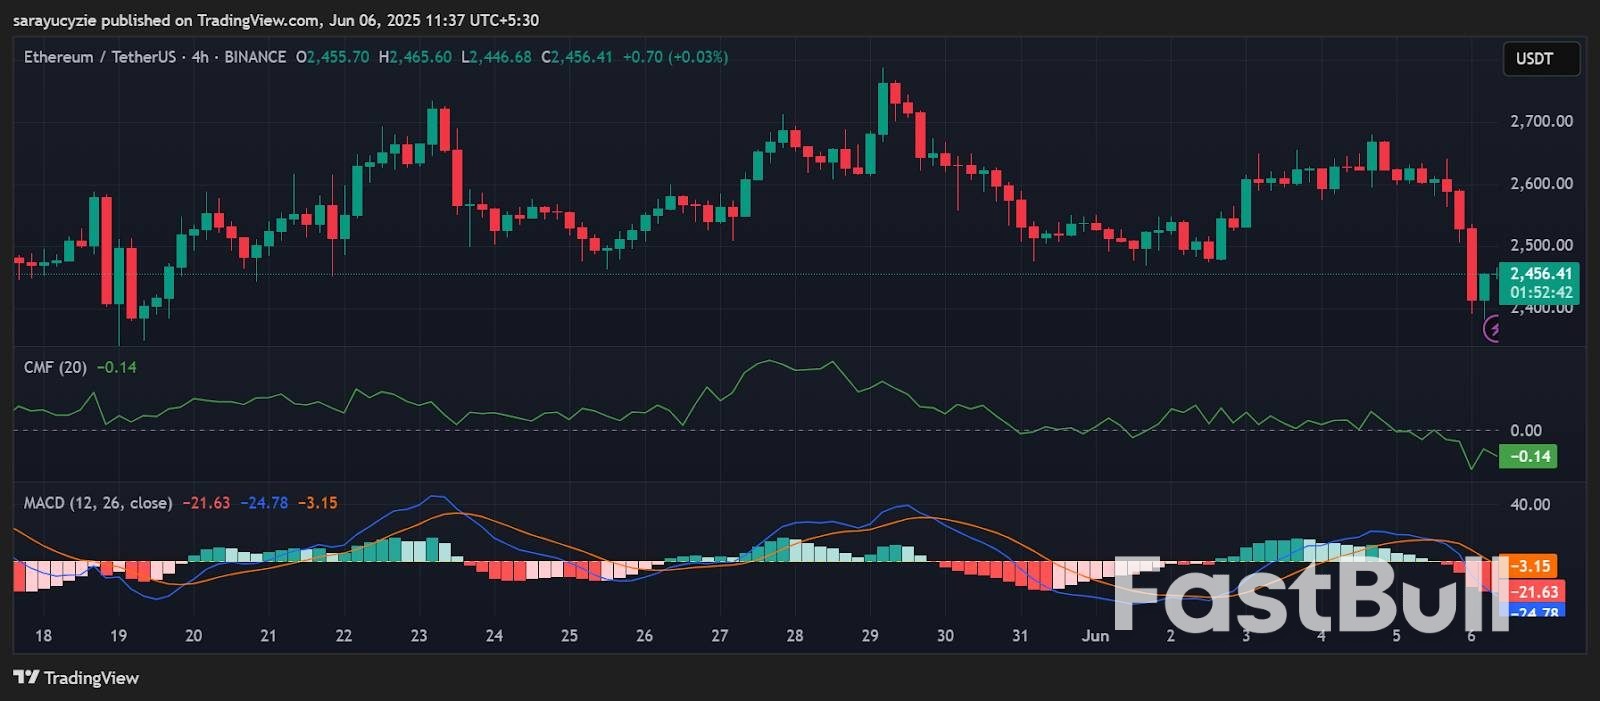 ETH chart (Source: