• Trade
  • Markets
  • Copy
  • Contests
  • News
  • 24/7
  • Calendar
  • Q&A
  • Chats
Trending
Screeners
SYMBOL
LAST
BID
ASK
HIGH
LOW
NET CHG.
%CHG.
SPREAD
SPX
S&P 500 Index
6859.77
6859.77
6859.77
6878.28
6858.25
-10.63
-0.15%
--
DJI
Dow Jones Industrial Average
47803.11
47803.11
47803.11
47971.51
47771.72
-151.87
-0.32%
--
IXIC
NASDAQ Composite Index
23590.33
23590.33
23590.33
23698.93
23579.88
+12.22
+ 0.05%
--
USDX
US Dollar Index
99.090
99.170
99.090
99.090
98.730
+0.140
+ 0.14%
--
EURUSD
Euro / US Dollar
1.16277
1.16284
1.16277
1.16717
1.16270
-0.00149
-0.13%
--
GBPUSD
Pound Sterling / US Dollar
1.33116
1.33127
1.33116
1.33462
1.33114
-0.00196
-0.15%
--
XAUUSD
Gold / US Dollar
4178.86
4179.27
4178.86
4218.85
4175.92
-19.05
-0.45%
--
WTI
Light Sweet Crude Oil
58.987
59.017
58.987
60.084
58.892
-0.822
-1.37%
--

Community Accounts

Signal Accounts
--
Profit Accounts
--
Loss Accounts
--
View More

Become a signal provider

Sell trading signals to earn additional income

View More

Guide to Copy Trading

Get started with ease and confidence

View More

Signal Accounts for Members

All Signal Accounts

Best Return
  • Best Return
  • Best P/L
  • Best MDD
Past 1W
  • Past 1W
  • Past 1M
  • Past 1Y

All Contests

  • All
  • Trump Updates
  • Recommend
  • Stocks
  • Cryptocurrencies
  • Central Banks
  • Featured News
Top News Only
Share

The S&P 500 Opened 4.80 Points Higher, Or 0.07%, At 6875.20; The Dow Jones Industrial Average Opened 16.52 Points Higher, Or 0.03%, At 47971.51; And The Nasdaq Composite Opened 60.09 Points Higher, Or 0.25%, At 23638.22

Share

Reuters Poll - Swiss National Bank Policy Rate To Be 0.00% At End-2026, Said 21 Of 25 Economists, Four Said It Would Be Cut To -0.25%

Share

USGS - Magnitude 7.6 Earthquake Strikes Misawa, Japan

Share

Reuters Poll - Swiss National Bank To Hold Policy Rate At 0.00% On December 11, Said 38 Of 40 Economists, Two Said Cut To -0.25%

Share

Traders Believe There Is A 20% Chance That The European Central Bank Will Raise Interest Rates Before The End Of 2026

Share

Toronto Stock Index .GSPTSE Rises 11.99 Points, Or 0.04 Percent, To 31323.40 At Open

Share

Japan Meteorological Agency: A Tsunami With A Maximum Height Of Three Meters Is Expected Following The Earthquake In Japan

Share

Japan Meteorological Agency: A 7.2-magnitude Earthquake Struck Off The Coast Of Northern Japan, And A Tsunami Warning Has Been Issued

Share

Japan Finance Minister Katayama: G7 Expected To Hold Another Meeting By The End Of This Year

Share

The Japan Meteorological Agency Reported That An Earthquake Occurred In The Sea Near Aomori

Share

Japan Finance Minister Katayama: The G7 Finance Ministers' Meeting Discussed The Critical Mineral Supply Chain And Support For Ukraine

Share

Japan Finance Minister Katayama: Held Onlinemeeting With G7 Finance Ministers

Share

Fed Data - USA Effective Federal Funds Rate At 3.89 Percent On 05 December On $88 Billion In Trades Versus 3.89 Percent On $87 Billion On 04 December

Share

Chinese Foreign Minister Wang Yi: One-China Principle Is An Important Political Foundation For China-Germany Relations, And There Is No Room For Ambiguity

Share

Chinese Foreign Minister Wang Yi: Hopes Germany To Understand, Support China's Position Regarding Japan Prime Minister's Remark On Taiwan

Share

Chinese Foreign Minister Wang Yi: Hopes Germany Will View China More Objectively And Rationally, Adhere To The Positioning Of China-Germany Partnership

Share

China Foreign Ministry: China's Foreign Minister Wang Yi Meets German Counterpart

Share

Israeli Government Spokesperson: Netanyahu Will Meet Trump On December 29

Share

Stc Did Not Ask Internationally-Government To Leave Aden - Senior Stc Official To Reuters

Share

Members Of Internationally-Recognised Government, Opposed To Northern Houthis, Have Left Aden - Senior Stc Official To Reuters

TIME
ACT
FCST
PREV
France Trade Balance (SA) (Oct)

A:--

F: --

P: --
Euro Zone Employment YoY (SA) (Q3)

A:--

F: --

P: --
Canada Part-Time Employment (SA) (Nov)

A:--

F: --

P: --

Canada Unemployment Rate (SA) (Nov)

A:--

F: --

P: --

Canada Full-time Employment (SA) (Nov)

A:--

F: --

P: --

Canada Labor Force Participation Rate (SA) (Nov)

A:--

F: --

P: --

Canada Employment (SA) (Nov)

A:--

F: --

P: --

U.S. PCE Price Index MoM (Sept)

A:--

F: --

P: --

U.S. Personal Income MoM (Sept)

A:--

F: --

P: --

U.S. Core PCE Price Index MoM (Sept)

A:--

F: --

P: --

U.S. PCE Price Index YoY (SA) (Sept)

A:--

F: --

P: --

U.S. Core PCE Price Index YoY (Sept)

A:--

F: --

P: --

U.S. Personal Outlays MoM (SA) (Sept)

A:--

F: --

P: --
U.S. 5-10 Year-Ahead Inflation Expectations (Dec)

A:--

F: --

P: --

U.S. Real Personal Consumption Expenditures MoM (Sept)

A:--

F: --

P: --
U.S. Weekly Total Rig Count

A:--

F: --

P: --

U.S. Weekly Total Oil Rig Count

A:--

F: --

P: --

U.S. Consumer Credit (SA) (Oct)

A:--

F: --

P: --
China, Mainland Foreign Exchange Reserves (Nov)

A:--

F: --

P: --

Japan Trade Balance (Oct)

A:--

F: --

P: --

Japan Nominal GDP Revised QoQ (Q3)

A:--

F: --

P: --

China, Mainland Imports YoY (CNH) (Nov)

A:--

F: --

P: --

China, Mainland Exports (Nov)

A:--

F: --

P: --

China, Mainland Imports (CNH) (Nov)

A:--

F: --

P: --

China, Mainland Trade Balance (CNH) (Nov)

A:--

F: --

P: --

China, Mainland Exports YoY (USD) (Nov)

A:--

F: --

P: --

China, Mainland Imports YoY (USD) (Nov)

A:--

F: --

P: --

Germany Industrial Output MoM (SA) (Oct)

A:--

F: --

P: --
Euro Zone Sentix Investor Confidence Index (Dec)

A:--

F: --

P: --

Canada National Economic Confidence Index

A:--

F: --

P: --

U.K. BRC Like-For-Like Retail Sales YoY (Nov)

--

F: --

P: --

U.K. BRC Overall Retail Sales YoY (Nov)

--

F: --

P: --

Australia Overnight (Borrowing) Key Rate

--

F: --

P: --

RBA Rate Statement
RBA Press Conference
Germany Exports MoM (SA) (Oct)

--

F: --

P: --

U.S. NFIB Small Business Optimism Index (SA) (Nov)

--

F: --

P: --

Mexico 12-Month Inflation (CPI) (Nov)

--

F: --

P: --

Mexico Core CPI YoY (Nov)

--

F: --

P: --

Mexico PPI YoY (Nov)

--

F: --

P: --

U.S. Weekly Redbook Index YoY

--

F: --

P: --

U.S. JOLTS Job Openings (SA) (Oct)

--

F: --

P: --

China, Mainland M1 Money Supply YoY (Nov)

--

F: --

P: --

China, Mainland M0 Money Supply YoY (Nov)

--

F: --

P: --

China, Mainland M2 Money Supply YoY (Nov)

--

F: --

P: --

U.S. EIA Short-Term Crude Production Forecast For The Year (Dec)

--

F: --

P: --

U.S. EIA Natural Gas Production Forecast For The Next Year (Dec)

--

F: --

P: --

U.S. EIA Short-Term Crude Production Forecast For The Next Year (Dec)

--

F: --

P: --

EIA Monthly Short-Term Energy Outlook
U.S. API Weekly Gasoline Stocks

--

F: --

P: --

U.S. API Weekly Cushing Crude Oil Stocks

--

F: --

P: --

U.S. API Weekly Crude Oil Stocks

--

F: --

P: --

U.S. API Weekly Refined Oil Stocks

--

F: --

P: --

South Korea Unemployment Rate (SA) (Nov)

--

F: --

P: --

Japan Reuters Tankan Non-Manufacturers Index (Dec)

--

F: --

P: --

Japan Reuters Tankan Manufacturers Index (Dec)

--

F: --

P: --

Japan Domestic Enterprise Commodity Price Index MoM (Nov)

--

F: --

P: --

Japan Domestic Enterprise Commodity Price Index YoY (Nov)

--

F: --

P: --

China, Mainland PPI YoY (Nov)

--

F: --

P: --

China, Mainland CPI MoM (Nov)

--

F: --

P: --

Q&A with Experts
    • All
    • Chatrooms
    • Groups
    • Friends
    Connecting
    .
    .
    .
    Type here...
    Add Symbol or Code

      No matching data

      All
      Trump Updates
      Recommend
      Stocks
      Cryptocurrencies
      Central Banks
      Featured News
      • All
      • Russia-Ukraine Conflict
      • Middle East Flashpoint
      • All
      • Russia-Ukraine Conflict
      • Middle East Flashpoint
      Search
      Products

      Charts Free Forever

      Chats Q&A with Experts
      Screeners Economic Calendar Data Tools
      Membership Features
      Data Warehouse Market Trends Institutional Data Policy Rates Macro

      Market Trends

      Market Sentiment Order Book Forex Correlations

      Top Indicators

      Charts Free Forever
      Markets

      News

      News Analysis 24/7 Columns Education
      From Institutions From Analysts
      Topics Columnists

      Latest Views

      Latest Views

      Trending Topics

      Top Columnists

      Latest Update

      Signals

      Copy Rankings Latest Signals Become a signal provider AI Rating
      Contests
      Brokers

      Overview Brokers Assessment Rankings Regulators News Claims
      Broker listing Forex Brokers Comparison Tool Live Spread Comparison Scam
      Q&A Complaint Scam Alert Videos Tips to Detect Scam
      More

      Business
      Events
      Careers About Us Advertising Help Center

      White Label

      Data API

      Web Plug-ins

      Affiliate Program

      Awards Institution Evaluation IB Seminar Salon Event Exhibition
      Vietnam Thailand Singapore Dubai
      Fans Party Investment Sharing Session
      FastBull Summit BrokersView Expo
      Recent Searches
        Top Searches
          Markets
          News
          Analysis
          User
          24/7
          Economic Calendar
          Education
          Data
          • Names
          • Latest
          • Prev

          View All

          No data

          Scan to Download

          Faster Charts, Chat Faster!

          Download App
          English
          • English
          • Español
          • العربية
          • Bahasa Indonesia
          • Bahasa Melayu
          • Tiếng Việt
          • ภาษาไทย
          • Français
          • Italiano
          • Türkçe
          • Русский язык
          • 简中
          • 繁中
          Open Account
          Search
          Products
          Charts Free Forever
          Markets
          News
          Signals

          Copy Rankings Latest Signals Become a signal provider AI Rating
          Contests
          Brokers

          Overview Brokers Assessment Rankings Regulators News Claims
          Broker listing Forex Brokers Comparison Tool Live Spread Comparison Scam
          Q&A Complaint Scam Alert Videos Tips to Detect Scam
          More

          Business
          Events
          Careers About Us Advertising Help Center

          White Label

          Data API

          Web Plug-ins

          Affiliate Program

          Awards Institution Evaluation IB Seminar Salon Event Exhibition
          Vietnam Thailand Singapore Dubai
          Fans Party Investment Sharing Session
          FastBull Summit BrokersView Expo

          Bitcoin Cash (BCH) To Continue Rebound? Key Harmonic Pattern Signaling An Upside Move

          Olivia Brooks

          Cryptocurrency

          Technical Analysis

          Summary:

          The cryptocurrency market has seen a much-needed revival in recent weeks. After a brutal Q1 that saw Ethereum (ETH) fall by 45%, the second-largest...

          The cryptocurrency market has seen a much-needed revival in recent weeks. After a brutal Q1 that saw Ethereum (ETH) fall by 45%, the second-largest crypto has now surged over 62% in the past month and is trading near $2,600 — its highest level in months. This renewed bullish sentiment is not just limited to ETH. It’s lifting altcoins across the board, including Bitcoin Cash (BCH).

          BCH has gained over 24% in the last month, cutting its yearly losses to just 8%. While this alone is a sign of strength, technical analysis reveals something even more promising — a developing harmonic pattern that hints at further upside.

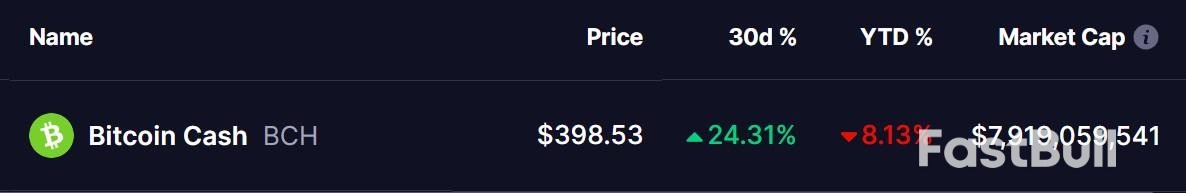
          Source: Coinmarketcap

          Harmonic Pattern Signals More Upside

          The daily chart of BCH shows a Bearish Cypher Pattern in progress. Despite the “bearish” label, the pattern still has room to complete its structure to the upside before any major resistance sets in.

          The pattern began in early December 2024, when BCH failed to hold the $639 level (marked as point X), triggering a sharp sell-off. The token dropped over 60%, bottoming out near $249 (point C) in early April 2025.

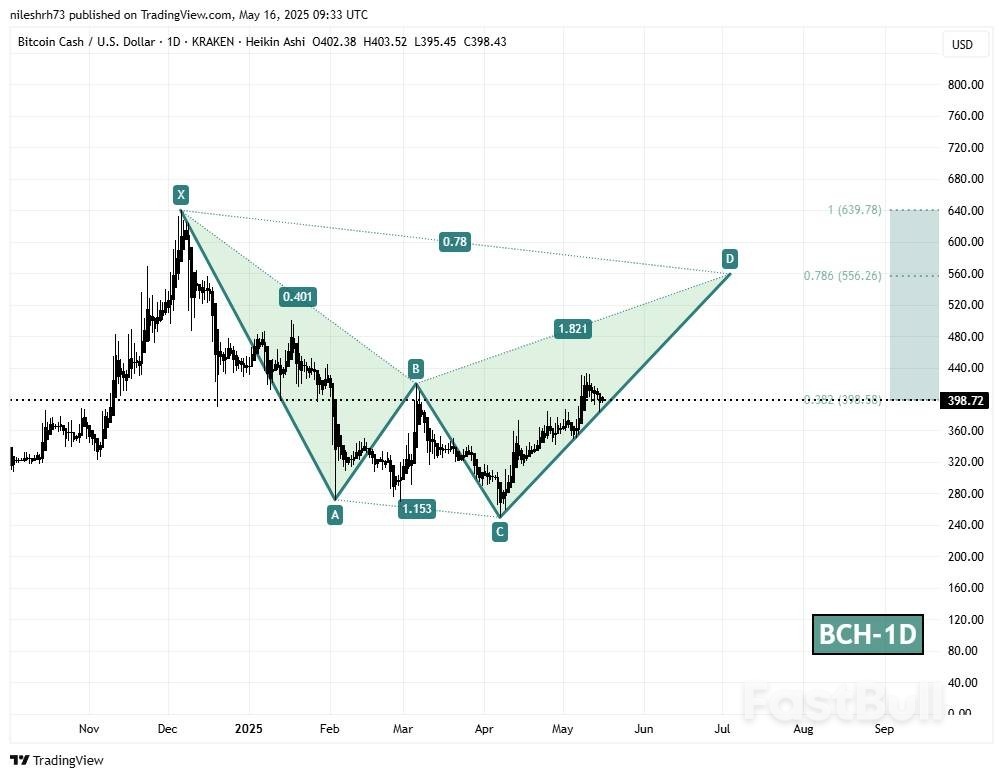
          Bitcoin Cash (BCH) Daily Chart/Coinsprobe (Source: Tradingview)

          Since then, BCH has been staging a steady comeback and is now forming the CD leg of the Cypher. If the pattern continues to play out, BCH could climb toward point D, which is projected near $556 — a key Fibonacci resistance level. From the current price near $398, that suggests a potential 40% rally.

          What’s Next for BCH?

          The area near $556 is a critical zone to watch. This level corresponds to the 78.6% Fibonacci retracement of the initial XA leg — a traditional reversal zone for Cypher patterns. If bulls manage to push BCH through this resistance, a full recovery toward $639 (point X) could be on the cards, offering a 59% upside from current levels.

          However, failure to break this level could trigger some profit-taking or consolidation, typical of harmonic pattern completions.

          Ultimately, whether BCH can maintain this momentum may hinge on broader market strength. Ethereum’s continued rally, for instance, could be a major catalyst for altcoins like BCH.

          Source: CryptoSlate

          Risk Warnings and Disclaimers
          You understand and acknowledge that there is a high degree of risk involved in trading. Following any strategies or investment methods may lead to potential losses. The content on the site is provided by our contributors and analysts for information purposes only. You are solely responsible for determining whether any trading assets, securities, strategy, or any other product is suitable for investing based on your own investment objectives and financial situation.
          Add to Favorites
          Share

          Trump Says US Will Set Tariff Rates for Other Nations in Weeks

          Michelle

          Economic

          Forex

          President Donald Trump said he would set tariff rates for US trading partners “over the next two to three weeks,” saying his administration lacks the capacity to negotiate deals with all of its trading partners.

          Trump said Friday that Treasury Secretary Scott Bessent and Commerce Secretary Howard Lutnick “will be sending letters out essentially telling people” what “they’ll be paying to do business in the United States.”

          “I think we’re going to be very fair. But it’s not possible to meet the number of people that want to see us,” the president said during a meeting with business executives in the United Arab Emirates.

          The US president asserted there are “150 countries that want to make a deal.” He didn’t say how many, or which, nations would receive letters.

          The White House and Commerce Department didn’t immediately respond to requests for comment overnight in the US.

          Trump announced higher tariffs on dozens of trading partners on April 2, but later paused them for 90 days amid investor panic to give foreign governments time to negotiate. Yet the president in recent weeks has moved away from the idea he would engage in a back-and-forth with every partner.

          While the Trump administration is prioritizing trade talks with more than a dozen nations, a lack of manpower and capacity makes it impossible to hold concurrent negotiations with all the countries caught up in the president’s so-called reciprocal tariffs plan.

          Tariffs are charged at the border by US Customs and Border Protection, but the extra costs are often passed on in part or full to US consumers.

          Earlier this month, Trump said he would simply dictate tariff levels for many nations looking to avoid higher duties.

          Negotiations are still ongoing with several economies, including the Japan, South Korea, India and the European Union. Trump recently agreed to a trade framework with the UK and to a mutual temporary tariff reduction with China to buy more time for talks.

          The US president said Thursday that New Delhi made an offer to drop tariffs on US goods, a proposal that the Indian government did not confirm.

          “We have four or five other deals coming immediately,” Trump said on May 9, as he touted his UK blueprint. “We have many deals coming down the line. Ultimately, we’re just signing the rest of them in.”

          Source: Bloomberg Europe

          To stay updated on all economic events of today, please check out our Economic calendar
          Risk Warnings and Disclaimers
          You understand and acknowledge that there is a high degree of risk involved in trading. Following any strategies or investment methods may lead to potential losses. The content on the site is provided by our contributors and analysts for information purposes only. You are solely responsible for determining whether any trading assets, securities, strategy, or any other product is suitable for investing based on your own investment objectives and financial situation.
          Add to Favorites
          Share

          Fed’s Bostic Says He Sees One Rate Cut This Year, No Recession

          Glendon

          Economic

          Forex

          Federal Reserve Bank of Atlanta President Raphael Bostic said he expects the US economy to slow this year but not fall into recession, and reiterated that he sees one interest-rate cut in 2025.

          Bostic said economic growth could come in at 0.5% or 1% this year, as uncertainty and concerns about the outlook weigh on consumers. Fluctuating trade policy has also made businesses more reluctant to make important decisions, Bostic said.

          “I have one cut for the year,” Bostic said during a May 14 interview for Bloomberg’s Odd Lots podcast. “In part, it’s because I think the uncertainty is unlikely to resolve itself quickly.”

          Bostic pointed to the 90-day delays in the implementation of so-called reciprocal tariffs along with the latest US-China trade de-escalation, noting the final results of the negotiations are still unclear. When asked in the podcast, which aired Friday, if the recent trade truce between the US and China had changed his outlook, Bostic replied, “a little.”

          Bostic said last week that he didn’t think it was “prudent” to adjust monetary policy with so little visibility about the path ahead. Fed officials kept interest rates steady at their most recent gathering, and said they see increased risks of both higher unemployment and inflation. Fed Chair Jerome Powell made clear the central bank is in no hurry to lower borrowing costs.

          Bostic said economists at the Atlanta Fed see tariffs as putting upward pressure on inflation. That’s a view shared by many forecasters.

          “That means that our policy is going to have to anticipate — and to some extent — potentially push against those inflationary forces to the extent that we see them, so that will put a limit on where our current policy stance is,” Bostic said.

          Source: Yahoo Finance

          To stay updated on all economic events of today, please check out our Economic calendar
          Risk Warnings and Disclaimers
          You understand and acknowledge that there is a high degree of risk involved in trading. Following any strategies or investment methods may lead to potential losses. The content on the site is provided by our contributors and analysts for information purposes only. You are solely responsible for determining whether any trading assets, securities, strategy, or any other product is suitable for investing based on your own investment objectives and financial situation.
          Add to Favorites
          Share

          EUR/USD Unchanged Amid Mixed News And Lingering Risks

          Blue River

          Technical Analysis

          Economic

          Forex

          The EUR/USD pair remained steady near 1.1196 on Friday, closing the week with little movement.

          Key drivers influencing EUR/USD

          Earlier in the week, the US dollar strengthened as the US-China trade dispute showed signs of easing. However, this optimism was short-lived due to disappointing economic data.

          The greenback initially rose by around 1% after Washington and Beijing agreed to reduce tariffs temporarily for 90 days, fuelling hopes of progress toward a broader trade deal. Yet, weak US economic indicators soon dampened sentiment:

          ●The April producer price index (PPI) fell to 2.4% year-on-year, down from 3.4% and below the forecast of 2.5%
          ●Month-on-month PPI dropped 0.5%, against expectations of no change
          ●US retail sales growth slowed sharply to 0.1% in March, following February’s 1.7% surge
          ●Industrial production stagnated in March after a 0.3% decline in February

          These concerning figures have led traders to price in additional Fed rate cuts for 2025.

          Technical analysis

          The EUR/USD continues to consolidate around 1.1173. A temporary rise to 1.1276 (testing resistance from below) remains possible, but this uptick is considered a corrective phase within the broader downtrend. Once complete, the pair may resume its decline toward 1.0950, this being the first key support level. The MACD indicator confirms this outlook, with its signal line below zero and pointing downward.

          The pair has already met a local bullish target at 1.12653, followed by a pullback to 1.1170. Today, another test of 1.1276 is plausible, but the broader expectation remains bearish, with a potential drop towards 1.1100. This scenario is reinforced by the Stochastic oscillator, whose signal line is above 80, suggesting an imminent downward reversal towards 20.

          The EUR/USD remains range-bound amid mixed fundamentals and technical signals. While a short-term rebound is possible, the dominant downtrend is expected to prevail, with key support levels at 1.0950 (H4) and 1.1100 (H1). Traders should monitor Fed policy expectations and upcoming economic data for further direction.

          Source: ACTIONFOREX

          To stay updated on all economic events of today, please check out our Economic calendar
          Risk Warnings and Disclaimers
          You understand and acknowledge that there is a high degree of risk involved in trading. Following any strategies or investment methods may lead to potential losses. The content on the site is provided by our contributors and analysts for information purposes only. You are solely responsible for determining whether any trading assets, securities, strategy, or any other product is suitable for investing based on your own investment objectives and financial situation.
          Add to Favorites
          Share

          Student Loan Crisis Resurfaces as Delinquency Hits Five-Year Peak

          Gerik

          Economic

          Delinquencies Spike as Student Loan Collections Resume

          Consumer debt in the United States is experiencing renewed stress as the long-standing moratorium on federal student loan payments officially ended, ushering in a wave of missed payments. According to the Federal Reserve Bank of New York, overall consumer debt delinquency rose sharply to 4.3% in Q1 2025, up from 3.6% the previous quarter and marking the highest rate since 2020. The primary driver of this surge is the rapid deterioration in student loan repayment compliance, after nearly five years of pandemic-related leniency.

          Student Loan Delinquency Returns to Pre-Pandemic Levels

          The return of mandatory collections has brought student loan delinquency back to what the New York Fed calls the “pre-pandemic normal.” Nearly 8% of total student debt is now classified as seriously delinquent—defined as over 90 days past due—compared to under 1% just a few months earlier. This drastic increase comes after the Biden administration’s proposed $400 billion student debt forgiveness plan was struck down by the U.S. Supreme Court, clearing the way for the Trump administration to resume full-scale collections.
          More than 10% of student loan balances are now either delinquent or in default. With a total outstanding balance of $1.63 trillion, student loans now account for 9% of all consumer debt in the U.S., putting tens of millions of borrowers at financial risk.

          Credit Scores Plunge as Grace Periods End

          One of the most severe consequences of resumed collections is the collapse in credit scores for millions of borrowers. The expiration of the Biden-era “on-ramp to repayment” grace period in September 2024 removed the protective buffer that temporarily prevented missed payments from being reported to credit bureaus.
          As a result, many Americans saw their credit scores drop by over 100 points in Q1 2025. The New York Fed reports that 2.4 million of the newly delinquent borrowers had credit scores above 620—high enough to qualify for mortgages, auto loans, or new credit cards before their delinquency status appeared. Now, these borrowers face a sharply reduced ability to access credit markets.

          A Shift in Political and Economic Priorities

          The Trump administration’s handling of student debt marks a decisive shift away from the borrower-friendly policies of the previous administration. According to U.S. Secretary of Education Linda McMahon, the new policy emphasizes fiscal responsibility and legal limitations on executive authority. McMahon argued that Biden’s plan misled borrowers and placed an unfair burden on taxpayers, stating, “American taxpayers will no longer be forced to serve as collateral for irresponsible student loan policies.”
          This policy shift may have broader economic consequences. The government is now authorized to recover debts through garnishment of tax refunds, Social Security payments, federal pensions, and even wages—adding further pressure to low- and middle-income households already struggling with inflation and stagnant wage growth.

          Future Borrowers Face Interest Rate Headwinds

          Beyond those currently in repayment, prospective college students are also facing an increasingly burdensome financial outlook. Interest rates on federal undergraduate loans remain near 15-year highs, tied to the surging 10-year Treasury yield. With borrowing costs elevated and default rates climbing, access to affordable education is becoming a greater financial strain, particularly for low-income students.
          The reintroduction of student loan collections is producing measurable financial distress across the U.S. economy. With six million borrowers already in default and millions more facing reduced credit access, the cumulative effects of rising debt burdens may weigh heavily on consumer spending, home buying, and financial stability. As political debates continue over how best to handle the student debt crisis, current indicators suggest that the expiration of forbearance measures has re-exposed a long-standing systemic vulnerability—one that could persist unless broader structural reforms are enacted.

          Source: The Fortune

          To stay updated on all economic events of today, please check out our Economic calendar
          Risk Warnings and Disclaimers
          You understand and acknowledge that there is a high degree of risk involved in trading. Following any strategies or investment methods may lead to potential losses. The content on the site is provided by our contributors and analysts for information purposes only. You are solely responsible for determining whether any trading assets, securities, strategy, or any other product is suitable for investing based on your own investment objectives and financial situation.
          Add to Favorites
          Share

          Europe Faces Pressure as U.S. Tariffs Divert China’s $440B Export Surge

          Gerik

          Economic

          China–U.S. Trade War

          Trade Tensions Shift Pressure from U.S. to Europe

          China, with its $18.5 trillion economy, is recalibrating export flows in the wake of persistent U.S. tariffs. Although a temporary trade truce was signed in Geneva between Vice Premier He Lifeng and U.S. officials, the American tariff wall — now over 30 percentage points higher than at the beginning of 2025 — remains largely intact for China.
          This leaves Beijing with limited access to its largest market, pushing Chinese manufacturers to offload excess goods elsewhere — especially to Europe, where trade barriers are lower and regulatory hurdles are less politically charged than in the U.S.

          Alarming Trade Imbalance Raises Red Flags in Brussels

          From January to April 2025, China’s trade surplus with the EU hit a record $90 billion, a sharp rise from historical averages. Analysts warn this is not an anomaly, but a sign of a structural shift: as Chinese goods face steep U.S. tariffs, they are now pivoting toward Europe and emerging markets.
          According to Maxime Darmet of Allianz Trade, China will attempt to “defend global market share” by flooding open markets — particularly the EU — with competitively priced products, further aided by the yuan's 10-year low against the euro.

          Europe Confronts Its Free Trade Dilemma

          For decades, the EU has championed open trade. But with China rerouting massive volumes of exports, European policymakers now face a painful reckoning. There is growing concern that an unchecked influx of Chinese products — particularly in green technology, EVs, and machinery — will undermine domestic industries, which are already losing global competitiveness.
          Alicia Garcia Herrero of Natixis warns that “free trade cannot survive in a protectionist world,” and that Europe will need customs tools to guard vulnerable sectors, especially as it seeks to build its own green industrial base.

          Chinese EVs, European Taxes, and a Brewing Trade Battle

          Despite the EU’s recent move to impose anti-dumping tariffs on Chinese electric vehicles, Chinese automakers have quickly adapted, boosting exports of hybrids and traditional fuel cars. These models — benefiting from massive domestic subsidies and lower costs — are quickly gaining ground in the EU market, particularly in price-sensitive segments.
          Tensions have escalated further with China slapping retaliatory tariffs on French cognac exports — a crucial sector for France — amid deepening rifts with individual EU nations like Germany and France.
          In 2020, Germany ran an $18 billion surplus with China. By 2023, that flipped to a $12 billion surplus in China’s favor, and estimates suggest it could exceed $25 billion by the end of 2025.

          A Wake-Up Call for EU Trade Policy

          European Trade Commissioner Maros Sefcovic has publicly acknowledged the threat of “trade diversion” and is expected to release a preliminary report this month. The issue is also set to dominate upcoming EU trade minister meetings in Brussels, as the bloc debates how to respond to China’s export redirection.
          Darmet warns that “this is no longer just a U.S.–China conflict”. Instead, it is an unfolding global realignment that “demands a strategic response” from European regulators.

          Strategic Shifts Ahead

          If the EU fails to act, it risks a structural erosion of its industrial base. A renewed focus on: reshoring production, strengthening internal manufacturing, and tightening import scrutinyis becoming a strategic necessity.
          The post-COVID recovery boom has faded, inflation remains volatile, and energy costs are still high. Against this backdrop, a surge in ultra-competitive Chinese exports could be the final blow to fragile sectors — unless Brussels adjusts its course.
          China's rerouted exports are not just an economic issue; they are a geopolitical warning. For the EU, the next few months may determine whether it continues to be an open trading bloc — or whether it finally embraces a “strategic protectionism” to survive a new era of trade realignment.
          To stay updated on all economic events of today, please check out our Economic calendar
          Risk Warnings and Disclaimers
          You understand and acknowledge that there is a high degree of risk involved in trading. Following any strategies or investment methods may lead to potential losses. The content on the site is provided by our contributors and analysts for information purposes only. You are solely responsible for determining whether any trading assets, securities, strategy, or any other product is suitable for investing based on your own investment objectives and financial situation.
          Add to Favorites
          Share

          Central Banks and the U.S. Are Hoarding Gold — Is a Global Monetary Reset Looming?

          Gerik

          Commodity

          Central Bank

          An Unusual Surge in Physical Gold Imports

          In just the first two months of 2025, the United States imported over 600 tonnes of physical gold — primarily from London and Switzerland — according to World Gold Council data. This volume, equivalent to 13% of the Fort Knox reserve, has triggered concern among analysts who warn this isn't merely speculative positioning or trade hedging. Instead, it's being interpreted as a strategic stockpiling maneuver.
          This trend occurs alongside a third consecutive year in which global central banks purchased over 1,000 tonnes of gold, the highest accumulation rate since the 1950s. Leading the charge are Russia and China, nations whose monetary strategies suggest a hedging move against systemic risks — or preparation for triggering structural change.

          Gold as a Hedge Against Systemic Instability

          Why the sudden return to gold?
          Because gold is the ultimate neutral asset — one that holds value regardless of political regime, fiat dilution, or currency collapse. While fiat currencies can be inflated or restructured, gold is finite, tangible, and independent of central bank policy manipulation.
          Ray Dalio, founder of Bridgewater Associates, has labeled the current moment as the “end of a long-term debt cycle,” referencing historic turning points like the collapse of Bretton Woods. That monetary system — which pegged currencies to the U.S. dollar backed by gold — has now lasted over 80 years, exceeding historical norms and, many argue, nearing its expiration.

          China and Russia: Strategic Moves in the Shadows

          China, holding $784 billion in U.S. Treasuries, has now permitted domestic enterprises to use foreign currency to purchase physical gold. If just 10% of those Treasuries were converted into bullion, the volume would rival nearly 8% of Fort Knox’s gold.
          Russia, meanwhile, has aggressively grown its reserves amid sanctions and geopolitical isolation, seeing gold as a politically neutral safeguard that bypasses the dollar-dominated SWIFT system.
          Both countries’ actions imply not only a hedge against inflation or dollar risk — but the foreshadowing of an alternative global monetary framework.

          The U.S. Joins the Gold Game — Quietly

          While the U.S. has long downplayed gold’s relevance in modern finance, recent moves suggest a pivot. The sudden inflow of massive gold shipments to U.S. vaults — rather than settling contracts digitally or via ETFs — is unprecedented in scale and intent.
          Some observers link this to U.S. President Donald Trump's second-term monetary rhetoric, including his suggestion to audit Fort Knox, which revived conspiracy theories over actual reserve levels. Though official accounts claim no change in America’s 8,133 tonnes of gold, the physical import wave tells a different story.

          Implications for Investors: Follow the Gold Trail

          The market message is clear: gold is rising not for its shine, but for its strategic significance. Central banks — the most cautious institutions on Earth — are buying at record levels. This is not a retail-led rally. It’s led by sovereign strategies anticipating a world where gold will once again define trust, value, and stability.
          If the world's financial architecture is preparing for restructuring — possibly due to U.S. trade volatility, supply shocks, geopolitical fragmentation, or systemic debt stress — then gold is the anchor asset in the storm.

          Source: MarketWatch

          Risk Warnings and Disclaimers
          You understand and acknowledge that there is a high degree of risk involved in trading. Following any strategies or investment methods may lead to potential losses. The content on the site is provided by our contributors and analysts for information purposes only. You are solely responsible for determining whether any trading assets, securities, strategy, or any other product is suitable for investing based on your own investment objectives and financial situation.
          Add to Favorites
          Share
          FastBull
          Copyright © 2025 FastBull Ltd

          728 RM B 7/F GEE LOK IND BLDG NO 34 HUNG TO RD KWUN TONG KLN HONG KONG

          TelegramInstagramTwitterfacebooklinkedin
          App Store Google Play Google Play
          Products
          Charts

          Chats

          Q&A with Experts
          Screeners
          Economic Calendar
          Data
          Tools
          Membership
          Features
          Function
          Markets
          Copy Trading
          Latest Signals
          Contests
          News
          Analysis
          24/7
          Columns
          Education
          Company
          Careers
          About Us
          Contact Us
          Advertising
          Help Center
          Feedback
          User Agreement
          Privacy Policy
          Business

          White Label

          Data API

          Web Plug-ins

          Poster Maker

          Affiliate Program

          Risk Disclosure

          The risk of loss in trading financial instruments such as stocks, FX, commodities, futures, bonds, ETFs and crypto can be substantial. You may sustain a total loss of the funds that you deposit with your broker. Therefore, you should carefully consider whether such trading is suitable for you in light of your circumstances and financial resources.

          No decision to invest should be made without thoroughly conducting due diligence by yourself or consulting with your financial advisors. Our web content might not suit you since we don't know your financial conditions and investment needs. Our financial information might have latency or contain inaccuracy, so you should be fully responsible for any of your trading and investment decisions. The company will not be responsible for your capital loss.

          Without getting permission from the website, you are not allowed to copy the website's graphics, texts, or trademarks. Intellectual property rights in the content or data incorporated into this website belong to its providers and exchange merchants.

          Not Logged In

          Log in to access more features

          FastBull Membership

          Not yet

          Purchase

          Become a signal provider
          Help Center
          Customer Service
          Dark Mode
          Price Up/Down Colors

          Log In

          Sign Up

          Position
          Layout
          Fullscreen
          Default to Chart
          The chart page opens by default when you visit fastbull.com