


- XAUUSD
- XAGUSD
- WTI
- USDX


Markets
Analysis
User
24/7
Economic Calendar
Education
Data
- Names
- Latest
- Prev


 早上你的多我没有进到还在睡觉…行情太迅猛了


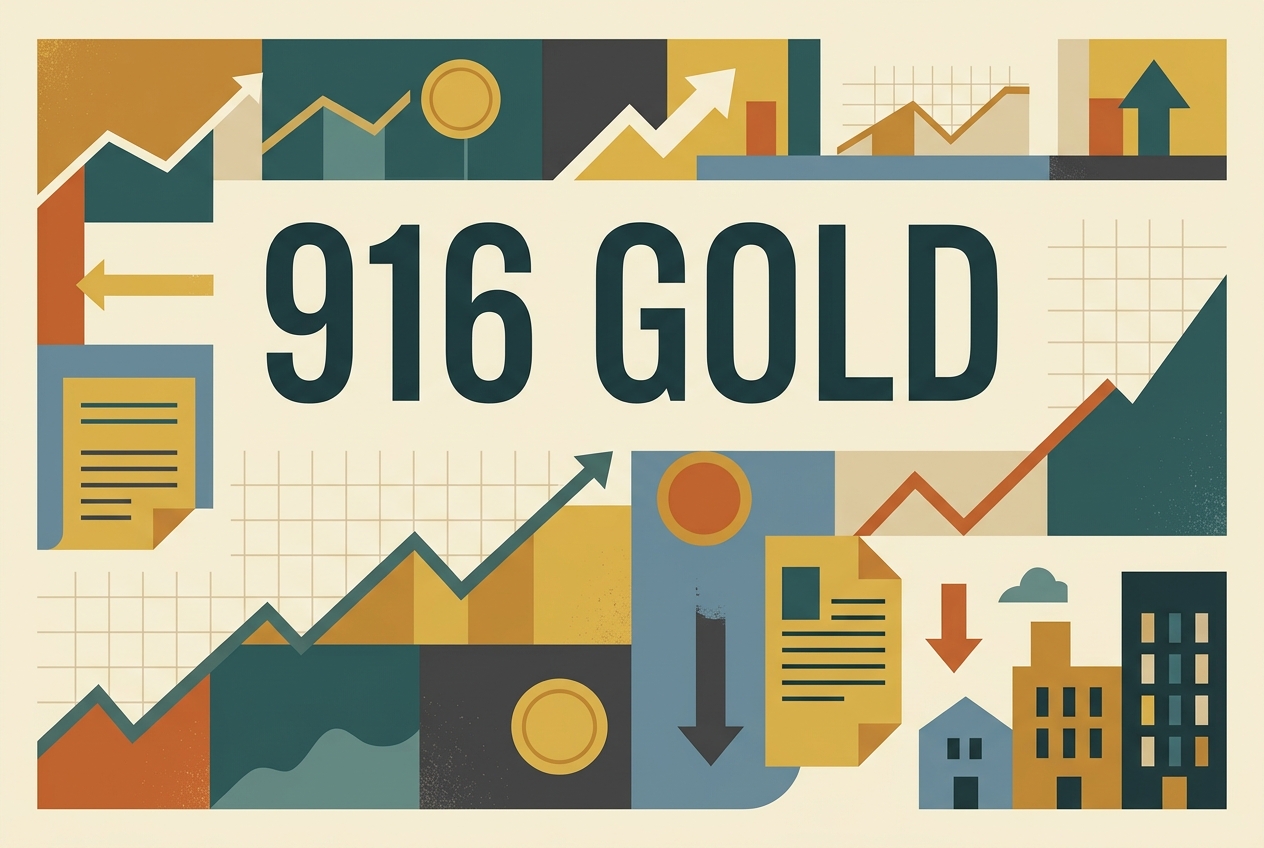
Navigating 22K gold? We examine the mechanisms behind the 916 gold price today 1 gram, analyzing the retail spreads and macro forces that define true value.
Tracking the daily value of 22-karat gold requires looking beyond standard global commodity tickers. For consumers navigating the retail jewelry market, understanding the exact mechanisms behind 916 gold pricing is essential for making informed financial decisions. This guide breaks down the live buy and sell rates across major regional markets, examines the macroeconomic forces driving recent trends, and evaluates whether current conditions favor accumulating or liquidating physical assets.
916 gold, universally categorized as 22-karat (22K) gold, consists of 91.67% pure gold and 8.33% alloyed metals such as copper, silver, or zinc. The number "916" represents its millesimal fineness, meaning there are 916 parts of pure gold per 1,000 total parts. This specific metallurgical composition serves a distinct functional purpose: pure 24K gold is too soft for daily wear, so the 8.33% alloy introduces the structural durability required for jewelry while maintaining high intrinsic value.
The purity level is the exact mathematical baseline for the 916 gold price today (1 gram). Because global gold markets—such as the London Bullion Market Association (LBMA)—price gold based on 99.99% purity (24K), the baseline intrinsic value of 916 gold is always a direct fraction of the global spot price.
Retail pricing for 916 gold is not a single floating number; it is a calculation combining global commodity pricing with localized retail structures. When you look up the 916 gold price today (1 gram) in major markets like Malaysia, India, or Singapore, the figure you see is calculated via the following framework:
Understanding the exact boundary between the two dominant retail gold categories clarifies the price differential and appropriate use case for each.
| Characteristic | 916 Gold (22K) | 999 Gold (24K) |
|---|---|---|
| Pure Gold Content | 91.67% | 99.9% to 99.99% |
| Alloy Composition | 8.33% (Copper, Silver, Zinc) | None (Trace elements only) |
| Primary Utility | Wearable jewelry, culturally significant gifting | Investment bullion, bars, and coins |
| Durability | High (Scratch and bend resistant) | Very Low (Easily deformed) |
| Price per Gram | Indexed to ~91.6% of spot + high making charges | Indexed to ~100% of spot + low dealer premiums |
Investors targeting raw exposure to gold spot price movements generally avoid 916 gold due to the high workmanship premiums, which create a wider bid-ask spread upon resale. Conversely, 916 gold remains the standard for cultural asset preservation in South Asian and Southeast Asian markets, where the 916 gold price today (1 gram) dictates daily retail jewelry transactions.
As of mid-May 2026, the baseline retail board rate for 1 gram of 916 gold (22K) averages RM 544 in Malaysia, SGD 186 in Singapore, and INR 14,950 in India. These baseline figures dictate the daily market floor, but they do not represent the final checkout cost or the cash liquidation value. The physical retail gold market operates on a dual-pricing model, cleanly separating the dealer ask (retail buying price) from the dealer bid (buyback or selling price).
To purchase 1 gram of 916 gold today, retail consumers will pay the local dealer's daily board rate plus a non-recoverable workmanship fee (WMS). The base "buying price" covers only the intrinsic value of the alloyed metal—91.6% pure gold mixed with 8.4% secondary metals like copper or zinc for structural durability.
Regional benchmarks for 1 gram of 916 gold before fabrication fees and local consumption taxes:
| Market | 1 Gram 916 Gold Price (Local Currency) | Market Drivers |
|---|---|---|
| Malaysia | RM 541 – RM 545 | Driven by the MYR/USD exchange rate and local demand spikes. Excludes the 8% SST applied at checkout. |
| Singapore | SGD 168 – SGD 186 | Pegged tightly to global spot markets. Prices fluctuate daily across major retail chains. |
| India | INR 14,745 – INR 14,950 | Heavily influenced by import duties and persistent cultural demand for BIS hallmarked 22K jewelry. |
When utilizing a 916 gold price calculator, buyers must explicitly isolate the metal cost from the craftsmanship markup. A highly intricate 1 gram 916 gold chain will command a significantly higher total checkout cost than a plain 1 gram 916 gold ring, despite carrying the exact same baseline metal weight.
When liquidating 1 gram of 916 gold for cash, consumers receive the dealer's buyback rate, which is universally discounted against the prevailing spot price. Unlike 999 (24K) investment bullion—which trades on narrow margins close to spot—916 gold is classified as jewelry. Dealers permanently deduct standard melting, refining, and assaying costs from the final payout.
If the 916 gold price today (1 gram) in Malaysia sits at RM 544, direct cash liquidation payouts will generally clear between RM 435 and RM 462. Consumers looking to sell physical gold face a strict valuation hierarchy. Highest per-gram valuations are granted for "trade-ins," where old 916 gold is exchanged directly for new inventory at the original retailer. Outright cash sales to third-party bullion traders or pawnshops yield lower returns, as these secondary buyers immediately factor in their own refining margins.
The effective buy-sell spread for retail 916 gold currently measures between 15% and 25%, widening or narrowing based on local market liquidity and exact jeweler policies. This spread represents the mathematical hurdle rate a buyer must clear just to break even on their acquisition.
The total spread comprises two distinct components:
For capital allocators, this structural spread confirms that 916 gold is an inefficient vehicle for short-term financial speculation. It functions effectively as wearable wealth or an intergenerational store of value, but the initial premium requires a minimum holding period of three to five years for global spot price appreciation to outpace the built-in dealer margin.
The baseline for the 916 gold price today (1 gram) is dictated directly by the international wholesale bullion market, modified by live forex conversions and regional retail markups. While the underlying metal value is anchored by macroeconomic forces like US Treasury yields and central bank reserves, the final quote a buyer sees depends heavily on currency strength against the US dollar.
The international gold spot price (XAU/USD) is trading near $4,600 per troy ounce as of mid-May 2026, establishing a historically high floor for 22K retail pricing. This wholesale benchmark dictates the raw material cost before jewelers apply manufacturing and labor margins. Recent intraday pricing has faced minor downward pressure as the 10-year US Treasury real yield found support near 1.85%, raising the opportunity cost of holding non-yielding assets.
However, retail buyers never pay the exact spot price. A consumer purchasing physical 916 gold pays a blended rate combining the raw material with operational costs.
| Pricing Component | Mechanism | Typical Retail Impact |
|---|---|---|
| XAU/USD Spot Baseline | The live wholesale market value of exactly 0.9167 grams of pure gold. | Dictates 80–90% of the final retail price. |
| Workmanship & Retail Premium | Manufacturing costs, labor, regional logistics, and dealer profit margins. | Adds 10% to 20% above the spot equivalent. |
| Dealer Hedging Buffer | A localized spread applied by jewelers to protect against sudden intraday volatility. | Adds 1% to 3% to the live quoted rate. |
Local currency weakness against the US Dollar directly inflates retail gold quotes, meaning local prices can rise even when the international spot market drops. Because global wholesale gold is priced strictly in USD, retail buyers effectively execute a currency exchange transaction simultaneously with their physical bullion purchase.
This dynamic creates specific pricing scenarios for retail buyers monitoring rates at regional dealers like Poh Kong, Joyalukkas, or Mustafa Centre:
Today’s 916 gold rates are lower than last month's historic highs but show elevated week-over-week volatility. Retail prices across Southeast Asia and India reflect a 2% to 4% discount compared to mid-April 2026 peaks, driven primarily by macroeconomic shifts in US interest rate expectations.
Over the past seven days ending May 15, 2026, the 1-gram price of 916 gold has decreased by approximately 1.5% to 2.1% across major Asian markets. This downward pressure stems from a stronger US dollar and recent US inflation data pushing markets to price out Federal Reserve rate cuts for the year.
| Market / Benchmark | Previous Week (1g 22K) | May 15, 2026 (1g 22K) | 7-Day Variance |
|---|---|---|---|
| Singapore (Mustafa) | SGD 188.40 | SGD 184.40 | -2.1% |
| Malaysia (SK Jewellery) | RM 655.00 | RM 645.00 | -1.5% |
| India (Domestic Average) | ₹14,883 | ₹14,595 | -1.9% |
Local currency strength against the USD dictates the exact magnitude of this drop in each country. Buyers waiting for a dip are currently seeing lower entry points, though higher local import duties—such as India's recent tariff hike on precious metals to 15%—are keeping domestic retail rates from fully matching the global spot decline.
916 gold is cheaper today than it was in mid-April 2026, trading roughly 4% below the record highs seen last month.
In mid-April, global spot gold peaked near $4,773 per ounce, pulling 22K (916) retail prices to unprecedented levels. Today, spot prices hover closer to $4,570. This correction is a direct response to hawkish macroeconomic repricing. With US consumer inflation rising to 3.8% in April 2026, institutional investors rotated into higher-yielding assets like bonds, reducing the immediate demand for non-yielding bullion.
For buyers assessing month-over-month entry points, three factors dictate the actual retail savings:
Deciding whether to buy or sell 916 gold today hinges on two precise metrics: the current 15% to 25% retail spread and the 41% year-over-year surge in global spot gold prices as of May 2026. Because 916 gold (22-karat) trades as a finished retail product rather than a spot commodity, executing a transaction requires overcoming significant dealer premiums.
| Action | Favorable Market Conditions | Unfavorable Market Conditions | Frictional Costs Incurred |
|---|---|---|---|
| Buy | Accumulating for multi-generational wealth transfer; hedging local fiat devaluation. | Seeking a short-term trade (under 5 years) to capture price momentum. | 15–25% retail premium over spot + making charges/workmanship fees. |
| Sell | Liquidating inventory bought prior to 2024; capitalizing on spot prices exceeding $4,500/oz. | Trading back to a different dealer than the original seller (widens the discount). | 10–20% dealer buyback spread applied to the daily retail rate. |
Selling 916 gold mathematically favors individuals who acquired their jewelry or bullion before 2025. With international spot prices sustaining unprecedented levels between $4,500 and $4,700 per ounce, the underlying melt value of 22K gold easily absorbs historical retail premiums. Liquidating 916 gold still triggers a structured penalty: jewelers enforce a buyback spread, setting the cash offer 10% to 20% below the live 916 gold price today (1 gram) retail rate. Returning to the original jeweler with the original receipt—such as a Poh Kong or SMS Deen location—minimizes this deduction. Trading with a third-party competitor maximizes the penalty, as the buyer prices the asset strictly at its scrap melt value.
Acquiring 916 gold requires a minimum five-to-seven-year holding period to recover front-end transaction costs. Unlike 24K (999) bullion, a physical 916 gold purchase stacks two immediate markups: the dealer’s premium over spot and a fixed workmanship fee. If the 916 gold price today (1 gram) in Malaysia is quoted at a local fiat baseline, the final out-of-pocket cost climbs significantly once labor fees attach. The global spot price of gold must appreciate by the exact equivalent of that combined margin before a buyer reaches a true break-even point on a future resale.
The precise break-even calculation shifts based on regional pricing models:
The price of 1 gram of 916 gold fluctuates daily based on global market conditions and varies significantly depending on your location. As of mid-May 2026, the retail benchmark price for 1 gram of 916 gold is approximately S$245 to S$260 in Singapore and roughly ₹14,000 in India. It is important to note that this is only the baseline material rate, and final purchase prices are usually higher once dealer premiums and fees are applied.
The baseline per-gram price of 916 gold is calculated by taking the international spot price of pure gold and adjusting it to reflect a 91.6% purity level. When buying a specific piece of jewelry, jewelers determine the base material cost by multiplying the item's total weight in grams by this daily 916 gold rate. The final retail price is then reached by adding applicable taxes, import duties, and a workmanship fee that accounts for the labor and design complexity.
Daily fluctuations in 916 gold prices are directly tied to the international spot market, which constantly reacts to global supply and demand. Broader macroeconomic indicators, such as US Federal Reserve interest rate decisions, global inflation levels, and geopolitical instability, also drive investor demand and push prices up or down. Furthermore, because gold is traded globally in US dollars, any shifts in local currency exchange rates against the dollar will cause domestic gold prices to change daily.
A 916 hallmark indicates that the item is 22-karat (22K) gold. This stamp signifies that the metal contains 91.6% pure gold, with the remaining 8.4% made up of alloyed metals like copper or zinc to increase the jewelry's durability. In contrast, 24K gold is 99.9% pure and is recognized by a 999 hallmark instead.
Navigating the 916 gold market requires factoring in both global wholesale trends and localized retail premiums. While 22K jewelry remains a culturally significant and durable store of value, the built-in fabrication costs and dealer spreads make it better suited for long-term preservation rather than short-term speculation. Consumers who understand these pricing mechanisms—and carefully monitor currency fluctuations and buyback rates—are positioned to maximize their returns whether they are acquiring new assets or liquidating historical holdings.
728 RM B 7/F GEE LOK IND BLDG NO 34 HUNG TO RD KWUN TONG KLN HONG KONG


The risk of loss in trading financial instruments such as stocks, FX, commodities, futures, bonds, ETFs and crypto can be substantial. You may sustain a total loss of the funds that you deposit with your broker. Therefore, you should carefully consider whether such trading is suitable for you in light of your circumstances and financial resources.
No decision to invest should be made without thoroughly conducting due diligence by yourself or consulting with your financial advisors. Our web content might not suit you since we don't know your financial conditions and investment needs. Our financial information might have latency or contain inaccuracy, so you should be fully responsible for any of your trading and investment decisions. The company will not be responsible for your capital loss.
Without getting permission from the website, you are not allowed to copy the website's graphics, texts, or trademarks. Intellectual property rights in the content or data incorporated into this website belong to its providers and exchange merchants.
Not Logged In
Log in to access more features


Log In
Sign Up


