• Trade
  • Markets
  • Copy
  • Contests
  • News
  • 24/7
  • Calendar
  • Q&A
  • Chats
Trending
Screeners
SYMBOL
LAST
BID
ASK
HIGH
LOW
NET CHG.
%CHG.
SPREAD
SPX
S&P 500 Index
6857.13
6857.13
6857.13
6865.94
6827.13
+7.41
+ 0.11%
--
DJI
Dow Jones Industrial Average
47850.93
47850.93
47850.93
48049.72
47692.96
-31.96
-0.07%
--
IXIC
NASDAQ Composite Index
23505.13
23505.13
23505.13
23528.53
23372.33
+51.04
+ 0.22%
--
USDX
US Dollar Index
98.760
98.840
98.760
98.980
98.760
-0.220
-0.22%
--
EURUSD
Euro / US Dollar
1.16676
1.16683
1.16676
1.16681
1.16408
+0.00231
+ 0.20%
--
GBPUSD
Pound Sterling / US Dollar
1.33578
1.33587
1.33578
1.33585
1.33165
+0.00307
+ 0.23%
--
XAUUSD
Gold / US Dollar
4228.65
4229.06
4228.65
4230.48
4194.54
+21.48
+ 0.51%
--
WTI
Light Sweet Crude Oil
59.377
59.414
59.377
59.469
59.187
-0.006
-0.01%
--

Community Accounts

Signal Accounts
--
Profit Accounts
--
Loss Accounts
--
View More

Become a signal provider

Sell trading signals to earn additional income

View More

Guide to Copy Trading

Get started with ease and confidence

View More

Signal Accounts for Members

All Signal Accounts

Best Return
  • Best Return
  • Best P/L
  • Best MDD
Past 1W
  • Past 1W
  • Past 1M
  • Past 1Y

All Contests

  • All
  • Trump Updates
  • Recommend
  • Stocks
  • Cryptocurrencies
  • Central Banks
  • Featured News
Top News Only
Share

Equinor: Preliminary Estimates Indicate Reservoirs May Contain Between 5 -18 Million Standard Cubic Meters Of Recoverable Oil Equivalents

Share

Japan Chief Cabinet Secretary Kihara: Government To Take Appropriate Steps On Excessive And Disorderly Moves In Foreign Exchange Market, If Necessary

Share

[Report: Amazon Pays €180 Million To Italy To End Tax And Labor Investigations] Amazon Has Paid A Settlement And Dismantled Its Monitoring System For Delivery Drivers In Italy, Ending An Investigation Into Alleged Tax Fraud And Illegal Labor Practices. In July 2024, The Group's Logistics Services Division Was Accused Of Circumventing Labor And Tax Laws By Relying On Cooperatives Or Limited Liability Companies To Supply Workers, Evading VAT, And Reducing Social Security Payments. Sources Say The Group Has Now Paid Approximately €180 Million To Italian Tax Authorities As Part Of A €1 Billion Settlement Involving 33 Companies

Share

Airbus - Booked 797 Gross Aircraft Orders In January-November

Share

[Market Update] Spot Gold Broke Through $4,230 Per Ounce, Up 0.51% On The Day

Share

Reserve Bank Of India Chief Malhotra: There Will Be Ample Liquidity As Long As We Are In An Easing Cycle

Share

Reserve Bank Of India Chief Malhotra: Quantum Of System Liquidity Will Be Managed To Ensure Monetary Transmission Is Happening

Share

China's Foreign Ministry: World Bank, IMF, WTO Top Officials To Join

Share

China's Foreign Ministry: China To Hold 1+1 Dialogue With International Economic Orgs On Dec 9

Share

Reserve Bank Of India Chief Malhotra: 5% Of Inr Depreciation Leads To 35 Bps Of Inflation

Share

Eurostoxx 50 Futures Up 0.14%, DAX Futures Up 0.12%, CAC 40 Futures Up 0.26%, FTSE Futures Up 0.03%

Share

Getlink - Over 1 Million Trucks Crossed Channel Since January 2025

Share

Malaysia International Reserves At $124.1 Billion On November 28 Versus$124.1 Billion On November 14 - Central Bank

Share

Reserve Bank Of India Chief Malhotra: Conscious Effort On Diversifying Gold Reserves

Share

Russian President Putin Thanks Indian Prime Minister Modi For Attention To Ukraine Peace Efforts

Share

Russian President Putin: India-Russia Relations Should Grow And Touch New Heights

Share

Russian President Putin: India Is Not Neutral, India Is On The Side Of Peace

Share

Russian President Putin: We Support Every Effort Towards Peace

Share

Russian President Putin: The World Should Return To Peace

Share

India Prime Minister Modi: We Should All Pursue Peace Together

TIME
ACT
FCST
PREV
Euro Zone IHS Markit Construction PMI (Nov)

A:--

F: --

P: --

Italy IHS Markit Construction PMI (Nov)

A:--

F: --

P: --

U.K. Markit/CIPS Construction PMI (Nov)

A:--

F: --

P: --

France 10-Year OAT Auction Avg. Yield

A:--

F: --

P: --

Euro Zone Retail Sales MoM (Oct)

A:--

F: --

P: --

Euro Zone Retail Sales YoY (Oct)

A:--

F: --

P: --

Brazil GDP YoY (Q3)

A:--

F: --

P: --

U.S. Challenger Job Cuts (Nov)

A:--

F: --

P: --

U.S. Challenger Job Cuts MoM (Nov)

A:--

F: --

P: --

U.S. Challenger Job Cuts YoY (Nov)

A:--

F: --

P: --

U.S. Initial Jobless Claims 4-Week Avg. (SA)

A:--

F: --

P: --

U.S. Weekly Initial Jobless Claims (SA)

A:--

F: --

P: --

U.S. Weekly Continued Jobless Claims (SA)

A:--

F: --

P: --

Canada Ivey PMI (SA) (Nov)

A:--

F: --

P: --

Canada Ivey PMI (Not SA) (Nov)

A:--

F: --

P: --

U.S. Non-Defense Capital Durable Goods Orders Revised MoM (Excl. Aircraft) (SA) (Sept)

A:--

F: --

P: --
U.S. Factory Orders MoM (Excl. Transport) (Sept)

A:--

F: --

P: --

U.S. Factory Orders MoM (Sept)

A:--

F: --

P: --

U.S. Factory Orders MoM (Excl. Defense) (Sept)

A:--

F: --

P: --

U.S. EIA Weekly Natural Gas Stocks Change

A:--

F: --

P: --

Saudi Arabia Crude Oil Production

A:--

F: --

P: --

U.S. Weekly Treasuries Held by Foreign Central Banks

A:--

F: --

P: --

Japan Foreign Exchange Reserves (Nov)

A:--

F: --

P: --

India Repo Rate

A:--

F: --

P: --

India Benchmark Interest Rate

A:--

F: --

P: --

India Reverse Repo Rate

A:--

F: --

P: --

India Cash Reserve Ratio

A:--

F: --

P: --

Japan Leading Indicators Prelim (Oct)

A:--

F: --

P: --

U.K. Halifax House Price Index YoY (SA) (Nov)

A:--

F: --

P: --

U.K. Halifax House Price Index MoM (SA) (Nov)

A:--

F: --

P: --

France Current Account (Not SA) (Oct)

--

F: --

P: --

France Trade Balance (SA) (Oct)

--

F: --

P: --

France Industrial Output MoM (SA) (Oct)

--

F: --

P: --

Italy Retail Sales MoM (SA) (Oct)

--

F: --

P: --

Euro Zone Employment YoY (SA) (Q3)

--

F: --

P: --

Euro Zone GDP Final YoY (Q3)

--

F: --

P: --

Euro Zone GDP Final QoQ (Q3)

--

F: --

P: --

Euro Zone Employment Final QoQ (SA) (Q3)

--

F: --

P: --

Euro Zone Employment Final (SA) (Q3)

--

F: --

P: --
Brazil PPI MoM (Oct)

--

F: --

P: --

Mexico Consumer Confidence Index (Nov)

--

F: --

P: --

Canada Unemployment Rate (SA) (Nov)

--

F: --

P: --

Canada Labor Force Participation Rate (SA) (Nov)

--

F: --

P: --

Canada Employment (SA) (Nov)

--

F: --

P: --

Canada Part-Time Employment (SA) (Nov)

--

F: --

P: --

Canada Full-time Employment (SA) (Nov)

--

F: --

P: --

U.S. Personal Income MoM (Sept)

--

F: --

P: --

U.S. Dallas Fed PCE Price Index YoY (Sept)

--

F: --

P: --

U.S. PCE Price Index YoY (SA) (Sept)

--

F: --

P: --

U.S. PCE Price Index MoM (Sept)

--

F: --

P: --

U.S. Personal Outlays MoM (SA) (Sept)

--

F: --

P: --

U.S. Core PCE Price Index MoM (Sept)

--

F: --

P: --

U.S. UMich 5-Year-Ahead Inflation Expectations Prelim YoY (Dec)

--

F: --

P: --

U.S. Core PCE Price Index YoY (Sept)

--

F: --

P: --

U.S. Real Personal Consumption Expenditures MoM (Sept)

--

F: --

P: --

U.S. 5-10 Year-Ahead Inflation Expectations (Dec)

--

F: --

P: --

U.S. UMich Current Economic Conditions Index Prelim (Dec)

--

F: --

P: --

U.S. UMich Consumer Sentiment Index Prelim (Dec)

--

F: --

P: --

U.S. UMich 1-Year-Ahead Inflation Expectations Prelim (Dec)

--

F: --

P: --

U.S. UMich Consumer Expectations Index Prelim (Dec)

--

F: --

P: --

Q&A with Experts
    • All
    • Chatrooms
    • Groups
    • Friends
    Connecting
    .
    .
    .
    Type here...
    Add Symbol or Code

      No matching data

      All
      Trump Updates
      Recommend
      Stocks
      Cryptocurrencies
      Central Banks
      Featured News
      • All
      • Russia-Ukraine Conflict
      • Middle East Flashpoint
      • All
      • Russia-Ukraine Conflict
      • Middle East Flashpoint

      Search
      Products

      Charts Free Forever

      Chats Q&A with Experts
      Screeners Economic Calendar Data Tools
      Membership Features
      Data Warehouse Market Trends Institutional Data Policy Rates Macro

      Market Trends

      Market Sentiment Order Book Forex Correlations

      Top Indicators

      Charts Free Forever
      Markets

      News

      News Analysis 24/7 Columns Education
      From Institutions From Analysts
      Topics Columnists

      Latest Views

      Latest Views

      Trending Topics

      Top Columnists

      Latest Update

      Signals

      Copy Rankings Latest Signals Become a signal provider AI Rating
      Contests
      Brokers

      Overview Brokers Assessment Rankings Regulators News Claims
      Broker listing Forex Brokers Comparison Tool Live Spread Comparison Scam
      Q&A Complaint Scam Alert Videos Tips to Detect Scam
      More

      Business
      Events
      Careers About Us Advertising Help Center

      White Label

      Data API

      Web Plug-ins

      Affiliate Program

      Awards Institution Evaluation IB Seminar Salon Event Exhibition
      Vietnam Thailand Singapore Dubai
      Fans Party Investment Sharing Session
      FastBull Summit BrokersView Expo
      Recent Searches
        Top Searches
          Markets
          News
          Analysis
          User
          24/7
          Economic Calendar
          Education
          Data
          • Names
          • Latest
          • Prev

          View All

          No data

          Scan to Download

          Faster Charts, Chat Faster!

          Download App
          English
          • English
          • Español
          • العربية
          • Bahasa Indonesia
          • Bahasa Melayu
          • Tiếng Việt
          • ภาษาไทย
          • Français
          • Italiano
          • Türkçe
          • Русский язык
          • 简中
          • 繁中
          Open Account
          Search
          Products
          Charts Free Forever
          Markets
          News
          Signals

          Copy Rankings Latest Signals Become a signal provider AI Rating
          Contests
          Brokers

          Overview Brokers Assessment Rankings Regulators News Claims
          Broker listing Forex Brokers Comparison Tool Live Spread Comparison Scam
          Q&A Complaint Scam Alert Videos Tips to Detect Scam
          More

          Business
          Events
          Careers About Us Advertising Help Center

          White Label

          Data API

          Web Plug-ins

          Affiliate Program

          Awards Institution Evaluation IB Seminar Salon Event Exhibition
          Vietnam Thailand Singapore Dubai
          Fans Party Investment Sharing Session
          FastBull Summit BrokersView Expo

          USD/CHF Falls To Two-Week Low

          FXOpen

          Economic

          Forex

          Summary:

          This morning, the USD/CHF exchange rate slipped below 0.7944 for the first time since 1 October, as demand for safe-haven assets intensified — a trend also reflected in yesterday’s record gold price above $4,200.

          This morning, the USD/CHF exchange rate slipped below 0.7944 for the first time since 1 October, as demand for safe-haven assets intensified — a trend also reflected in yesterday’s record gold price above $4,200.The traditionally stable Swiss franc is strengthening amid rising global uncertainty and risk aversion:

          → In Japan, the upcoming prime ministerial election could significantly impact monetary policy, while France faces ongoing political turmoil.

          → In the United States, the government shutdown continues, and traders are closely watching developments around a potential trade deal with China, possibly to be discussed during an expected meeting between the two countries’ leaders.

          Technical Analysis of the USD/CHF Chart

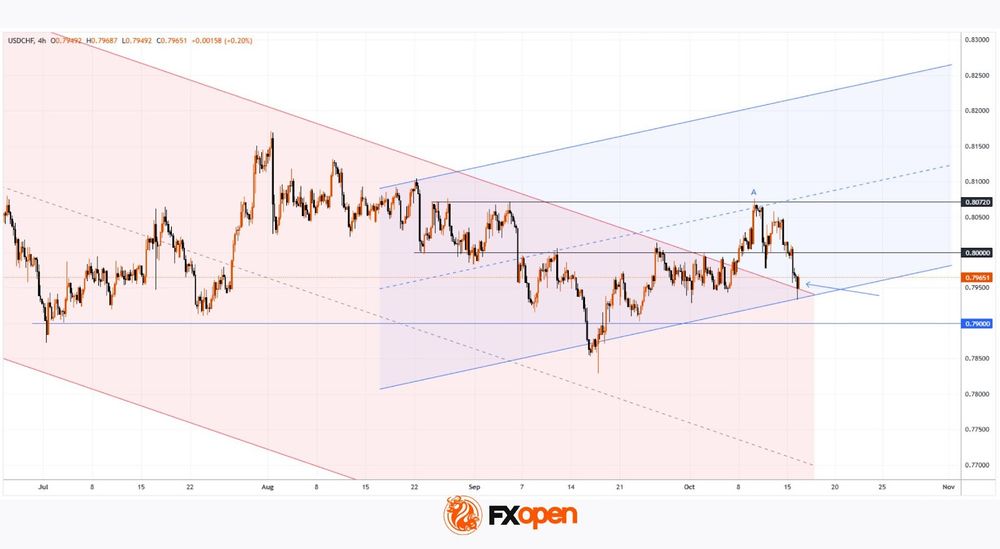
          As noted in our 25 September analysis, the Swiss franc has appreciated through 2025 amid elevated geopolitical and macroeconomic risks, forming a downward channel on the USD/CHF chart (shown in red).

          We also highlighted:

          → the possibility of a trend reversal around the 0.7900 support area;

          → potential breakout targets (shown in blue).

          Since then, the bulls have indeed made progress, driving the price up towards point A and:

          → breaking above the red channel’s upper boundary;

          → overcoming the psychological 0.8000 level.

          However, that progress has not been sustained. Among the bearish signals:

          → the median line of the blue channel acted as resistance;

          → the brief move above local highs around 0.8072 resembles a bearish liquidity grab.

          From the bullish perspective, USD/CHF has now retreated into a zone that could act as support:

          → the upper boundary of the red channel;

          → the lower boundary of the blue channel.

          The arrow highlights signs of a bullish engulfing pattern, suggesting that buyers may be using these support zones to stage a rebound within the blue channel. The 0.8000 psychological mark could serve as the first key test of their resolve.

          Source: FXOpen

          To stay updated on all economic events of today, please check out our Economic calendar
          Risk Warnings and Disclaimers
          You understand and acknowledge that there is a high degree of risk involved in trading. Following any strategies or investment methods may lead to potential losses. The content on the site is provided by our contributors and analysts for information purposes only. You are solely responsible for determining whether any trading assets, securities, strategy, or any other product is suitable for investing based on your own investment objectives and financial situation.
          Add to Favorites
          Share

          China Holds Off On Soybean Purchases Due To High Brazil Premiums, Traders Say

          Samantha Luan

          Commodity

          Forex

          Economic

          Key points:

          ● China seen buying about 9 million tonnes for Dec-Jan shipment
          ● High Brazilian premiums may prompt China to use state reserves
          ● Uncertainty lingers over U.S.-China soybean talks

          China has yet to secure much of its soybean supply for December and January as high premiums for Brazilian cargoes discourage buyers, a development that could prompt Beijing to tap state reserves to meet near-term needs, three trade sources said.China still needs to purchase about 8–9 million metric tons of soybeans for December-January shipment after covering cargoes through November with hefty purchases of Argentine beans in recent weeks, the sources said. Escalating Washington-Beijing trade tensions continue to shut out U.S. supplies.

          "China is not buying U.S. beans because of the trade war and Brazilian beans are too expensive," said one oilseed trader at an international trading company which supplies agricultural products to China."China might end up using its own reserves for the year-end and early next year, before the new South American harvest comes in." he said.

          BRAZILIAN SOYBEAN PREMIUMS

          Brazilian soybean premiums are holding at $2.8-2.9 per bushel over the November Chicago soybean contract (SX25) compared with U.S. premiums at around $1.7 per bushel.Crush margins have been in negative territory (CNSOY-RZO-MRG) for most of the second half of the year.

          China Holds Off On Soybean Purchases Due To High Brazil Premiums, Traders Say_1

          Thomson ReutersChina's record soybean imports weigh on crush margins

          Crushers have little motivation to secure December-January soybean cargoes as supplies from Brazil have squeezed their margins, said a Shanghai-based trader.Chinese buyers are hoping that an early and record soybean harvest in Brazil in early 2026 will help ease prices.Brazilian farmers are expected to harvest a record 177.64 million metric tons of soybeans in the 2025/26 season, around 6 million tons more than the previous year, crop agency Conab said.

          "We think new crop shipments from Brazil can start at end of January," said a second oilseed trader. Sources declined to be named as they were not authorised to speak to media.

          U.S.-CHINA SOYBEAN TALKS

          Chinese buyers have also not yet entirely written off U.S. supplies, with oilseed processors likely to make purchases for December-January if there is a trade agreement between the two governments, traders and analysts said."If a deal goes through, Chinese buyers will likely turn to U.S. beans for the two-month window, with prices more attractive than South American offers," said Johnny Xiang, founder of Beijing-based AgRadar Consulting.Soybeans are expected to feature on the agenda for a potential meeting between U.S. President Donald Trump and Chinese President Xi Jinping in South Korea. Beijing has, however, yet to publicly confirm the talks.

          On Tuesday, Trump accused China of "purposefully" avoiding U.S. soybean purchases, calling it an "economically hostile act" that has "caused difficulties" for American soybean farmers.Since the first Trump administration, China has diversified its soybean imports. In 2024, China bought roughly 20% of its soybeans from the U.S., down from 41% in 2016, customs data shows.

          Source: TradingView

          To stay updated on all economic events of today, please check out our Economic calendar
          Risk Warnings and Disclaimers
          You understand and acknowledge that there is a high degree of risk involved in trading. Following any strategies or investment methods may lead to potential losses. The content on the site is provided by our contributors and analysts for information purposes only. You are solely responsible for determining whether any trading assets, securities, strategy, or any other product is suitable for investing based on your own investment objectives and financial situation.
          Add to Favorites
          Share

          Asian Markets Rise on Wall Street Rebound, Gold Rally, and Earnings Optimism

          Gerik

          Economic

          Asian Stocks Track Wall Street Gains Amid Global Optimism

          Most Asian stock markets closed higher on Thursday following an erratic but ultimately positive session in the U.S., where major indexes recovered from sharp intraday swings. The upbeat mood was fueled by robust earnings reports, a rally in precious metals, and growing speculation that the Federal Reserve will begin easing interest rates.
          Japan’s Nikkei 225 led the regional rally, jumping 1.3% to 48,277.74, driven by early corporate earnings surprises and rate-cut optimism. Although Japan’s core machinery orders in August disappointed, falling 0.9% month-on-month against expectations of a 0.4% rise, the data still showed an improvement from July’s 4.6% slump, softening investor concern about domestic demand.

          South Korea’s Kospi Hits Record on Tech and Trade Deal Hopes

          South Korea’s Kospi surged 2.5% to an all-time high of 3,748.37, lifted by gains in heavyweight tech and auto stocks. Optimism over a potential U.S.-Korea trade deal ahead of the upcoming APEC summit fueled bullish sentiment. Key performers included Samsung Electronics (+2.84%), Hyundai Motor (+8.28%), and Kia Corp (+7.23%), as investors piled into export-driven names.
          The record-setting performance follows a strong upward trend this week, supported by hopes that easing trade friction and growing U.S. demand will support Korean exports.

          China Mixed, Australia Buoyed by Gold Surge

          Chinese markets were more subdued. The Hang Seng Index in Hong Kong dipped 0.4% to 25,812.20, while the Shanghai Composite was largely flat at 3,911.42, reflecting lingering concerns over domestic economic softness and geopolitical tensions. Investors in mainland China appeared cautious amid tightening export regulations and a subdued property market.
          In contrast, Australia’s S&P/ASX 200 climbed 0.9% to close at 9,068.40, breaking the 9,000 mark for the first time. Gains were led by gold miners, as gold surged to $4,237.60 per ounce, up 0.9% in early Thursday trade. The rally in gold, driven by geopolitical uncertainty and expectations of Fed rate cuts, bolstered investor sentiment in resource-heavy markets like Australia.
          However, the rally came alongside weaker domestic labor data, as the unemployment rate rose to 4.5%, the highest in four years. This has increased the likelihood of an interest rate cut by the Reserve Bank of Australia as soon as next month.

          Broader Asia Follows Uptrend; Wall Street Volatility Underpins Global Sentiment

          Elsewhere in the region, India’s Sensex gained 0.5%, and Taiwan’s Taiex added 1.4%, both reflecting spillover confidence from the U.S. tech-led rally. On Wall Street Wednesday, the S&P 500 rose 0.4% to 6,671.06, the Nasdaq Composite climbed 0.7% to 22,670.08, while the Dow Jones was nearly unchanged, shedding less than 0.1%.
          Tech stocks led the way after ASML, a key semiconductor equipment maker, posted stronger-than-expected earnings and forecasted 15% revenue growth for 2025. The Dutch firm’s outlook supported bullish expectations for the global chip sector, helping stabilize investor sentiment after recent market volatility.

          Oil and Currency Markets Show Modest Movement

          In commodities, U.S. benchmark crude rose $0.51 to $58.78 per barrel, and Brent crude increased $0.41 to $62.32, reflecting stable global demand expectations despite geopolitical risk.
          In foreign exchange, the dollar strengthened slightly to 151.20 yen, while the euro edged up to $1.1660, showing limited currency volatility amid subdued macroeconomic updates due to the ongoing U.S. government shutdown.

          Earnings, Gold, and Rate Cut Bets Steer Sentiment

          Thursday’s market momentum reflects a fragile but hopeful investor outlook. While volatility remains elevated especially in U.S. indices the narrative is being shaped by stronger-than-expected corporate earnings, a shift toward monetary easing, and rising safe-haven flows into gold.
          Asian markets are benefiting from this backdrop, with export-oriented economies like South Korea and commodity-driven ones like Australia emerging as standout performers. Investors will now closely watch next week’s earnings reports from major U.S. tech firms and policy statements from central banks to gauge whether this rally has further room to run.

          Source: AP

          To stay updated on all economic events of today, please check out our Economic calendar
          Risk Warnings and Disclaimers
          You understand and acknowledge that there is a high degree of risk involved in trading. Following any strategies or investment methods may lead to potential losses. The content on the site is provided by our contributors and analysts for information purposes only. You are solely responsible for determining whether any trading assets, securities, strategy, or any other product is suitable for investing based on your own investment objectives and financial situation.
          Add to Favorites
          Share

          Gold Soars to All-Time High Amid Trade War Escalation and Fed Rate-Cut Expectations

          Gerik

          Economic

          Commodity

          Gold Rally Accelerates on Policy and Geopolitical Uncertainty

          Gold extended its parabolic rally on Thursday, breaking through $4,242 per ounce and notching a fresh record. This sharp rise, more than 5% higher for the week, reflects a confluence of investor anxieties including the U.S.-China trade war, political instability in Washington, and dovish signals from the Federal Reserve.
          The broader move into precious metals gained further traction as silver surged over 3% midweek, fueled by an ongoing liquidity crunch in the London market. Palladium also advanced, while platinum held steady.
          The recent surge in gold is the continuation of a rally that began in mid-August and is now underpinned by both macroeconomic instability and structural market shifts. The rise in gold has now topped 60% year-to-date, marking one of the most explosive annual performances in modern financial history.

          Rate-Cut Bets and the Debasement Trade Drive Momentum

          Markets are increasingly pricing in at least one large Federal Reserve rate cut before year-end, with Fed Chair Jerome Powell signaling the likelihood of a quarter-point cut at the next meeting. The move towards easier monetary policy reinforces gold’s appeal, particularly because gold does not yield interest and becomes more attractive when real rates decline.
          Investors are also pursuing what has been labeled the “debasement trade” a rotation out of fiat currencies and sovereign debt into hard assets like gold amid concerns over swelling U.S. budget deficits and a prolonged federal government shutdown. The debasement narrative has gained traction as political dysfunction in Washington deepens, and confidence in fiscal discipline erodes.

          Trade War Escalation Sparks Safe-Haven Demand

          Geopolitical factors have added further fuel to gold’s rise. President Donald Trump’s declaration this week that the U.S. is “now in a full-scale trade war with China” has reignited fears of a prolonged global economic downturn. Tensions have mounted ahead of the anticipated APEC summit, where Trump is scheduled to meet Chinese President Xi Jinping.
          Though Treasury Secretary Scott Bessent has hinted at a potential pause in further tariffs, market participants remain cautious, interpreting the rhetoric as a sign of deeper decoupling between the world’s two largest economies.
          These developments have driven investors to reallocate capital toward perceived safe-haven assets. ANZ analysts Soni Kumari and Daniel Hynes revised their gold forecast upward, projecting prices to reach $4,400 by year-end and potentially $4,600 by June 2026, citing persistent macro and geopolitical instability.

          Liquidity Squeeze in Silver Market Adds Fuel

          Silver markets have also responded with notable volatility. A tightening supply in London has sparked a global scramble for physical metal, with spot prices in some instances surpassing futures benchmarks in New York. Silver touched a record above $53 per ounce, and though it traded flat on Thursday, demand fundamentals remain tight.
          This dislocation between physical and futures markets indicates that structural issues not just speculation are driving the rally in silver. Meanwhile, the continued appetite for precious metals suggests that portfolio hedging, rather than short-term positioning, is increasingly in play.

          Gold Reclaims Its Role as Strategic Hedge

          Gold’s meteoric rise is not merely a reaction to temporary headlines. Instead, it signals a broad re-pricing of risk in a world where central bank independence is under pressure, political unpredictability is growing, and geopolitical fragmentation is accelerating. As institutional and retail investors look to hedge against inflation, policy errors, and systemic shocks, gold is being reasserted not only as a haven, but also as a core strategic asset.
          With central banks continuing to accumulate gold and global trade frameworks in flux, the current rally may represent a paradigm shift one where gold once again becomes a dominant store of value in an increasingly unstable global economy.

          Source: Bloomberg

          To stay updated on all economic events of today, please check out our Economic calendar
          Risk Warnings and Disclaimers
          You understand and acknowledge that there is a high degree of risk involved in trading. Following any strategies or investment methods may lead to potential losses. The content on the site is provided by our contributors and analysts for information purposes only. You are solely responsible for determining whether any trading assets, securities, strategy, or any other product is suitable for investing based on your own investment objectives and financial situation.
          Add to Favorites
          Share

          Trump Declares ‘Full-Scale Trade War’ with China Ahead of APEC Summit

          Gerik

          Economic

          China–U.S. Trade War

          From Tariff Tensions to Full-Scale Trade War

          On October 16, President Donald Trump openly declared that the trade conflict between the United States and China has escalated into a “full-scale trade war.” When asked whether the U.S. risked entering a prolonged trade standoff if no agreement was reached at the upcoming meeting with Xi Jinping in South Korea, Trump responded firmly: “We’re already in it.” He emphasized the imposition of 100% tariffs on Chinese goods, saying, “If we didn’t have tariffs, we’d be nothing.”
          This aggressive tone, delivered just two weeks before the APEC summit in Seoul on October 31, casts doubt on the likelihood of a diplomatic breakthrough. With both nations hardening their positions, expectations for any meaningful de-escalation appear increasingly slim.

          Tit-for-Tat: Soybeans and Cooking Oil in Crossfire

          Trump’s remarks came shortly after the U.S. announced a ban on cooking oil imports from China, in retaliation for Beijing’s removal of American soybeans from its import list. On Truth Social, Trump labeled China’s move “an act of economic hostility.”
          China had been the largest buyer of American soybeans, but following U.S. tariff hikes in April, Beijing shifted its sourcing to Argentina and Brazil. This strategic pivot was interpreted as direct retaliation, severely impacting U.S. agricultural exporters. According to the American Soybean Association, the Chinese market represented a significant portion of U.S. export volumes until mid-2023.

          Rare Earths as Strategic Leverage

          On October 10, China escalated the trade conflict further by restricting rare earth exports a category of minerals essential to U.S. industries, from defense systems to electronics. In the 2020–2023 period, China accounted for 70% of U.S. rare earth imports. These restrictions mark a strategic move to disrupt U.S. supply chains, especially in sectors that rely on rare earth magnets and precision components.
          This move ignited what many analysts are calling “Phase Two” of the trade war, following Washington’s earlier retaliatory tariffs on goods from multiple countries, including China. In response, Trump announced that tariffs on Chinese goods would rise from the current 30% to 100% starting November 1, effectively nullifying the temporary truce agreed in August that delayed three-digit tariffs for 90 days.
          High Stakes at the APEC Summit
          Trump and Xi are scheduled to meet during the Asia-Pacific Economic Cooperation (APEC) summit in Seoul. However, the timing of Trump’s declaration suggests a hardened pre-negotiation posture, rather than a conciliatory tone. While the APEC meeting presents an opportunity for diplomatic engagement, Trump's recent actions suggest the summit may become a high-stakes political showdown rather than a platform for compromise.
          Economic analysts caution that escalating tariff threats and restrictions on critical imports could further destabilize global markets and choke vital trade flows. With global supply chains already under strain, additional disruptions especially in commodities like soybeans and rare earths risk sending shockwaves through both industrial production and commodity pricing.

          Trade Frictions Enter Strategic Phase

          Trump’s declaration of a full-scale trade war marks a turning point in U.S.-China relations. No longer limited to tariffs, the confrontation now encompasses agricultural exports, raw materials, and political signaling at the highest levels. As both nations weaponize economic tools in pursuit of national interests, the likelihood of durable decoupling in key sectors particularly technology and defense continues to grow.
          The upcoming Trump-Xi meeting at APEC could either pause this escalation or deepen it further. Regardless of the outcome, the global trading system appears to be entering a phase defined more by political rivalry than by market liberalism. In this environment, multinational businesses must navigate growing unpredictability and rising economic nationalism.

          Source: USA Today

          To stay updated on all economic events of today, please check out our Economic calendar
          Risk Warnings and Disclaimers
          You understand and acknowledge that there is a high degree of risk involved in trading. Following any strategies or investment methods may lead to potential losses. The content on the site is provided by our contributors and analysts for information purposes only. You are solely responsible for determining whether any trading assets, securities, strategy, or any other product is suitable for investing based on your own investment objectives and financial situation.
          Add to Favorites
          Share

          Ten Year Gold Price Chart: Long-Term Trends and Investment Insights

          Winkelmann

          Commodity

          Ten Year Gold Price Chart Explained: What a Decade of Data Reveals

          The Ten Year Gold Price Chart reveals how global events, inflation, and interest rates shaped gold’s value from 2015 to 2025. By studying decade-long price movements, investors can identify key trends, understand market cycles, and make more informed decisions about long-term portfolio diversification.

          Part 1: Overview of the Ten-Year Gold Price Chart (2015–2025)

          Gold has experienced dramatic swings over the past decade, shaped by global economic cycles, inflation fears, and shifting interest rates. The gold price chart last 10 years highlights how major geopolitical events — from trade wars and the pandemic to rising central bank demand — have influenced investor sentiment and market direction.

          Ten Year Gold Price Chart: Long-Term Trends and Investment Insights_1

          Key Milestones in the Decade

          • 2015–2016: Gold prices stabilized after a multi-year decline as markets anticipated U.S. rate hikes.
          • 2018–2020: Escalating trade tensions and global uncertainty fueled a strong rally.
          • 2020–2021: The pandemic drove gold to record highs above $2,000 per ounce.
          • 2022–2023: Inflation and aggressive tightening triggered volatility but preserved gold’s role as a hedge.
          • 2024–2025: Prices plateaued as investors balanced inflation cooling with steady demand from central banks.

          What the Ten-Year Gold Price Chart Tells Investors

          The decade-long pattern shows that gold remains a reliable store of value during crises and a portfolio diversifier when equity markets face turbulence. Studying the gold price chart last 10 years helps investors understand how macroeconomic shifts, monetary policy, and global sentiment align to drive long-term performance.

          Key takeaways:

          • Gold thrives in low confidence, high inflation periods.
          • Long-term charts reveal cyclical peaks every 4–5 years.
          • Combining historical analysis with current trends can improve entry timing for strategic investment

          Part 2: How to Read the Ten-Year Gold Price Chart

          Understanding the Ten-Year Gold Price Chart requires more than just tracking numbers — it means interpreting the economic, political, and financial forces that shape gold’s long-term trajectory. Below are the key factors driving gold prices and the practical steps to analyze the trend over the past decade.

          1. Key Factors Influencing Gold Prices

          Several macroeconomic and market dynamics determine how gold performs over time. When reading the gold price chart last 10 years, investors should pay attention to the following factors:

          ① Interest Rates and Gold Prices

          Gold typically moves in the opposite direction of interest rates. When rates fall or remain low, the opportunity cost of holding gold decreases — boosting demand and prices. Conversely, higher rates strengthen bonds and currencies, often pressuring gold.

          Ten Year Gold Price Chart: Long-Term Trends and Investment Insights_2

          Interest Rate vs Gold Price Chart (2015–2025)

          ② Inflation and Purchasing Power

          Gold is a classic hedge against inflation. During periods of rising consumer prices, investors turn to gold to preserve value. The inflation vs gold price chart over the past decade shows that gold tends to rally when inflation expectations surge. Overlay chart comparing CPI (Consumer Price Index) with gold price trends

          Ten Year Gold Price Chart: Long-Term Trends and Investment Insights_3

          ③ U.S. Dollar Strength

          A strong dollar often suppresses gold prices since the metal is priced in USD. When the dollar weakens, foreign investors can buy gold more cheaply, fueling demand.

          ④ Geopolitical & Financial Uncertainty

          Events such as wars, trade disputes, and financial crises trigger “safe-haven” buying. Each major global shock — from Brexit to the 2020 pandemic — has left visible spikes on the chart for gold prices for 10 years.

          ⑤ Central Bank and Institutional Demand

          Central banks diversifying away from the dollar, along with ETF inflows, have supported long-term demand. A sustained increase in global gold reserves is often a bullish indicator.

          2. Steps to Read the Ten-Year Gold Price Chart

          To interpret the Ten-Year Gold Price Chart (2015–2025) effectively, follow these analytical steps:

          Step 1. Identify Major Phases

          Mark the key cycles:

          • 2015–2018: Sideways consolidation after the 2011–2013 correction.
          • 2020: Sharp rally amid global uncertainty and record-low rates.
          • 2022–2024: Volatility driven by inflation peaks and aggressive rate hikes.

          Step 2. Observe Long-Term Trend Direction

          Look at whether each successive high and low is rising or falling.

          • Higher highs/lows → bullish decade-long trend.
          • Lower highs/lows → long-term correction phase.

          Step 3. Correlate with Macroeconomic Indicators

          Compare gold’s movement with interest rates, inflation, and USD strength.

          • When inflation rises faster than yields, gold usually strengthens.
          • When real interest rates (inflation-adjusted) are negative, gold demand increases.

          Step 4. Identify Key Support and Resistance Levels

          Mark price zones where gold repeatedly bounces (support) or struggles to break higher (resistance) — such as $1,200, $1,800, and $2,050. Breakouts beyond these levels often signal major market shifts.

          Step 5. Analyze Volume and Momentum Indicators

          Use moving averages (50-day, 200-day) and RSI or MACD to confirm trend strength. A crossover of short-term averages above long-term lines often indicates renewed bullish sentiment.

          Part 3: How to Track the Gold Price Chart in Real Time

          Monitoring the gold price chart in real time is crucial for investors who want to link short-term price action with long-term performance. By combining a live feed with the 10 year gold price chart, traders gain both context and precision — understanding whether today’s movement fits within a decade-long trend or signals a potential reversal.

          1. Why Real-Time Tracking Matters

          Gold prices respond instantly to shifts in global interest rates, inflation expectations, and geopolitical risk. A real-time view complements the 10 year chart of gold prices, revealing how intraday fluctuations fit into broader market cycles.

          Real-time tracking helps investors:

          • React quickly to central-bank announcements or CPI releases.
          • Compare trends against long-term benchmarks to confirm or reject major breakout points.
          • Measure sentiment through live volume, volatility, and correlation with the dollar index or bond yields.

          2. Best Platforms to Track Live Gold Prices

          Modern tools make following both real-time data and long-term charts effortless:

          • TradingView: Offers side-by-side analysis of the 10 year gold price chart with live candles and custom indicators.
          • Investing.com: Features streaming gold quotes and interactive comparison of daily moves with historical highs and lows.
          • MarketWatch / Bloomberg: Provide institutional-grade feeds, macro commentary, and downloadable data from the 10 year chart of gold prices.
          • FastBull or FRED: Allow overlays of macro variables such as interest-rate trends or inflation indexes for deeper correlation analysis.

          3. How to Analyze Real-Time Data Effectively

          When viewing live gold charts, integrate them with the 10 year gold price chart to separate noise from trend:

          • Align timeframes: Use 1-hour or 4-hour charts for timing but confirm direction on weekly or monthly data.
          • Watch volume and volatility: Sharp spikes can confirm genuine breakouts or warn of speculative bursts.
          • Track key levels: Compare live prices with long-term support and resistance from the 10 year chart of gold prices.
          • Monitor macroeconomic links: Overlay interest-rate changes and inflation indicators to see why gold moves, not just how.

          4. Combine Real-Time and Long-Term Perspectives

          Short-term data shows momentum; long-term charts show conviction. By merging real-time monitoring with the 10 year gold price chart, investors can distinguish temporary volatility from structural shifts — the key to smarter portfolio timing and diversification.

          FAQs about Ten Year Gold Price Chart

          1. How much has gold gone up in the past 10 years?

          Gold prices have risen roughly 60–70% over the last decade, reflecting strong demand during periods of inflation and global uncertainty.

          2. What is the gold return rate over the last 10 years?

          The average annual return has been around 5–6%, depending on inflation and interest rate trends.

          3. Is gold a good investment for the next 10 years?

          Yes — analysts view gold as a long-term hedge against inflation, currency risk, and market volatility. However, returns may vary with global economic cycles.

          Conclusion

          The Ten Year Gold Price Chart reveals how gold has evolved through changing interest rates, inflation cycles, and global events. By understanding long-term trends and tracking real-time data, investors can make informed, resilient portfolio decisions for the decade ahead.

          Risk Warnings and Disclaimers
          You understand and acknowledge that there is a high degree of risk involved in trading. Following any strategies or investment methods may lead to potential losses. The content on the site is provided by our contributors and analysts for information purposes only. You are solely responsible for determining whether any trading assets, securities, strategy, or any other product is suitable for investing based on your own investment objectives and financial situation.
          Add to Favorites
          Share

          USD Weakens Globally as Vietnam Sees Divergent Exchange Rate Trends

          Gerik

          Economic

          Forex

          State Bank of Vietnam Lowers Central Exchange Rate

          On the morning of October 16, the State Bank of Vietnam (SBV) reduced the central exchange rate between the Vietnamese dong and the US dollar to 25,109 VND/USD, a 5 VND decrease compared to the previous day. This rate sets the framework for commercial banks to list exchange rates within a ±5% band, establishing a floor of 23,854 VND/USD and a ceiling of 26,364 VND/USD.
          At the SBV’s official exchange office, the reference buying rate stood at 23,904 VND/USD, while the selling rate reached 26,314 VND/USD, reflecting a stable stance despite international volatility.

          Commercial Banks Show Minor Adjustments

          Across Vietnam’s commercial banks, the USD/VND exchange rate showed mild fluctuations. The buying rate varied, while the selling rate generally aligned with the SBV's ceiling limit.
          Vietcombank increased its buying rate by 5 VND and reduced the selling rate by 5 VND, adjusting to 26,124–26,364 VND/USD.
          BIDV posted a more notable drop, reducing its buying rate by 12 VND and the selling rate by 5 VND to 26,157–26,364 VND/USD.
          VietinBank registered the largest adjustment, cutting its buying rate by 18 VND and selling rate by 5 VND to 26,139–26,364 VND/USD.
          These movements reflect cautious realignments by banks as they respond to broader market shifts and domestic liquidity demands. Although the selling price across banks remains at the upper end of the allowable range (26,364 VND/USD), the buying rate fluctuated by 5–18 VND compared to the previous session, indicating uneven sentiment on short-term dollar demand.

          Free Market USD Price Surges

          In contrast to the banking system, the free market experienced a surge in USD prices. At 9:30 AM, the USD was traded at 27,000 VND/USD (buying) and 27,100 VND/USD (selling), a significant increase of 170 VND from the previous day. This divergence suggests speculative demand or tighter informal market supply, possibly in anticipation of global developments or domestic investment flows.
          The Dollar Index (DXY) a benchmark measuring USD strength against a basket of six major currencies including the euro, yen, and pound declined from 98.7 to 98.5 points as of 9:30 AM. This reinforces the narrative of a globally weakening greenback, amid rising uncertainty surrounding U.S. monetary and trade policy.
          Contributing factors to the dollar's decline include deepening trade tensions between the United States and China, as well as rising expectations that the U.S. Federal Reserve may cut interest rates two more times before the end of 2025. These expectations are driving investors toward safe-haven assets such as gold, thereby reducing demand for USD and applying additional downward pressure.

          Euro Strengthens Against Dong

          Meanwhile, the euro rebounded, trading on Vietnam’s free market at 31,136 VND/EUR (buying) and 31,256 VND/EUR (selling). This marked a rise of 102 VND and 72 VND respectively from the previous session, driven by eurozone resilience and a softening USD outlook.
          The Vietnamese currency market on October 16 exhibited a split personality: formal banking channels remained relatively stable and aligned with regulatory controls, while the free market surged, possibly reflecting speculative behavior or hedging against anticipated external shocks. Globally, the U.S. dollar continues to face pressure from policy uncertainty and international conflict, while domestic markets respond with caution.
          With the possibility of further Fed rate cuts and unresolved geopolitical risks, volatility in USD/VND and other currency pairs may persist, keeping market participants alert to both central bank moves and broader macroeconomic shifts.
          To stay updated on all economic events of today, please check out our Economic calendar
          Risk Warnings and Disclaimers
          You understand and acknowledge that there is a high degree of risk involved in trading. Following any strategies or investment methods may lead to potential losses. The content on the site is provided by our contributors and analysts for information purposes only. You are solely responsible for determining whether any trading assets, securities, strategy, or any other product is suitable for investing based on your own investment objectives and financial situation.
          Add to Favorites
          Share
          FastBull
          Copyright © 2025 FastBull Ltd

          728 RM B 7/F GEE LOK IND BLDG NO 34 HUNG TO RD KWUN TONG KLN HONG KONG

          TelegramInstagramTwitterfacebooklinkedin
          App Store Google Play Google Play
          Products
          Charts

          Chats

          Q&A with Experts
          Screeners
          Economic Calendar
          Data
          Tools
          Membership
          Features
          Function
          Markets
          Copy Trading
          Latest Signals
          Contests
          News
          Analysis
          24/7
          Columns
          Education
          Company
          Careers
          About Us
          Contact Us
          Advertising
          Help Center
          Feedback
          User Agreement
          Privacy Policy
          Business

          White Label

          Data API

          Web Plug-ins

          Poster Maker

          Affiliate Program

          Risk Disclosure

          The risk of loss in trading financial instruments such as stocks, FX, commodities, futures, bonds, ETFs and crypto can be substantial. You may sustain a total loss of the funds that you deposit with your broker. Therefore, you should carefully consider whether such trading is suitable for you in light of your circumstances and financial resources.

          No decision to invest should be made without thoroughly conducting due diligence by yourself or consulting with your financial advisors. Our web content might not suit you since we don't know your financial conditions and investment needs. Our financial information might have latency or contain inaccuracy, so you should be fully responsible for any of your trading and investment decisions. The company will not be responsible for your capital loss.

          Without getting permission from the website, you are not allowed to copy the website's graphics, texts, or trademarks. Intellectual property rights in the content or data incorporated into this website belong to its providers and exchange merchants.

          Not Logged In

          Log in to access more features

          FastBull Membership

          Not yet

          Purchase

          Become a signal provider
          Help Center
          Customer Service
          Dark Mode
          Price Up/Down Colors

          Log In

          Sign Up

          Position
          Layout
          Fullscreen
          Default to Chart
          The chart page opens by default when you visit fastbull.com