• Trade
  • Markets
  • Copy
  • Contests
  • News
  • 24/7
  • Calendar
  • Q&A
  • Chats
Trending
Screeners
SYMBOL
LAST
BID
ASK
HIGH
LOW
NET CHG.
%CHG.
SPREAD
SPX
S&P 500 Index
6827.42
6827.42
6827.42
6899.86
6801.80
-73.58
-1.07%
--
DJI
Dow Jones Industrial Average
48458.04
48458.04
48458.04
48886.86
48334.10
-245.98
-0.51%
--
IXIC
NASDAQ Composite Index
23195.16
23195.16
23195.16
23554.89
23094.51
-398.69
-1.69%
--
USDX
US Dollar Index
97.950
98.030
97.950
98.500
97.950
-0.370
-0.38%
--
EURUSD
Euro / US Dollar
1.17394
1.17409
1.17394
1.17496
1.17192
+0.00011
+ 0.01%
--
GBPUSD
Pound Sterling / US Dollar
1.33707
1.33732
1.33707
1.33997
1.33419
-0.00148
-0.11%
--
XAUUSD
Gold / US Dollar
4299.39
4299.39
4299.39
4353.41
4257.10
+20.10
+ 0.47%
--
WTI
Light Sweet Crude Oil
57.233
57.485
57.233
58.011
56.969
-0.408
-0.71%
--

Community Accounts

Signal Accounts
--
Profit Accounts
--
Loss Accounts
--
View More

Become a signal provider

Sell trading signals to earn additional income

View More

Guide to Copy Trading

Get started with ease and confidence

View More

Signal Accounts for Members

All Signal Accounts

Best Return
  • Best Return
  • Best P/L
  • Best MDD
Past 1W
  • Past 1W
  • Past 1M
  • Past 1Y

All Contests

  • All
  • Trump Updates
  • Recommend
  • Stocks
  • Cryptocurrencies
  • Central Banks
  • Featured News
Top News Only
Share

Norwegian Nobel Committee: Calls On The Belarusian Authorities To Release All Political Prisoners

Share

Norwegian Nobel Committee: His Freedom Is A Deeply Welcome And Long-Awaited Moment

Share

Ukraine Says It Received 114 Prisoners From Belarus

Share

USA Embassy In Lithuania: Maria Kalesnikava Is Not Going To Vilnius

Share

USA Embassy In Lithuania: Other Prisoners Are Being Sent From Belarus To Ukraine

Share

Ukraine President Zelenskiy: Five Ukrainians Released By Belarus In US-Brokered Deal

Share

USA Vilnius Embassy: USA Stands Ready For "Additional Engagement With Belarus That Advances USA Interests"

Share

USA Vilnius Embassy: Belarus, USA, Other Citizens Among The Prisoners Released Into Lithuania

Share

USA Vilnius Embassy: USA Will Continue Diplomatic Efforts To Free The Remaining Political Prisoners In Belarus

Share

USA Vilnius Embassy: Belarus Releases 123 Prisoners Following Meeting Of President Trump's Envoy Coale And Belarus President Lukashenko

Share

USA Vilnius Embassy: Masatoshi Nakanishi, Aliaksandr Syrytsa Are Among The Prisoners Released By Belarus

Share

USA Vilnius Embassy: Maria Kalesnikava And Viktor Babaryka Are Among The Prisoners Released By Belarus

Share

USA Vilnius Embassy: Nobel Peace Prize Laureate Ales Bialiatski Is Among The Prisoners Released By Belarus

Share

Belarusian Presidential Administration Telegram Channel: Lukashenko Has Pardoned 123 Prisoners As Part Of Deal With US

Share

Two Local Syrian Officials: Joint US-Syrian Military Patrol In Central Syria Came Under Fire From Unknown Assailants

Share

Israeli Military Says It Targeted 'Key Hamas Terrorist' In Gaza City

Share

Rwanda's Actions In Eastern Drc Are A Clear Violation Of Washington Accords Signed By President Trump - Secretary Of State Rubio

Share

Israeli Military Issues Evacuation Warning In Southern Lebanon Village Ahead Of Strike - Spokesperson On X

Share

Belarusian State Media Cites US Envoy Coale As Saying He Discussed Ukraine And Venezuela With Lukashenko

Share

Belarusian State Media Cites US Envoy Coale As Saying That US Removes Sanctions On Belarusian Potassium

TIME
ACT
FCST
PREV
U.K. Trade Balance Non-EU (SA) (Oct)

A:--

F: --

P: --

U.K. Trade Balance (Oct)

A:--

F: --

P: --

U.K. Services Index MoM

A:--

F: --

P: --

U.K. Construction Output MoM (SA) (Oct)

A:--

F: --

P: --

U.K. Industrial Output YoY (Oct)

A:--

F: --

P: --

U.K. Trade Balance (SA) (Oct)

A:--

F: --

P: --

U.K. Trade Balance EU (SA) (Oct)

A:--

F: --

P: --

U.K. Manufacturing Output YoY (Oct)

A:--

F: --

P: --

U.K. GDP MoM (Oct)

A:--

F: --

P: --

U.K. GDP YoY (SA) (Oct)

A:--

F: --

P: --

U.K. Industrial Output MoM (Oct)

A:--

F: --

P: --

U.K. Construction Output YoY (Oct)

A:--

F: --

P: --

France HICP Final MoM (Nov)

A:--

F: --

P: --

China, Mainland Outstanding Loans Growth YoY (Nov)

A:--

F: --

P: --

China, Mainland M2 Money Supply YoY (Nov)

A:--

F: --

P: --

China, Mainland M0 Money Supply YoY (Nov)

A:--

F: --

P: --

China, Mainland M1 Money Supply YoY (Nov)

A:--

F: --

P: --

India CPI YoY (Nov)

A:--

F: --

P: --

India Deposit Gowth YoY

A:--

F: --

P: --

Brazil Services Growth YoY (Oct)

A:--

F: --

P: --

Mexico Industrial Output YoY (Oct)

A:--

F: --

P: --

Russia Trade Balance (Oct)

A:--

F: --

P: --

Philadelphia Fed President Henry Paulson delivers a speech
Canada Building Permits MoM (SA) (Oct)

A:--

F: --

P: --

Canada Wholesale Sales YoY (Oct)

A:--

F: --

P: --

Canada Wholesale Inventory MoM (Oct)

A:--

F: --

P: --

Canada Wholesale Inventory YoY (Oct)

A:--

F: --

P: --

Canada Wholesale Sales MoM (SA) (Oct)

A:--

F: --

P: --

Germany Current Account (Not SA) (Oct)

A:--

F: --

P: --

U.S. Weekly Total Rig Count

A:--

F: --

P: --

U.S. Weekly Total Oil Rig Count

A:--

F: --

P: --

Japan Tankan Large Non-Manufacturing Diffusion Index (Q4)

--

F: --

P: --

Japan Tankan Small Manufacturing Outlook Index (Q4)

--

F: --

P: --

Japan Tankan Large Non-Manufacturing Outlook Index (Q4)

--

F: --

P: --

Japan Tankan Large Manufacturing Outlook Index (Q4)

--

F: --

P: --

Japan Tankan Small Manufacturing Diffusion Index (Q4)

--

F: --

P: --

Japan Tankan Large Manufacturing Diffusion Index (Q4)

--

F: --

P: --

Japan Tankan Large-Enterprise Capital Expenditure YoY (Q4)

--

F: --

P: --

U.K. Rightmove House Price Index YoY (Dec)

--

F: --

P: --

China, Mainland Industrial Output YoY (YTD) (Nov)

--

F: --

P: --

China, Mainland Urban Area Unemployment Rate (Nov)

--

F: --

P: --

Saudi Arabia CPI YoY (Nov)

--

F: --

P: --

Euro Zone Industrial Output YoY (Oct)

--

F: --

P: --

Euro Zone Industrial Output MoM (Oct)

--

F: --

P: --

Canada Existing Home Sales MoM (Nov)

--

F: --

P: --

Euro Zone Total Reserve Assets (Nov)

--

F: --

P: --

U.K. Inflation Rate Expectations

--

F: --

P: --

Canada National Economic Confidence Index

--

F: --

P: --

Canada New Housing Starts (Nov)

--

F: --

P: --

U.S. NY Fed Manufacturing Employment Index (Dec)

--

F: --

P: --

U.S. NY Fed Manufacturing Index (Dec)

--

F: --

P: --

Canada Core CPI YoY (Nov)

--

F: --

P: --

Canada Manufacturing Unfilled Orders MoM (Oct)

--

F: --

P: --

Canada Manufacturing New Orders MoM (Oct)

--

F: --

P: --

Canada Core CPI MoM (Nov)

--

F: --

P: --

Canada Manufacturing Inventory MoM (Oct)

--

F: --

P: --

Canada CPI YoY (Nov)

--

F: --

P: --

Canada CPI MoM (Nov)

--

F: --

P: --

Canada CPI YoY (SA) (Nov)

--

F: --

P: --

Canada Core CPI MoM (SA) (Nov)

--

F: --

P: --

Q&A with Experts
    • All
    • Chatrooms
    • Groups
    • Friends
    Connecting
    .
    .
    .
    Type here...
    Add Symbol or Code

      No matching data

      All
      Trump Updates
      Recommend
      Stocks
      Cryptocurrencies
      Central Banks
      Featured News
      • All
      • Russia-Ukraine Conflict
      • Middle East Flashpoint
      • All
      • Russia-Ukraine Conflict
      • Middle East Flashpoint

      Search
      Products

      Charts Free Forever

      Chats Q&A with Experts
      Screeners Economic Calendar Data Tools
      Membership Features
      Data Warehouse Market Trends Institutional Data Policy Rates Macro

      Market Trends

      Market Sentiment Order Book Forex Correlations

      Top Indicators

      Charts Free Forever
      Markets

      News

      News Analysis 24/7 Columns Education
      From Institutions From Analysts
      Topics Columnists

      Latest Views

      Latest Views

      Trending Topics

      Top Columnists

      Latest Update

      Signals

      Copy Rankings Latest Signals Become a signal provider AI Rating
      Contests
      Brokers

      Overview Brokers Assessment Rankings Regulators News Claims
      Broker listing Forex Brokers Comparison Tool Live Spread Comparison Scam
      Q&A Complaint Scam Alert Videos Tips to Detect Scam
      More

      Business
      Events
      Careers About Us Advertising Help Center

      White Label

      Data API

      Web Plug-ins

      Affiliate Program

      Awards Institution Evaluation IB Seminar Salon Event Exhibition
      Vietnam Thailand Singapore Dubai
      Fans Party Investment Sharing Session
      FastBull Summit BrokersView Expo
      Recent Searches
        Top Searches
          Markets
          News
          Analysis
          User
          24/7
          Economic Calendar
          Education
          Data
          • Names
          • Latest
          • Prev

          View All

          No data

          Scan to Download

          Faster Charts, Chat Faster!

          Download App
          English
          • English
          • Español
          • العربية
          • Bahasa Indonesia
          • Bahasa Melayu
          • Tiếng Việt
          • ภาษาไทย
          • Français
          • Italiano
          • Türkçe
          • Русский язык
          • 简中
          • 繁中
          Open Account
          Search
          Products
          Charts Free Forever
          Markets
          News
          Signals

          Copy Rankings Latest Signals Become a signal provider AI Rating
          Contests
          Brokers

          Overview Brokers Assessment Rankings Regulators News Claims
          Broker listing Forex Brokers Comparison Tool Live Spread Comparison Scam
          Q&A Complaint Scam Alert Videos Tips to Detect Scam
          More

          Business
          Events
          Careers About Us Advertising Help Center

          White Label

          Data API

          Web Plug-ins

          Affiliate Program

          Awards Institution Evaluation IB Seminar Salon Event Exhibition
          Vietnam Thailand Singapore Dubai
          Fans Party Investment Sharing Session
          FastBull Summit BrokersView Expo

          July 2025 UK Inflation: Price Pressures Intensify Further

          Pepperstone

          Economic

          Forex

          Summary:

          Headline CPI rose 3.8% YoY in July, the fastest pace since January last year, albeit in line with the Bank of England's latest forecasts. Those same BoE forecasts, however, foresee a further rise in inflation in the months ahead, with CPI set to peak at 4.0% YoY in September, double the MPC's target.

          Headline CPI rose 3.8% YoY in July, the fastest pace since January last year, albeit in line with the Bank of England's latest forecasts. Those same BoE forecasts, however, foresee a further rise in inflation in the months ahead, with CPI set to peak at 4.0% YoY in September, double the MPC's target.

          Measures of underlying inflation also pointed to price pressures having remained intense, and incompatible with the Bank's 2% inflation aim. Core CPI, excluding food and energy, rose 3.8% YoY last month, the fastest pace since April, while the closely-watched services CPI metric rose 5.0% on an annual basis, also the highest level since April, and above the Bank's 4.9% YoY forecast.

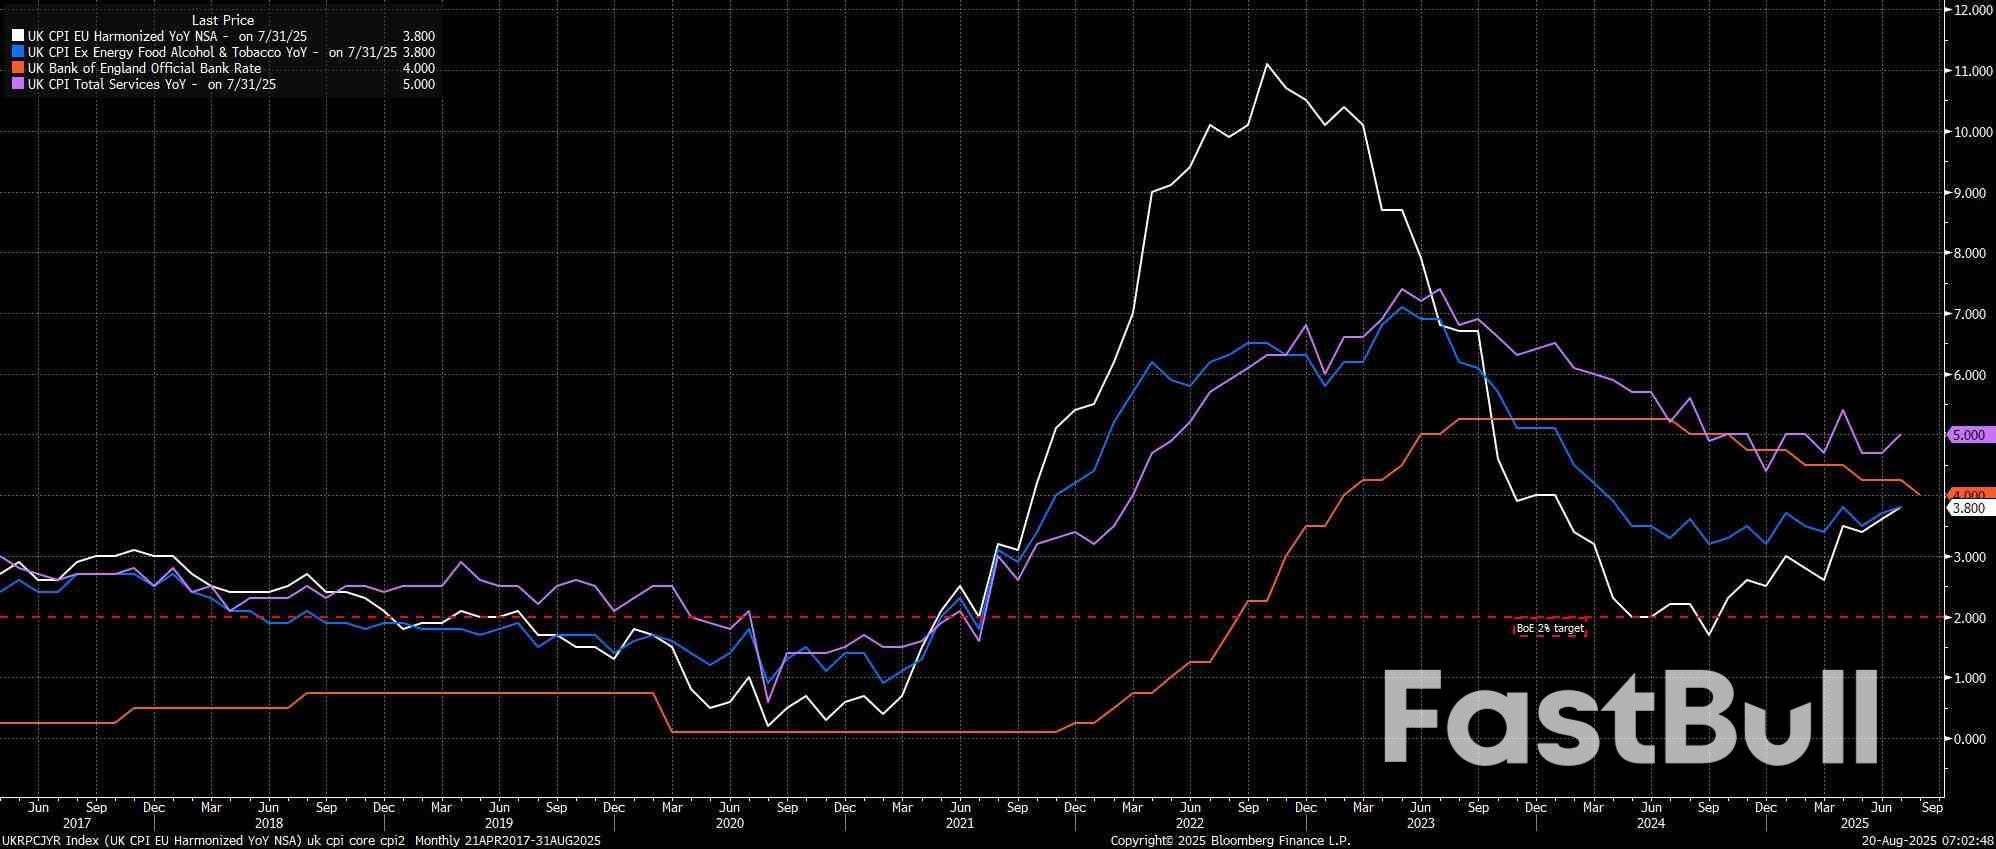
          Overall, the rise in headline prices came largely as a result of yet another chunky rise in food prices, but also by virtue of an upward impulse from consumer energy costs, with the Ofgem price cap this year seeing a much smaller drop than in July 2024, and as a result of the largest July increase in airfares since the start of the millennium. However, these one-off factors do little to allay concerns over those aforementioned underlying metrics remaining at elevated levels, though there may be some upwards skew in certain sections of the services metric, in particular, owing to the sampling having fallen in the middle of a number of major concert tours this summer.

          Frankly, though, none of this is likely to move the needle especially much for the Bank of England, with the MPC having voted in favour of a 25bp Bank Rate cut a fortnight ago, by the narrowest possible 5-4 majority.

          Today's figures are unlikely enough to persuade those 4 'hawks' that the risks of price pressures becoming embedded within the economy are subsiding in material fashion, though the next 'live' MPC meeting is now not until November, with the September meeting set to see Bank Rate held steady.

          With the MPC having retained their guidance around a 'gradual and careful' pace of easing, my base case remains that a cut will be delivered at that November confab, given the continued preference for a regular, quarterly pace of cuts if possible. That said, the bar for further policy easing is clearly now considerably higher than it was mere weeks ago, while there also remains a long way to run until that November decision, especially with the autumn Budget, and likely sizeable fiscal tightening, in the mix during this period as well.

          Source: Pepperstone

          To stay updated on all economic events of today, please check out our Economic calendar
          Risk Warnings and Disclaimers
          You understand and acknowledge that there is a high degree of risk involved in trading. Following any strategies or investment methods may lead to potential losses. The content on the site is provided by our contributors and analysts for information purposes only. You are solely responsible for determining whether any trading assets, securities, strategy, or any other product is suitable for investing based on your own investment objectives and financial situation.
          Add to Favorites
          Share

          EU prepares 19th sanctions package against Russia as conflict drags on

          Gerik

          Russia-Ukraine Conflict

          Political

          EU accelerates new sanctions plan

          European Commission Vice President Kaja Kallas announced on August 19 that the EU is preparing a fresh sanctions package against Russia, which could be finalized in September. She emphasized that the issue has been placed high on the agenda for EU foreign and defense ministers next week. The timing reflects frustration over the lack of progress in peace efforts, particularly after Russian President Vladimir Putin left the Anchorage summit with U.S. President Donald Trump and Ukrainian President Volodymyr Zelenskiy without committing to a ceasefire.
          The upcoming measures build on the EU’s 18th sanctions package, adopted on July 18. That round targeted Russia’s energy, banking, and defense industries, introducing for the first time a full ban on transactions involving the Nord Stream 1 and 2 gas pipelines. It also lowered the oil price cap from $60 to $45 per barrel, a move designed to cut deeply into Russia’s oil revenues, which account for nearly one-third of its state budget.
          Financial restrictions were tightened as well, with the EU blacklisting 22 Russian banks and threatening penalties on third-country financial institutions found to be assisting sanctions evasion. The Russian Direct Investment Fund (RDIF) was also added to the blacklist. In addition, a new €2.5 billion export ban covered machinery, metals, plastics, chemicals, and dual-use goods relevant to weapons production.

          Moscow pushes back

          The Kremlin has dismissed these measures as illegal, with spokesperson Dmitry Peskov insisting Russia has developed “a certain degree of immunity” to Western restrictions. Moscow argues that the sanctions hurt both sides, calling them a “double-edged sword” with negative repercussions for European economies as well.
          If adopted in September, the 19th package would signal the EU’s intent to keep escalating economic pressure, even as Russia demonstrates resilience. Each successive round highlights the tension between the EU’s determination to curtail Moscow’s war financing and the economic risks sanctions pose for global markets. The next measures will likely expand upon energy, banking, and export controls, with potential spillovers affecting European trade and supply chains.

          Risk Warnings and Disclaimers
          You understand and acknowledge that there is a high degree of risk involved in trading. Following any strategies or investment methods may lead to potential losses. The content on the site is provided by our contributors and analysts for information purposes only. You are solely responsible for determining whether any trading assets, securities, strategy, or any other product is suitable for investing based on your own investment objectives and financial situation.
          Add to Favorites
          Share

          Capital Flight From China Hits Record as Investors Flock to Hong Kong Assets

          Gerik

          Economic

          Record Outflows Driven by Hong Kong Purchases

          China’s State Administration of Foreign Exchange (SAFE) reported that banks transferred a net $58.3 billion abroad in July, the largest monthly outflow since records began in 2010. The bulk of these outflows were linked to mainland investors channeling funds into Hong Kong’s stock market, which has become increasingly attractive relative to domestic equities. The expansion of the Southbound Bond Connect program in July further accelerated flows into offshore bonds, providing new channels for capital allocation outside the mainland.
          This shift is causal, not coincidental: Beijing’s regulatory loosening directly enabled investors to diversify abroad, and they acted quickly to seize the opportunity amid weakening domestic conditions.

          Foreign Investors Continue to Exit Chinese Bonds

          While domestic capital sought opportunities abroad, foreign funds continued to reduce exposure to Chinese bonds. This trend stems from the relative decline in Chinese yields compared to global alternatives, particularly as risk appetite improves in other markets. The correlation between weaker domestic returns and sustained foreign bond outflows highlights China’s challenge in retaining global capital even as it seeks to internationalize the yuan.
          Analysts suggest Beijing may tolerate some degree of outflows this year, using the backdrop of a weaker U.S. dollar to advance gradual capital account liberalization. By expanding outbound quotas in June for the first time in over a year, regulators signaled an intention to encourage portfolio diversification abroad a step aligned with the long-term goal of yuan internationalization.
          Yet, the risks are twofold. While controlled liberalization supports China’s global financial ambitions, it can simultaneously undermine short-term domestic liquidity, creating a trade-off between strategic objectives and economic stability.

          Domestic Economy Shows Broad Slowdown

          The outflows coincide with fresh signs of weakness in China’s economy. Industrial output grew only 3.7% year-on-year in July, down sharply from 6.8% in June and the lowest pace since November of the previous year. Retail sales slowed to 2.5% from 3.1%, and fixed-asset investment growth in the first seven months dropped to 1.6% as the property sector’s downturn deepened. Urban unemployment also ticked higher to 5.2%.
          The causal link is evident: slowing production, weaker consumption, and property stress erode investor confidence, prompting both foreign and domestic players to reallocate capital abroad. The record capital outflow is thus not merely the product of policy easing, but also a reaction to deteriorating fundamentals at home.
          China’s record July outflows reflect the convergence of policy liberalization, investor diversification, and domestic economic strain. While Beijing may view measured capital flight as acceptable in pursuit of yuan internationalization, the sharp scale of July’s outflow signals fragility. Unless growth stabilizes and confidence returns, the risk is that what begins as controlled diversification turns into a persistent drain on domestic financial stability.
          To stay updated on all economic events of today, please check out our Economic calendar
          Risk Warnings and Disclaimers
          You understand and acknowledge that there is a high degree of risk involved in trading. Following any strategies or investment methods may lead to potential losses. The content on the site is provided by our contributors and analysts for information purposes only. You are solely responsible for determining whether any trading assets, securities, strategy, or any other product is suitable for investing based on your own investment objectives and financial situation.
          Add to Favorites
          Share

          U.S. Budget Deficit Outlook Worsens by $1 Trillion Over Next Decade, Watchdog Warns

          Gerik

          Economic

          Deficits Trend Higher Despite Short-Term Improvement

          The CRFB forecast shows a $1.7 trillion deficit in fiscal 2025, equal to 5.6% of GDP. While this is slightly lower than the $1.83 trillion deficit recorded in 2024 and below the CBO’s January projection of $1.87 trillion for 2025, deficits are set to rise steadily thereafter. By 2035, the annual shortfall is expected to reach $2.6 trillion, or 5.9% of GDP.
          The upward revision underscores how legislative and tariff changes introduced since President Donald Trump took office are shaping long-term fiscal dynamics. While the near-term decline in deficits offers a temporary reprieve, the structural trajectory points toward deeper imbalances later in the decade.

          Drivers of the Higher Deficit Outlook

          The key causal factor behind the $1 trillion increase is the One Big Beautiful Bill Act, which cuts taxes and expands spending. CRFB estimates the legislation will add $4.6 trillion to deficits through 2035, including interest costs, extending the CBO’s $4.1 trillion estimate (through 2034) by an additional year.
          Tariffs partially offset this effect, with CRFB projecting $3.4 trillion in revenue over the decade from Trump’s new import duties. However, this reliance on tariff collections introduces risk, as ongoing legal challenges could sharply reduce expected revenues.
          Other deficit-reducing measures include $100 billion in savings from tighter eligibility for health insurance subsidies and another $100 billion from rescissions in foreign aid, public broadcasting, and other programs. Yet these savings pale in comparison to the impact of large-scale tax and spending commitments.

          Net Interest Costs Balloon

          A major burden over the next decade will be interest payments on the growing national debt. CRFB projects net interest costs will total $14 trillion between 2026 and 2035, rising from just under $1 trillion (3.2% of GDP) in 2025 to $1.8 trillion (4.1% of GDP) by 2035. This reflects the compounding effect of sustained deficits and high debt levels on financing costs, making interest a leading driver of fiscal strain.
          The baseline CRFB scenario already adds $1 trillion to CBO’s January forecast, but its alternative scenario paints a far darker picture. If the Court of International Trade rules against many of Trump’s tariffs, revenue losses could reach $2.4 trillion over 10 years.
          Additional risks come from the potential extension of temporary tax breaks in the One Big Beautiful Bill Act including deductions for overtime, tips, and car loan interest, as well as full expensing of factory investments which would add $1.7 trillion in deficits. Higher-for-longer interest rates would worsen the situation further: if yields remain near 4.3% instead of falling to CBO’s 3.8% projection, interest costs alone would add $1.6 trillion.

          Debt-to-GDP Ratios Highlight Fiscal Fragility

          Under CRFB’s baseline, U.S. debt-to-GDP climbs to 120% by 2035, compared with the CBO’s January projection of 118%. Under the more pessimistic alternative scenario, debt would soar to 134% of GDP, reflecting both weaker revenue and higher borrowing costs.
          While tariffs and selective spending cuts provide short-term relief, the U.S. fiscal outlook is dominated by rising structural deficits and ballooning interest costs. CRFB’s projections highlight the trade-off between political commitments to tax cuts and spending and the long-term sustainability of federal finances. Without significant course correction, the U.S. debt burden will climb to historically high levels, amplifying risks to both economic stability and fiscal flexibility.

          Source: Reuters

          To stay updated on all economic events of today, please check out our Economic calendar
          Risk Warnings and Disclaimers
          You understand and acknowledge that there is a high degree of risk involved in trading. Following any strategies or investment methods may lead to potential losses. The content on the site is provided by our contributors and analysts for information purposes only. You are solely responsible for determining whether any trading assets, securities, strategy, or any other product is suitable for investing based on your own investment objectives and financial situation.
          Add to Favorites
          Share

          Gold At A Pivotal Level – Can Momentum Flip Higher Now?

          Samantha Luan

          Economic

          Commodity

          Forex

          Key Highlights

          ● Gold corrected gains after it failed to clear the $3,400 resistance.
          ● A major bearish trend line is forming with resistance at $3,345 on the 4-hour chart.
          ● WTI Crude Oil prices declined below the $63.20 support zone.
          ● EUR/USD is consolidating above the 1.1600 support zone.

          Gold Price Technical Analysis

          Gold prices failed to settle above $3,400 and corrected gains against the US Dollar. It declined below the $3,375 and $3,360 support levels.

          The 4-hour chart of XAU/USD indicates that the price settled below the $3,350 level, the 100 Simple Moving Average (red, 4 hours), and the 200 Simple Moving Average (green, 4 hours). There was a move below the 50% Fib retracement level of the upward move from the $3,268 swing low to the $3,408 high.

          On the downside, initial support is near the $3,320 level. It is close to the 61.8% Fib retracement level of the upward move from the $3,268 swing low to the $3,408 high.The first key support is $3,310. The next major support is near the $3,300 level. A downside break below $3,300 might call for more downsides. The next key zone to watch could be $3,280.

          On the upside, immediate resistance is near the $3,345 level. There is also a major bearish trend line forming with resistance at $3,345 on the same chart. The next major resistance sits near the $3,355 level.A clear move above $3,355 could open the doors for more upside. In the stated case, the bulls could aim for a move toward $3,400, above which the price could rally toward the milestone level of $3,450.

          Looking at WTI Crude Oil, the price shows many bearish signs and could decline further below the $62.00 support zone.

          Source: ACTIONFOREX

          To stay updated on all economic events of today, please check out our Economic calendar
          Risk Warnings and Disclaimers
          You understand and acknowledge that there is a high degree of risk involved in trading. Following any strategies or investment methods may lead to potential losses. The content on the site is provided by our contributors and analysts for information purposes only. You are solely responsible for determining whether any trading assets, securities, strategy, or any other product is suitable for investing based on your own investment objectives and financial situation.
          Add to Favorites
          Share

          China’s Rare Earth Magnet Exports Surge to Six-Month High in July on Trade Recovery

          Gerik

          Economic

          Commodity

          Strong Rebound in Rare Earth Shipments

          China, the world’s dominant supplier of rare earth magnets, recorded its highest monthly exports in six months as July shipments reached 5,577 metric tons. This marked a nearly 75% increase compared to June, according to data from the General Administration of Customs. The back-to-back monthly gains underscore a recovery in flows of critical minerals that are central to advanced manufacturing, particularly in electric vehicles (EVs) and wind turbines.
          The surge reflects the impact of the recent Sino-U.S. trade deal, which has eased restrictions and revived confidence in cross-border supply chains. The correlation here is clear: improved trade conditions have directly enabled higher export volumes, alleviating some of the bottlenecks seen earlier in the year. For industries reliant on these materials, such as automakers and renewable energy developers, the recovery in supply from China reduces near-term risks of shortages.

          Key Export Destinations Highlight Strategic Demand

          Germany, the United States, and Vietnam emerged as the top three buyers of Chinese rare earth magnets in July. This mix of destinations illustrates both strategic industrial demand in advanced economies and growing consumption in Southeast Asia. Germany’s reliance is tied to its automotive and wind power sectors, while the United States remains heavily dependent on Chinese rare earths for defense and clean energy applications. Vietnam’s rising share reflects its role as an emerging electronics and manufacturing hub, linking China’s supply to global production chains.
          July’s surge in rare earth magnet exports highlights a stabilizing trade environment after months of volatility. However, the sector remains highly sensitive to geopolitical shifts. While improved U.S.-China trade relations have supported volumes, long-term risks persist as Western nations continue efforts to diversify supply chains away from Chinese dominance. For now, China’s strong export rebound cements its critical role in the global transition toward EVs and renewable energy, even as buyers quietly weigh their strategic vulnerabilities.

          Source: Reuters

          To stay updated on all economic events of today, please check out our Economic calendar
          Risk Warnings and Disclaimers
          You understand and acknowledge that there is a high degree of risk involved in trading. Following any strategies or investment methods may lead to potential losses. The content on the site is provided by our contributors and analysts for information purposes only. You are solely responsible for determining whether any trading assets, securities, strategy, or any other product is suitable for investing based on your own investment objectives and financial situation.
          Add to Favorites
          Share

          New Zealand Cuts Rates to 3-Year Low as Growth Stalls, Signals More Easing Ahead

          Gerik

          Economic

          Policy Shift Toward Looser Settings

          The Reserve Bank of New Zealand (RBNZ) reduced its official cash rate (OCR) by 25 basis points to 3.00% on Wednesday, marking the lowest level in three years. The move, largely anticipated by economists, reflects policymakers’ increasing concern over sluggish domestic growth and mounting global uncertainties. The central bank noted that second-quarter economic activity had stalled, with policymakers debating cuts as deep as 50 basis points before settling on the more measured quarter-point reduction.
          This decision continues a trend of aggressive monetary loosening since August 2024, during which the RBNZ has delivered 250 basis points in rate cuts. The aim is to stimulate household and business activity, with confidence that inflation will remain contained within the 1–3% target range, returning to 2% in 2026.

          Market Reaction: Kiwi Dollar Slides

          Financial markets responded swiftly to the RBNZ’s dovish tone. The New Zealand dollar fell 0.8% to $0.5845, while two-year swap rates sank to 2.96%, their lowest level since early 2022. The reaction highlights the causal link between expectations for further rate cuts and weakening currency performance, as investors anticipate lower returns on New Zealand assets.
          The RBNZ emphasized that the recovery remains fragile, hampered by cautious household and business sentiment, weak global growth, and the drag from U.S. tariff policy. Domestically, unemployment is rising, adding further strain to demand. While New Zealand has emerged from last year’s recession, the rebound has been modest, with tight government fiscal policy compounding private-sector weakness.
          In its updated Monetary Policy Statement, the RBNZ projected the OCR would fall further to an average of 2.71% in Q4 2025, below its May forecast of 2.92%. For Q1 2026, the forecast dropped to 2.55%, down from 2.85%. These projections reinforce the central bank’s signal that additional easing remains on the table, conditional on inflation continuing to moderate.

          Balancing Inflation and Growth Risks

          While inflation currently sits at 2.7% within the RBNZ’s target band it is expected to edge up to 3.0% in Q3 before easing. This outlook gives the central bank some flexibility to cut further, though the balance of risks remains delicate. A sharper slowdown in domestic consumption or global trade could justify deeper easing, whereas any sustained inflationary spike from tariffs or supply disruptions would constrain policy space.
          The RBNZ’s decision underscores its priority of cushioning a vulnerable economy from both domestic and global headwinds. With inflation stable, policymakers see room to cut further, though the pace will depend on how growth and labor markets evolve in the coming quarters. For now, markets are preparing for a lower rate trajectory, weaker kiwi performance, and a monetary environment shaped more by defensive easing than by inflationary fears.

          Source: Reuters

          To stay updated on all economic events of today, please check out our Economic calendar
          Risk Warnings and Disclaimers
          You understand and acknowledge that there is a high degree of risk involved in trading. Following any strategies or investment methods may lead to potential losses. The content on the site is provided by our contributors and analysts for information purposes only. You are solely responsible for determining whether any trading assets, securities, strategy, or any other product is suitable for investing based on your own investment objectives and financial situation.
          Add to Favorites
          Share
          FastBull
          Copyright © 2025 FastBull Ltd

          728 RM B 7/F GEE LOK IND BLDG NO 34 HUNG TO RD KWUN TONG KLN HONG KONG

          TelegramInstagramTwitterfacebooklinkedin
          App Store Google Play Google Play
          Products
          Charts

          Chats

          Q&A with Experts
          Screeners
          Economic Calendar
          Data
          Tools
          Membership
          Features
          Function
          Markets
          Copy Trading
          Latest Signals
          Contests
          News
          Analysis
          24/7
          Columns
          Education
          Company
          Careers
          About Us
          Contact Us
          Advertising
          Help Center
          Feedback
          User Agreement
          Privacy Policy
          Business

          White Label

          Data API

          Web Plug-ins

          Poster Maker

          Affiliate Program

          Risk Disclosure

          The risk of loss in trading financial instruments such as stocks, FX, commodities, futures, bonds, ETFs and crypto can be substantial. You may sustain a total loss of the funds that you deposit with your broker. Therefore, you should carefully consider whether such trading is suitable for you in light of your circumstances and financial resources.

          No decision to invest should be made without thoroughly conducting due diligence by yourself or consulting with your financial advisors. Our web content might not suit you since we don't know your financial conditions and investment needs. Our financial information might have latency or contain inaccuracy, so you should be fully responsible for any of your trading and investment decisions. The company will not be responsible for your capital loss.

          Without getting permission from the website, you are not allowed to copy the website's graphics, texts, or trademarks. Intellectual property rights in the content or data incorporated into this website belong to its providers and exchange merchants.

          Not Logged In

          Log in to access more features

          FastBull Membership

          Not yet

          Purchase

          Become a signal provider
          Help Center
          Customer Service
          Dark Mode
          Price Up/Down Colors

          Log In

          Sign Up

          Position
          Layout
          Fullscreen
          Default to Chart
          The chart page opens by default when you visit fastbull.com