Markets
News
Analysis
User
24/7
Economic Calendar
Education
Data
- Names
- Latest
- Prev


Signal Accounts for Members
All Signal Accounts
All Contests


Canada Labor Force Participation Rate (SA) (Nov)A:--
F: --
P: --
U.S. Personal Income MoM (Sept)A:--
F: --
P: --
U.S. PCE Price Index YoY (SA) (Sept)A:--
F: --
P: --
U.S. PCE Price Index MoM (Sept)A:--
F: --
P: --
U.S. Personal Outlays MoM (SA) (Sept)A:--
F: --
P: --
U.S. Core PCE Price Index MoM (Sept)A:--
F: --
P: --
U.S. Core PCE Price Index YoY (Sept)A:--
F: --
P: --
U.S. UMich 5-Year-Ahead Inflation Expectations Prelim YoY (Dec)A:--
F: --
P: --
U.S. Real Personal Consumption Expenditures MoM (Sept)A:--
F: --
P: --
U.S. 5-10 Year-Ahead Inflation Expectations (Dec)A:--
F: --
P: --
U.S. UMich Current Economic Conditions Index Prelim (Dec)A:--
F: --
P: --
U.S. UMich Consumer Sentiment Index Prelim (Dec)A:--
F: --
P: --
U.S. UMich 1-Year-Ahead Inflation Expectations Prelim (Dec)A:--
F: --
P: --
U.S. UMich Consumer Expectations Index Prelim (Dec)A:--
F: --
P: --
U.S. Weekly Total Rig CountA:--
F: --
P: --
U.S. Weekly Total Oil Rig CountA:--
F: --
P: --
U.S. Unit Labor Cost Prelim (SA) (Q3)--
F: --
P: --
U.S. Consumer Credit (SA) (Oct)A:--
F: --
P: --
China, Mainland Foreign Exchange Reserves (Nov)A:--
F: --
P: --
China, Mainland Exports YoY (USD) (Nov)--
F: --
P: --
China, Mainland Imports YoY (CNH) (Nov)--
F: --
P: --
China, Mainland Imports YoY (USD) (Nov)--
F: --
P: --
China, Mainland Imports (CNH) (Nov)--
F: --
P: --
China, Mainland Trade Balance (CNH) (Nov)--
F: --
P: --
China, Mainland Exports (Nov)--
F: --
P: --
Japan Wages MoM (Oct)A:--
F: --
P: --
Japan Trade Balance (Oct)A:--
F: --
P: --
Japan Nominal GDP Revised QoQ (Q3)A:--
F: --
P: --
Japan Trade Balance (Customs Data) (SA) (Oct)A:--
F: --
P: --
Japan GDP Annualized QoQ Revised (Q3)A:--
F: --
China, Mainland Exports YoY (CNH) (Nov)--
F: --
P: --
China, Mainland Trade Balance (USD) (Nov)--
F: --
P: --
Germany Industrial Output MoM (SA) (Oct)--
F: --
P: --
Euro Zone Sentix Investor Confidence Index (Dec)--
F: --
P: --
Canada Leading Index MoM (Nov)--
F: --
P: --
Canada National Economic Confidence Index--
F: --
P: --
U.S. Dallas Fed PCE Price Index YoY (Sept)--
F: --
P: --
China, Mainland Trade Balance (USD) (Nov)--
F: --
P: --
U.S. 3-Year Note Auction Yield--
F: --
P: --
U.K. BRC Overall Retail Sales YoY (Nov)--
F: --
P: --
U.K. BRC Like-For-Like Retail Sales YoY (Nov)--
F: --
P: --
Australia Overnight (Borrowing) Key Rate--
F: --
P: --
RBA Rate Statement
RBA Press Conference
Germany Exports MoM (SA) (Oct)--
F: --
P: --
U.S. NFIB Small Business Optimism Index (SA) (Nov)--
F: --
P: --
Mexico Core CPI YoY (Nov)--
F: --
P: --
Mexico 12-Month Inflation (CPI) (Nov)--
F: --
P: --
Mexico PPI YoY (Nov)--
F: --
P: --
Mexico CPI YoY (Nov)--
F: --
P: --
U.S. Weekly Redbook Index YoY--
F: --
P: --
U.S. JOLTS Job Openings (SA) (Oct)--
F: --
P: --
China, Mainland M2 Money Supply YoY (Nov)--
F: --
P: --
China, Mainland M0 Money Supply YoY (Nov)--
F: --
P: --
China, Mainland M1 Money Supply YoY (Nov)--
F: --
P: --
U.S. EIA Short-Term Crude Production Forecast For The Next Year (Dec)--
F: --
P: --
U.S. EIA Short-Term Crude Production Forecast For The Year (Dec)--
F: --
P: --
U.S. EIA Natural Gas Production Forecast For The Next Year (Dec)--
F: --
P: --
EIA Monthly Short-Term Energy Outlook
U.S. 10-Year Note Auction Avg. Yield--
F: --
P: --
U.S. API Weekly Cushing Crude Oil Stocks--
F: --
P: --


No matching data
Latest Views
Latest Views
Trending Topics
Top Columnists
Latest Update
White Label
Data API
Web Plug-ins
Affiliate Program
View All

No data
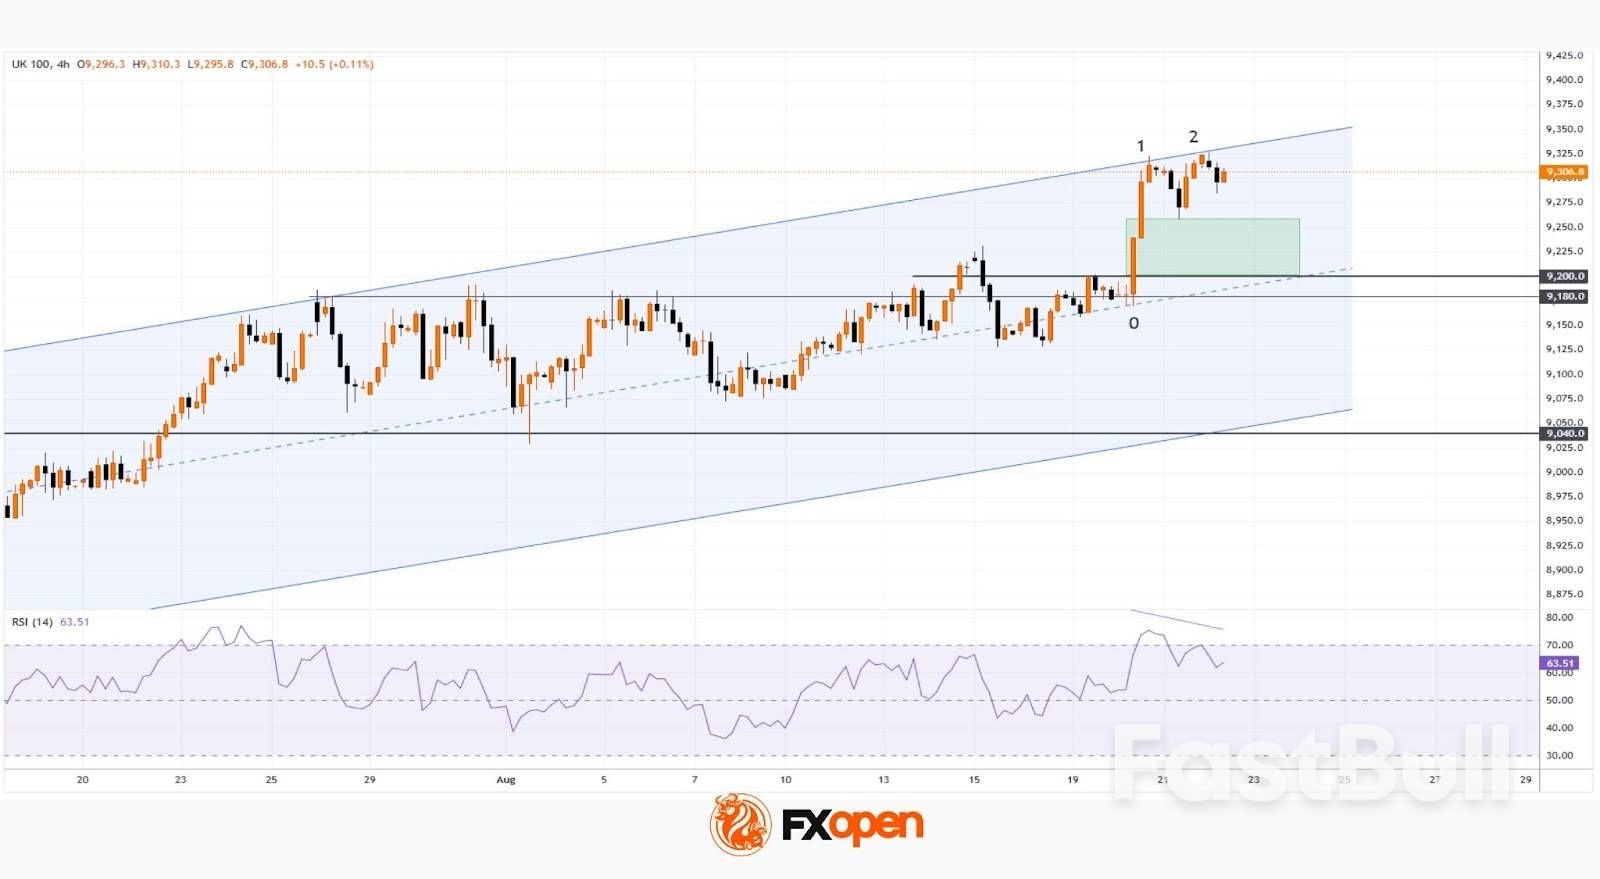
Earlier, when analysing the chart of the UK’s FTSE 100 stock index (UK 100 on FXOpen), we outlined an ascending channel and anticipated a scenario with a continued upward trend and an attempt to establish a new historical high.
Since then:
→ The index has risen by almost 5%. The channel structure has shifted slightly, but not dramatically – after adjustment, it remains relevant given the latest price dynamics.
→ Yesterday, the stock index climbed to 9,325, thereby setting an all-time high.
Bullish sentiment was supported by news of a shrinking public sector deficit and increased private sector output. How might the situation develop further?

Technical Analysis of the FTSE 100 Chart
From a bullish perspective:
→ The market remains in bullish territory.
→ The price successfully broke through the resistance zone at 9,180–9,200 (in effect since late July).
→ The 0→1 impulse was strong, signalling buyers’ dominance.
→ The price remains above the 50% Fibonacci retracement of the 0→1 impulse, which may serve as support during a pullback.
→ Additional support could come from the green zone, where bulls were strong during the breakout above the 9,180–9,200 resistance area.
From a bearish perspective: the upper boundary of the channel has confirmed its role as resistance. At the same time, peaks 1 and 2 have formed:
→ They show signs of a bearish Double Top pattern, creating bearish divergence with the RSI indicator.
→ The fact that the second peak is slightly above the first adds weight to the bearish case: this could have been a bull trap for late buyers, while in reality the rally may already be exhausted.
The ability of bulls to keep the price above the green zone may confirm the strength of the FTSE 100 (UK 100 on FXOpen). Nevertheless, in the short term, scenarios involving pullbacks and retests of the mentioned support levels might be realised (as seen in early August, when the 9,040 level was tested in an aggressive manner).
On Monday, we:
● noted that the US Dollar Index (DXY) was consolidating at the start of a week packed with key events;
● outlined a descending channel (shown in red);
● highlighted that the price was trading around the channel’s median line, signalling a balanced market;
● suggested that a test of one of the quarter lines (QL or QH), which divide the channel into four parts, could take place.
As the DXY chart indicates, since then the balance has shifted in favour of buyers, with the price forming an upward trajectory (shown in purple lines) and breaking through short-term resistance R (which has now turned into support, as marked by the blue arrow). Support line S remains relevant.
Today brings the key event that may have the greatest impact on the US Dollar Index (DXY) this week – Jerome Powell’s speech at the annual Jackson Hole Symposium.
This appearance is particularly significant because:
● it is likely to be Powell’s last speech after seven years as Fed Chair, with his term expiring in May amid ongoing tensions with President Trump;
● market participants will closely monitor the tone of his remarks, as a rate cut is expected in September, while recent economic data – namely the rise in the Producer Price Index – suggest that the US economy could face renewed inflationary pressures due to Trump’s tariffs.

Technical analysis of the DXY chart
From a bullish perspective, in the short term the US dollar is advancing within the purple channel, supported by:
● the lower boundary of this channel;
● the demand imbalance zone in favour of buyers (shown in green), confirmed by yesterday’s sharp bullish candle.
From a bearish perspective:
● the RSI has entered overbought territory;
● bullish momentum may fade after a breakout above the QH line;
● a key resistance at the 99 level lies nearby – a level that reclaimed its role as resistance at the beginning of August (indicated by black arrows).
A corrective pullback in the US Dollar Index (DXY) could happen after its rally to the highest level since 6 August. However, the further trajectory will largely depend on Powell’s words this evening. According to Forex Factory, the speech is scheduled for 17:00 GMT+3.
The Japan 225 CFD Index (a proxy of the Nikkei 225 futures) rallied as expected and hit the first resistance level of 43,560 as mentioned in our previous report. It printed a fresh intraday record high of 43,943 on Monday, 18 August.Thereafter, it staged a decline of -4% to record an intraday low of 42,330 on Friday, 22 August, before it recovered to an intraday level of 42,570 at the time of writing.Several technical elements and a fundamental factor suggest that the ongoing 5-day decline is likely a minor corrective decline within its medium-term uptrend phase rather than the start of a medium-term bearish trend.


Preferred trend bias (1-3 days)
Maintain a bullish bias with short-term pivotal support at 42,000/41,760 for the Japan 225 CFD Index, and a clearance above 43,060 sees the next intermediate resistances coming at 43,470 and 44,050/44,110 (Fibonacci extension cluster levels) (see Fig. 1).
Key elements
Alternative trend bias (1 to 3 days)
A break below the 41,760 key support invalidates the bullish recovery to see an extension of the corrective decline to expose the 41,275/41,070 medium-term support zone.
White Label
Data API
Web Plug-ins
Poster Maker
Affiliate Program
The risk of loss in trading financial instruments such as stocks, FX, commodities, futures, bonds, ETFs and crypto can be substantial. You may sustain a total loss of the funds that you deposit with your broker. Therefore, you should carefully consider whether such trading is suitable for you in light of your circumstances and financial resources.
No decision to invest should be made without thoroughly conducting due diligence by yourself or consulting with your financial advisors. Our web content might not suit you since we don't know your financial conditions and investment needs. Our financial information might have latency or contain inaccuracy, so you should be fully responsible for any of your trading and investment decisions. The company will not be responsible for your capital loss.
Without getting permission from the website, you are not allowed to copy the website's graphics, texts, or trademarks. Intellectual property rights in the content or data incorporated into this website belong to its providers and exchange merchants.
Not Logged In
Log in to access more features

FastBull Membership
Not yet
Purchase
Log In
Sign Up