• Trade
  • Markets
  • Copy
  • Contests
  • News
  • 24/7
  • Calendar
  • Q&A
  • Chats
Trending
Screeners
SYMBOL
LAST
BID
ASK
HIGH
LOW
NET CHG.
%CHG.
SPREAD
SPX
S&P 500 Index
6827.42
6827.42
6827.42
6899.86
6801.80
-73.58
-1.07%
--
DJI
Dow Jones Industrial Average
48458.04
48458.04
48458.04
48886.86
48334.10
-245.98
-0.51%
--
IXIC
NASDAQ Composite Index
23195.16
23195.16
23195.16
23554.89
23094.51
-398.69
-1.69%
--
USDX
US Dollar Index
97.950
98.030
97.950
98.500
97.950
-0.370
-0.38%
--
EURUSD
Euro / US Dollar
1.17394
1.17409
1.17394
1.17496
1.17192
+0.00011
+ 0.01%
--
GBPUSD
Pound Sterling / US Dollar
1.33707
1.33732
1.33707
1.33997
1.33419
-0.00148
-0.11%
--
XAUUSD
Gold / US Dollar
4299.39
4299.39
4299.39
4353.41
4257.10
+20.10
+ 0.47%
--
WTI
Light Sweet Crude Oil
57.233
57.485
57.233
58.011
56.969
-0.408
-0.71%
--

Community Accounts

Signal Accounts
--
Profit Accounts
--
Loss Accounts
--
View More

Become a signal provider

Sell trading signals to earn additional income

View More

Guide to Copy Trading

Get started with ease and confidence

View More

Signal Accounts for Members

All Signal Accounts

Best Return
  • Best Return
  • Best P/L
  • Best MDD
Past 1W
  • Past 1W
  • Past 1M
  • Past 1Y

All Contests

  • All
  • Trump Updates
  • Recommend
  • Stocks
  • Cryptocurrencies
  • Central Banks
  • Featured News
Top News Only
Share

Ukraine President Zelenskiy: Security Guarantees Should Be Legally Binding

Share

Ukraine President Zelenskiy: US, European Security Guarantees Instead Of NATO Membership Is Compromise From Ukraine's Side

Share

Ukraine President Zelenskiy: There Won't Be A Peace Plan That Everyone Will Like, There Will Be Compromises

Share

Ukraine President Zelenskiy: He Has Had No US Reaction Yet To Revised Peace Proposals

Share

Kremlin Says NATO's Rutte Is Irresponsible To Talk Of War With Russia

Share

Israel Foreign Minister Saar: The Australian Government, Which Has Received Countless Warning Signs, Must Come To Its Senses

Share

Israel Foreign Minister Saar: Calls For 'Globalize The Intifada' Were Realized Today

Share

Zelenskiy Demands 'Dignified' Peace As US And Ukraine Officials Meet In Berlin

Share

Australia Opposition Leader: The Loss Of Life In Bondi Beach Shooting Is Significant

Share

Russian Defence Ministry Says Russian Forces Capture Varvarivka In Ukraine's Zaporizhzhia Region

Share

Israel President Herzog: Our Sisters And Brothers In Sydney Have Been Attacked By Vile Terrorists In A Very Cruel Attack On Jews Who Went To Light The First Candle Of Hanukkahon Bondi Beach

Share

Australia Prime Minister: I Just Have Spoken To The AFP Commissioner And The Nsw Premier. We Are Working With Nsw Police And Will Provide Further Updates As More Information Is Confirmed

Share

Australia Prime Minister: The Scenes In Bondi Are Shocking And Distressing. Police And Emergency Responders Are On The Ground Working To Save Lives. My Thoughts Are With Every Person Affected

Share

Petroleum Ministry: Egypt Proposes A Unified Arab Emergency Oil And Gas Purchases Mechanism

Share

Ukraine President Zelenskiy: Services Have Been Working To Restore Electricity, Heating, Water Supply To Regions Following Russian Strikes On Energy Infrastructure

Share

Hamas Gaza Chief Confirms Killing Of The Group's Senior Commander In Israeli Strike

Share

Foreign Ministry - Iran's Foreign Minister Araqchi To Visit Russia And Belarus In Coming Week

Share

Defence Ministry: Russia Downs 235 Ukrainian Drones Overnight

Share

Trump Isn't Certain His Economic Policies Will Translate To Midterm Wins

Share

The United States And Mexico Have Reached An Agreement On How To Resolve The Water Dispute In The Rio Grande Basin (which Borders Texas). Starting December 15, Mexico Will Supply The U.S. With An Additional 20.2 Acre-feet (a Unit Of Volume For Irrigation). The Agreement Seeks To “strengthen Water Management In The Rio Grande Basin” Within The Framework Of The 1944 Water Treaty

TIME
ACT
FCST
PREV
U.K. Trade Balance (Oct)

A:--

F: --

P: --

U.K. Services Index MoM

A:--

F: --

P: --

U.K. Construction Output MoM (SA) (Oct)

A:--

F: --

P: --

U.K. Industrial Output YoY (Oct)

A:--

F: --

P: --

U.K. Trade Balance (SA) (Oct)

A:--

F: --

P: --

U.K. Trade Balance EU (SA) (Oct)

A:--

F: --

P: --

U.K. Manufacturing Output YoY (Oct)

A:--

F: --

P: --

U.K. GDP MoM (Oct)

A:--

F: --

P: --

U.K. GDP YoY (SA) (Oct)

A:--

F: --

P: --

U.K. Industrial Output MoM (Oct)

A:--

F: --

P: --

U.K. Construction Output YoY (Oct)

A:--

F: --

P: --

France HICP Final MoM (Nov)

A:--

F: --

P: --

China, Mainland Outstanding Loans Growth YoY (Nov)

A:--

F: --

P: --

China, Mainland M2 Money Supply YoY (Nov)

A:--

F: --

P: --

China, Mainland M0 Money Supply YoY (Nov)

A:--

F: --

P: --

China, Mainland M1 Money Supply YoY (Nov)

A:--

F: --

P: --

India CPI YoY (Nov)

A:--

F: --

P: --

India Deposit Gowth YoY

A:--

F: --

P: --

Brazil Services Growth YoY (Oct)

A:--

F: --

P: --

Mexico Industrial Output YoY (Oct)

A:--

F: --

P: --

Russia Trade Balance (Oct)

A:--

F: --

P: --

Philadelphia Fed President Henry Paulson delivers a speech
Canada Building Permits MoM (SA) (Oct)

A:--

F: --

P: --

Canada Wholesale Sales YoY (Oct)

A:--

F: --

P: --

Canada Wholesale Inventory MoM (Oct)

A:--

F: --

P: --

Canada Wholesale Inventory YoY (Oct)

A:--

F: --

P: --

Canada Wholesale Sales MoM (SA) (Oct)

A:--

F: --

P: --

Germany Current Account (Not SA) (Oct)

A:--

F: --

P: --

U.S. Weekly Total Rig Count

A:--

F: --

P: --

U.S. Weekly Total Oil Rig Count

A:--

F: --

P: --

Japan Tankan Large Non-Manufacturing Diffusion Index (Q4)

--

F: --

P: --

Japan Tankan Small Manufacturing Outlook Index (Q4)

--

F: --

P: --

Japan Tankan Large Non-Manufacturing Outlook Index (Q4)

--

F: --

P: --

Japan Tankan Large Manufacturing Outlook Index (Q4)

--

F: --

P: --

Japan Tankan Small Manufacturing Diffusion Index (Q4)

--

F: --

P: --

Japan Tankan Large Manufacturing Diffusion Index (Q4)

--

F: --

P: --

Japan Tankan Large-Enterprise Capital Expenditure YoY (Q4)

--

F: --

P: --

U.K. Rightmove House Price Index YoY (Dec)

--

F: --

P: --

China, Mainland Industrial Output YoY (YTD) (Nov)

--

F: --

P: --

China, Mainland Urban Area Unemployment Rate (Nov)

--

F: --

P: --

Saudi Arabia CPI YoY (Nov)

--

F: --

P: --

Euro Zone Industrial Output YoY (Oct)

--

F: --

P: --

Euro Zone Industrial Output MoM (Oct)

--

F: --

P: --

Canada Existing Home Sales MoM (Nov)

--

F: --

P: --

Euro Zone Total Reserve Assets (Nov)

--

F: --

P: --

U.K. Inflation Rate Expectations

--

F: --

P: --

Canada National Economic Confidence Index

--

F: --

P: --

Canada New Housing Starts (Nov)

--

F: --

P: --

U.S. NY Fed Manufacturing Employment Index (Dec)

--

F: --

P: --

U.S. NY Fed Manufacturing Index (Dec)

--

F: --

P: --

Canada Core CPI YoY (Nov)

--

F: --

P: --

Canada Manufacturing Unfilled Orders MoM (Oct)

--

F: --

P: --

Canada Manufacturing New Orders MoM (Oct)

--

F: --

P: --

Canada Core CPI MoM (Nov)

--

F: --

P: --

Canada Manufacturing Inventory MoM (Oct)

--

F: --

P: --

Canada CPI YoY (Nov)

--

F: --

P: --

Canada CPI MoM (Nov)

--

F: --

P: --

Canada CPI YoY (SA) (Nov)

--

F: --

P: --

Canada Core CPI MoM (SA) (Nov)

--

F: --

P: --

Canada CPI MoM (SA) (Nov)

--

F: --

P: --

Q&A with Experts
    • All
    • Chatrooms
    • Groups
    • Friends
    Connecting
    .
    .
    .
    Type here...
    Add Symbol or Code

      No matching data

      All
      Trump Updates
      Recommend
      Stocks
      Cryptocurrencies
      Central Banks
      Featured News
      • All
      • Russia-Ukraine Conflict
      • Middle East Flashpoint
      • All
      • Russia-Ukraine Conflict
      • Middle East Flashpoint

      Search
      Products

      Charts Free Forever

      Chats Q&A with Experts
      Screeners Economic Calendar Data Tools
      Membership Features
      Data Warehouse Market Trends Institutional Data Policy Rates Macro

      Market Trends

      Market Sentiment Order Book Forex Correlations

      Top Indicators

      Charts Free Forever
      Markets

      News

      News Analysis 24/7 Columns Education
      From Institutions From Analysts
      Topics Columnists

      Latest Views

      Latest Views

      Trending Topics

      Top Columnists

      Latest Update

      Signals

      Copy Rankings Latest Signals Become a signal provider AI Rating
      Contests
      Brokers

      Overview Brokers Assessment Rankings Regulators News Claims
      Broker listing Forex Brokers Comparison Tool Live Spread Comparison Scam
      Q&A Complaint Scam Alert Videos Tips to Detect Scam
      More

      Business
      Events
      Careers About Us Advertising Help Center

      White Label

      Data API

      Web Plug-ins

      Affiliate Program

      Awards Institution Evaluation IB Seminar Salon Event Exhibition
      Vietnam Thailand Singapore Dubai
      Fans Party Investment Sharing Session
      FastBull Summit BrokersView Expo
      Recent Searches
        Top Searches
          Markets
          News
          Analysis
          User
          24/7
          Economic Calendar
          Education
          Data
          • Names
          • Latest
          • Prev

          View All

          No data

          Scan to Download

          Faster Charts, Chat Faster!

          Download App
          English
          • English
          • Español
          • العربية
          • Bahasa Indonesia
          • Bahasa Melayu
          • Tiếng Việt
          • ภาษาไทย
          • Français
          • Italiano
          • Türkçe
          • Русский язык
          • 简中
          • 繁中
          Open Account
          Search
          Products
          Charts Free Forever
          Markets
          News
          Signals

          Copy Rankings Latest Signals Become a signal provider AI Rating
          Contests
          Brokers

          Overview Brokers Assessment Rankings Regulators News Claims
          Broker listing Forex Brokers Comparison Tool Live Spread Comparison Scam
          Q&A Complaint Scam Alert Videos Tips to Detect Scam
          More

          Business
          Events
          Careers About Us Advertising Help Center

          White Label

          Data API

          Web Plug-ins

          Affiliate Program

          Awards Institution Evaluation IB Seminar Salon Event Exhibition
          Vietnam Thailand Singapore Dubai
          Fans Party Investment Sharing Session
          FastBull Summit BrokersView Expo

          EUR/USD Exchange Rate Shows Increased Volatility

          FXOpen

          Economic

          Forex

          Technical Analysis

          Summary:

          On Monday, as often happens after an initial emotional reaction to major news, the price corrected as market participants reassessed prospects in light of the Fed Chair’s softened rhetoric.

          Powell’s speech on Friday had a distinctly dovish tone. Expectations of an interest rate cut strengthened, which led to a sharp weakening of the dollar — on the EUR/USD chart, a bullish impulse A→B was formed.On Monday, as often happens after an initial emotional reaction to major news, the price corrected as market participants reassessed prospects in light of the Fed Chair’s softened rhetoric.

          What is particularly notable is that the correction was most evident on the EUR/USD chart, where the decline B→C almost completely offset Friday’s surge. This could point to underlying weakness in the euro, which seems justified when considering that the euro index EXY (the euro’s performance against a basket of currencies) has risen by roughly 13% since the beginning of the year.

          The EUR/USD rate reacted less strongly to the news that President Trump had decided to dismiss Lisa Cook, a member of the Federal Reserve’s Board of Governors. While the media debates whether the President has the authority to remove her, traders may instead assess how EUR/USD could fluctuate following the A→B→C volatility swing.

          Technical Analysis of the EUR/USD Chart

          Recently, we outlined a descending channel using the sequence of lower highs and lows observed this summer. The upper boundary clearly acted as resistance for EUR/USD’s rise on Friday.

          From the bears’ perspective:

          → the price has broken downward through an ascending trajectory (shown in purple), and the lower purple line has already changed its role from support to resistance (as indicated by the arrow);

          → today’s rebound from the 1.1600 support level appears weak, as highlighted by the long upper shadow on the candlestick;

          → if this rebound is merely an interim recovery following the bearish B→C impulse, it fails to reach the 50% Fibonacci retracement level.

          In addition, the B peak only slightly exceeded the previous August high (which resembles a bull trap).

          Taking all this into account, we could assume that in the near term we may see bears attempt to break the 1.1600 support level and push EUR/USD towards the median line of the primary descending channel.

          Source: FXOpen

          To stay updated on all economic events of today, please check out our Economic calendar
          Risk Warnings and Disclaimers
          You understand and acknowledge that there is a high degree of risk involved in trading. Following any strategies or investment methods may lead to potential losses. The content on the site is provided by our contributors and analysts for information purposes only. You are solely responsible for determining whether any trading assets, securities, strategy, or any other product is suitable for investing based on your own investment objectives and financial situation.
          Add to Favorites
          Share

          AUKUS at a Crossroads: Strategic Pressure Mounts on US, UK, and Australia to Deliver

          Gerik

          Economic

          Strategic Alliance Faces a Defining Moment

          According to the Center for Strategic & International Studies (CSIS), the AUKUS partnership between the United States, United Kingdom, and Australia has reached a pivotal juncture. Launched in 2021 as a response to growing tensions in the Indo-Pacific, particularly with China’s rising assertiveness, AUKUS was hailed as a landmark defense pact. At its core, the agreement promises Australia a new fleet of eight nuclear-powered submarines, bolstered by U.S. and U.K. technology and support.
          But a recent Pentagon review, paired with delays and strategic ambiguity from Australia, has prompted questions about the agreement’s viability. CSIS analysts Abraham Denmark and Charles Edel, both former U.S. national security officials, argue that the success of AUKUS is now a “strategic imperative” for maintaining regional stability and deterring Chinese aggression.

          Timeline Gaps and Operational Uncertainty

          The partnership’s submarine timeline illustrates the complexity of execution: Australia is scheduled to begin receiving Virginia-class submarines from the U.S. in the early 2030s, followed by the joint development of the SSN-AUKUS class with the UK, with deliveries not expected until the 2040s. These extended timeframes raise concerns about AUKUS’s ability to respond to shorter-term regional threats, including those surrounding the Taiwan Strait.
          Complicating matters further is Australia’s commitment or lack thereof to the operational use of these submarines. While the U.S. seeks strategic clarity, Canberra has maintained a stance of “strategic ambiguity,” declining to specify how or if the U.S.-supplied submarines would be used in potential flashpoints such as a conflict over Taiwan. CSIS analysts recommend that the U.S. and Australia begin a formal contingency planning process, allowing for better coordinated responses and greater mutual trust.

          A Test of Allied Resolve Amid Chinese Competition

          For Washington, the stakes are high. A failure of AUKUS would not only undermine trust among Western allies but also erode the U.S. industrial base and its influence in the Indo-Pacific. CSIS emphasizes that success would go beyond deterrence it would strengthen U.S. defense manufacturing, build deeper interoperability among allies, and project a unified front in the face of Chinese military and political expansion.
          From the UK’s perspective, AUKUS offers a long-term path to maintaining relevance in Indo-Pacific affairs and reinforcing the transatlantic alliance’s global scope. For Australia, it is a once-in-a-generation investment in defense capability but one that must be matched with operational clarity and regional commitment.
          The CSIS report functions as a call to action for AUKUS members. With geopolitical tensions intensifying, particularly around Taiwan and the South China Sea, hesitation or disunity could render the alliance ineffective at a critical moment. As the timeline for submarine delivery stretches into the next two decades, the success of AUKUS will depend not just on technological cooperation, but on coordinated military planning, political will, and a shared understanding of the strategic threats that lie ahead.

          Source: Reuters

          To stay updated on all economic events of today, please check out our Economic calendar
          Risk Warnings and Disclaimers
          You understand and acknowledge that there is a high degree of risk involved in trading. Following any strategies or investment methods may lead to potential losses. The content on the site is provided by our contributors and analysts for information purposes only. You are solely responsible for determining whether any trading assets, securities, strategy, or any other product is suitable for investing based on your own investment objectives and financial situation.
          Add to Favorites
          Share

          Gold (XAU/USD) Technical: Push Up Towards Medium-Term Range Resistance Zone As Fed’s Independence Erodes

          Golden Gleam

          Commodity

          Technical Analysis

          The recent price actions of Gold (XAU/USD) have started to trade firmer since last Friday, 22 August, with a gain of 1%, on increased hopes that the US Federal Reserve is likely to enact its first interest rate cut of 2025 in the next month’s FOMC meeting.

          Fed Chair Powell’s Jackson Hole Symposium dovish speech has led traders in the Fed Funds futures market to firm up bets that the Fed is likely to cut twice in 2025 (25 basis points each), with a probability of 81% that the Fed Funds rate will be at 3.75%-4.00% on 10 December 2025 FOMC meeting at the time of writing from the current range of 4.25%-4.50%.

          Lower interest rates reduce the opportunity cost of holding gold, an asset that yields no interest, thereby boosting its appeal and increasing demand, which in turn puts upward pressure on prices.

          Safe haven bids extend gains for Gold over fears of Fed’s independence

          In today’s early Asia session, Gold (XAU/USD) shot up by 0.6% to print a current intraday high of US$3,387, a two-week high before paring gains to 0.3% intraday at the time of writing due to safe haven demand as the independence of the US Federal Reserve gets eroded over the firing of Federal Reserve Governor Lisa Cook by US President Trump.

          Let’s decipher the latest technical developments on Gold (XAU/USD)

          Fig. 1: Gold (XAU/USD) minor trend as of 26 Aug 2025 (Source: TradingView)

          Fig. 2: Gold (XAU/USD) medium-term trend as of 26 Aug 2025 (Source: TradingView)

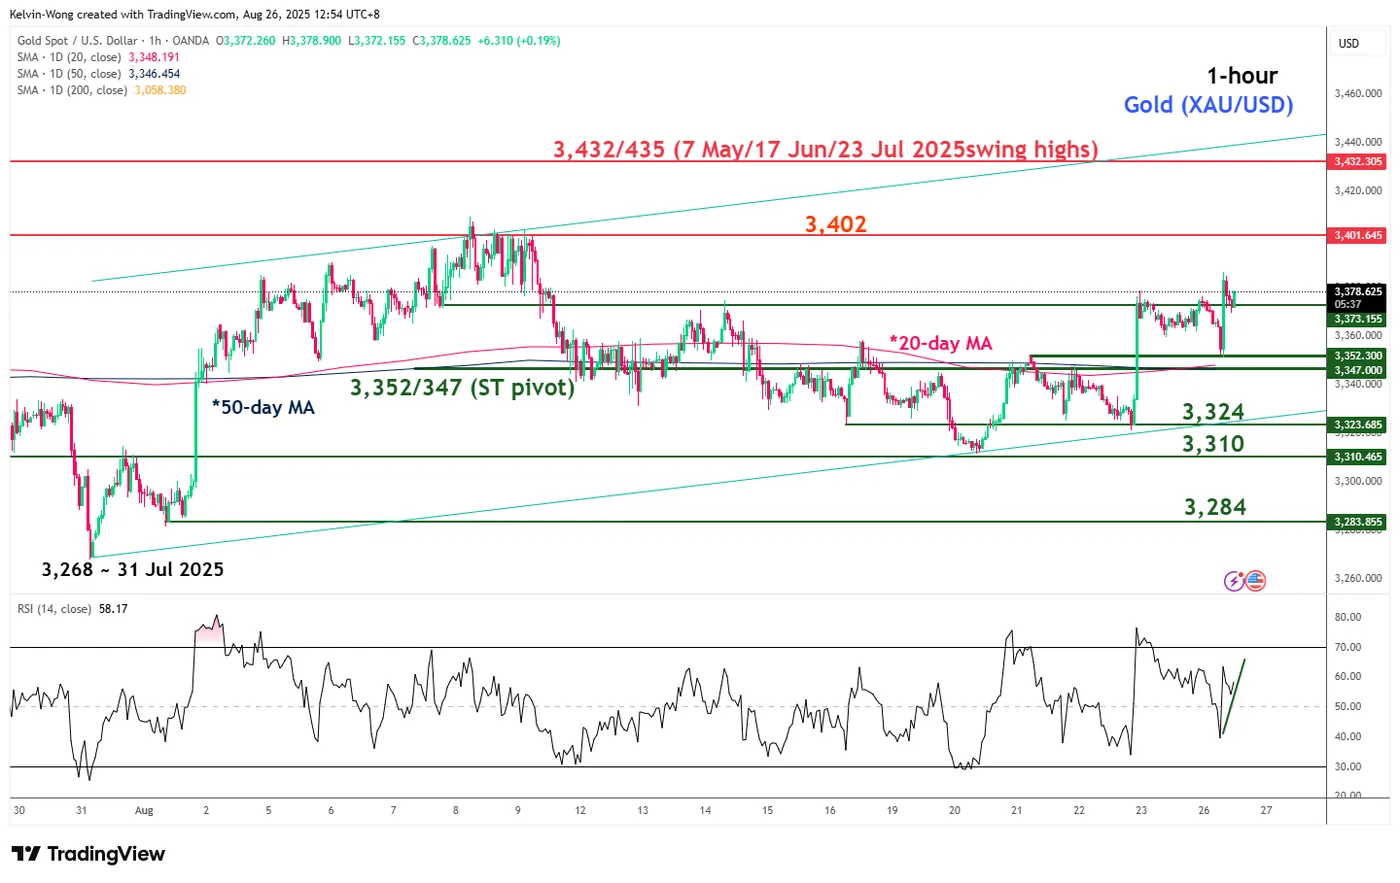
          Preferred trend bias (1-3 days)

          Bullish bias within a medium-term sideways range configuration with key short-term pivotal support at US$3,352/347, with next intermediate resistances coming in at US$3,402 and US$3,432/3,435 (see Fig. 1).

          Key elements

          • Since the current all-time high of US$3,500 printed on 22 April 2025, the price actions of Gold (XAU/USD) have evolved into a medium-term sideways range configuration (see Fig. 2).
          • The current prices of Gold (XAU/USD) have traded back above the 20-day and 50-day moving averages since last Friday, August 22, and oscillated within a minor ascending channel in place since the 31 July 2025 low of US$3,268.
          • The hourly RSI momentum indicator has displayed a “higher low” right above the 50 level and has not reached its overbought region (above the 70 level). These observations suggest a potential short-term bullish momentum condition for Gold (XAU/USD).

          Alternative trend bias (1 to 3 days)

          A break below US$3,347 on Gold (XAU/USD) invalidates the bullish bias for another round of choppy decline towards the lower limit of the medium-term sideways range configuration, exposing the next intermediate supports at US$3,324 and US$3,310 in the first step.

          Source: ACTIONFOREX

          Risk Warnings and Disclaimers
          You understand and acknowledge that there is a high degree of risk involved in trading. Following any strategies or investment methods may lead to potential losses. The content on the site is provided by our contributors and analysts for information purposes only. You are solely responsible for determining whether any trading assets, securities, strategy, or any other product is suitable for investing based on your own investment objectives and financial situation.
          Add to Favorites
          Share

          Saudi Arabia’s Humain Accelerates AI Ambitions with US Chip Imports and $10B Infrastructure Push

          Gerik

          Economic

          Humain's Data Center Plans Signal Saudi Push Into AI Leadership

          Saudi Arabia’s flagship artificial intelligence venture, Humain, has officially started construction on its first major data center sites, aiming to begin operations by early 2026. With facilities located in Riyadh and Dammam, each data center is projected to handle up to 100 megawatts of capacity. These facilities mark the first phase of a broader strategy to deliver 1.9 gigawatts of AI infrastructure across the kingdom by 2030.
          According to CEO Tareq Amin, the company has already secured local regulatory approval to purchase 18,000 of Nvidia’s latest high-performance AI chips. Procurement processes with Nvidia and other U.S. chipmakers are underway, pending formal export approvals from the U.S. government. Amin emphasized that these steps are mostly procedural, hinting at an open political channel for semiconductor transfers following a visit by U.S. President Donald Trump in May.

          Partnerships Cement Strategic Alliances with US Tech Giants

          Humain is rapidly emerging as the centerpiece of Saudi Arabia’s ambitions to dominate the AI landscape in the Middle East. The company is not only importing Nvidia chips but also forging strategic partnerships with a host of American firms including Qualcomm, Cisco Systems, and Advanced Micro Devices (AMD).
          One of the most notable collaborations is a $10 billion joint venture with AMD, which will involve the creation of a special purpose investment fund in Saudi Arabia where AMD is expected to hold equity. This partnership goes beyond just hardware it also encompasses AI infrastructure development on a national scale.
          The company is already operational in certain aspects. For instance, it has partnered with California-based Groq Inc. to develop and power its Arabic-language AI assistant, Humain Chat, which will soon expand across the Middle East after an initial rollout in the kingdom.

          A National Fund Powers Rapid Deployment of AI Infrastructure

          Launched in tandem with Trump’s visit, Humain Ventures a $10 billion investment fund tied to the AI firm has begun deploying capital to support these initiatives. While CEO Amin did not disclose the exact breakdown of current investments, the fund’s scope covers AI hardware, software, infrastructure, and strategic global partnerships.
          These developments position Saudi Arabia as a key player in the global AI race, strategically leveraging its sovereign wealth fund to bridge geopolitical divides and secure access to cutting-edge Western technology. Amin’s comments also confirmed ongoing discussions with Elon Musk’s xAI about a future data center deal in the kingdom, hinting at even broader ambitions.
          Humain’s data center initiative is not just a domestic infrastructure project it is a reflection of Saudi Arabia’s strategic alignment with the U.S. in the realm of emerging technologies. In a time when semiconductor supply chains and AI capabilities are increasingly viewed as geopolitical tools, the kingdom’s ability to work with U.S. firms like Nvidia, AMD, and Groq underlines its growing influence. As Humain scales up operations and prepares for regional expansion, the Middle East may soon witness a new AI powerhouse rising from the desert with chips, funding, and approval from Washington.

          Source: Reuters

          To stay updated on all economic events of today, please check out our Economic calendar
          Risk Warnings and Disclaimers
          You understand and acknowledge that there is a high degree of risk involved in trading. Following any strategies or investment methods may lead to potential losses. The content on the site is provided by our contributors and analysts for information purposes only. You are solely responsible for determining whether any trading assets, securities, strategy, or any other product is suitable for investing based on your own investment objectives and financial situation.
          Add to Favorites
          Share

          Dollar Rebound: Crucial Shifts Unveiling In The Forex Market Amidst Euro’s Plunge

          Winkelmann

          Forex

          Economic

          What’s Driving the Dollar Rebound?

          The United States Dollar recently demonstrated a significant resurgence, clawing back earlier losses and asserting its position in the global currency hierarchy. This Dollar rebound is not an isolated event but rather a confluence of several influential factors that reinforce its status as a safe-haven asset and a barometer of global economic health. Investors often flock to the Dollar during periods of global uncertainty, seeking its stability and liquidity.

          Key Drivers Behind the Dollar’s Strength:

          ● Economic Resilience: Recent economic data from the United States has often exceeded expectations, showcasing a robust labor market and consumer spending. This strength contrasts with slower growth observed in other major economies, making the US a more attractive investment destination.
          ● Interest Rate Differentials: The Federal Reserve’s stance on monetary policy, particularly its interest rate trajectory, plays a pivotal role. Higher interest rates in the US compared to other developed nations can attract capital inflows, increasing demand for the Dollar. The prospect of the Fed maintaining a ‘higher for longer’ rate policy, or at least delaying cuts, provides a strong tailwind for the greenback.
          ● Safe-Haven Demand: Geopolitical tensions and economic uncertainties elsewhere in the world frequently lead investors to seek refuge in the Dollar. Its deep liquidity and perceived stability make it a preferred choice during times of market stress.
          ● Technical Factors: Beyond fundamental drivers, technical analysis often reveals support levels and buying interest for the Dollar, contributing to its upward momentum after periods of consolidation or decline.

          These elements collectively paint a picture of a Dollar gaining traction, reflecting both its intrinsic economic strengths and its role as a global reserve currency. The strength of the Dollar impacts everything from commodity prices to corporate earnings, making its movements a central focus for analysts and investors worldwide.

          Why is the Euro Experiencing Significant Euro Weakness?

          While the Dollar has found its footing, the Euro has faced considerable headwinds, leading to pronounced Euro weakness against its major counterparts. This decline is not solely a reflection of Dollar strength but also stems from specific challenges within the Eurozone, particularly the unfolding political landscape in France. The single currency’s performance is intrinsically linked to the economic and political stability of its member states, and any significant tremor in a core economy like France can send ripples throughout the entire bloc.

          Factors Contributing to Euro’s Decline:

          ● Political Uncertainty in France: The primary catalyst for recent Euro weakness has been the snap parliamentary elections called in France. This unexpected political maneuver has introduced a high degree of unpredictability regarding future government policy and fiscal stability.
          ● Economic Growth Concerns: The Eurozone economy has been grappling with subdued growth, high inflation, and the lingering effects of energy price shocks. Persistent inflationary pressures, coupled with slow growth, present a challenging environment for the European Central Bank (ECB) to navigate.
          ● Monetary Policy Divergence: While the ECB has begun to consider rate cuts, the pace and extent of these cuts relative to other central banks, especially the Federal Reserve, can influence currency valuations. A more dovish stance from the ECB compared to a hawkish Fed can widen interest rate differentials, making the Euro less attractive.
          ● Geopolitical Risks: Ongoing geopolitical conflicts and their economic repercussions, particularly concerning energy supply and trade, continue to weigh on the Eurozone’s economic outlook and investor confidence.

          The combination of these factors creates a challenging environment for the Euro, making it susceptible to downward pressure. Understanding these drivers is crucial for anyone trading or investing in assets denominated in or influenced by the Euro.

          How is French Uncertainty Impacting Global Markets?

          The recent political developments in France have become a significant source of French uncertainty, casting a shadow not only over the Eurozone but also influencing broader global financial markets. The decision by President Emmanuel Macron to call snap parliamentary elections following a strong showing by the far-right in European Parliament elections has introduced a period of heightened political risk. This uncertainty is particularly potent given France’s central role as the Eurozone’s second-largest economy and a key player in European integration.

          Implications of French Political Volatility:

          AspectImpact on MarketsDescription
          Fiscal PolicyIncreased bond yields, wider spreadsConcerns about potential populist policies leading to higher government spending and increased national debt. This raises questions about France’s ability to meet EU fiscal rules.
          European Union CohesionPressure on Euro, investor jittersA shift towards more nationalistic or anti-EU policies in France could destabilize the political cohesion of the European Union, impacting its future direction and stability.
          Economic ReformsStalled progress, reduced investmentUncertainty about the government’s ability to implement necessary economic reforms could deter foreign investment and hinder economic growth prospects.
          Banking SectorStock market volatilityFrench banks, with their significant holdings of government bonds, face potential pressure if bond yields rise sharply and persistently.

          The market’s reaction to French uncertainty has been swift, with a sell-off in French government bonds and equities, and a noticeable weakening of the Euro. Investors are reassessing the risk premium associated with French assets, which in turn affects the broader Eurozone’s perceived stability. This situation underscores how domestic political events in a major economy can have far-reaching international consequences.

          Navigating the Volatile Forex Market: What Does This Mean for Investors?

          The current environment, characterized by a strengthening Dollar and a struggling Euro, creates a highly dynamic and potentially volatile Forex market. For investors, this period demands careful observation and strategic positioning. Understanding the interplay between these major currencies is not just for currency traders; it has implications for equity markets, commodity prices, and even the relative attractiveness of digital assets.

          Key Considerations for the Forex Market:

          ● Dollar’s Dominance: A stronger Dollar can make US-denominated assets more appealing, but it can also make US exports more expensive and impact the earnings of multinational corporations. For crypto, a strong Dollar can sometimes draw capital away from riskier assets, including digital currencies, as investors seek perceived safety.
          ● Euro’s Vulnerability: The Euro’s weakness presents challenges for Eurozone businesses, particularly those reliant on imports. However, it can also boost exports, making Eurozone goods more competitive internationally. The political premium on Eurozone assets may persist until clarity emerges from France.
          ● Carry Trade Opportunities: Diverging interest rate policies between central banks can create opportunities for carry trades, where investors borrow in low-interest-rate currencies and invest in high-interest-rate currencies.
          ● Impact on Commodities: Many global commodities, such as oil and gold, are priced in US Dollars. A stronger Dollar can make these commodities more expensive for buyers using other currencies, potentially dampening demand.

          The Forex market is a complex ecosystem where economic fundamentals, monetary policy, and geopolitical events constantly interact. Keeping a close watch on these drivers is essential for making informed decisions across various investment portfolios.

          Understanding Broader Currency Movements and Their Global Impact

          The current dynamics between the Dollar and the Euro are part of broader currency movements that resonate across the global economy. These shifts are not confined to a single pair but reflect a complex web of international trade, investment flows, and macroeconomic policies. The relative strength or weakness of major currencies has profound implications for global trade balances, inflation, and the overall financial stability of nations.

          Wider Repercussions of Current Currency Trends:

          ● Inflationary Pressures: For countries with weakening currencies, imports become more expensive, contributing to domestic inflation. Conversely, a strengthening currency can help dampen imported inflation.
          ● Trade Competitiveness: A weaker currency can boost a nation’s export competitiveness, making its goods and services cheaper on the global market. A strong currency can have the opposite effect, making exports more expensive.
          ● Corporate Earnings: Multinational corporations often see their earnings impacted by currency fluctuations. A strong home currency can reduce the value of foreign earnings when repatriated, while a weak home currency can boost them.
          ● Central Bank Policy: Central banks closely monitor currency movements as they can influence inflation targets and economic growth. Significant currency shifts can prompt central banks to adjust monetary policy to maintain stability.
          ● Capital Flows: Differential interest rates and economic outlooks drive capital flows across borders, directly impacting currency valuations. Regions with higher perceived returns or stability tend to attract more investment, strengthening their currency.

          These currency movements are not merely abstract numbers on a screen; they represent tangible economic forces that influence daily life, from the cost of goods to the profitability of businesses. For cryptocurrency investors, understanding these macro shifts is vital as they can indirectly affect market liquidity, risk appetite, and the broader financial environment in which digital assets operate.

          Actionable Insights for Investors: Navigating the Shifting Tides

          In a world where the Dollar is rebounding and the Euro is facing significant headwinds from French uncertainty, investors need a clear strategy. Here are some actionable insights to consider:

          ● Diversify Portfolios: Given the volatility, maintaining a diversified portfolio across different asset classes and geographies can mitigate risks. Consider exposure to various currencies, not just USD and EUR.
          ● Monitor Central Bank Communications: Pay close attention to statements from the Federal Reserve and the European Central Bank. Their guidance on interest rates and economic outlooks will continue to be primary drivers of currency movements.
          ● Assess Political Risk: Keep an eye on political developments, especially in major economies like France. Political stability is a critical factor influencing investor confidence and currency strength.
          ● Consider Hedging Strategies: For businesses or investors with significant exposure to the Euro, consider hedging strategies to protect against further downside risk.
          ● Evaluate US Economic Data: Continue to monitor US inflation, employment figures, and GDP growth. Strong data will likely reinforce the Dollar’s position.
          ● Impact on Crypto: While not directly correlated, a strong Dollar can sometimes signal a ‘risk-off’ environment, potentially leading investors to reduce exposure to more speculative assets like cryptocurrencies. Conversely, a stable or weakening Dollar could free up capital for digital assets.

          These insights provide a framework for navigating the current global financial landscape, allowing investors to make more informed decisions in response to ongoing currency movements.

          Challenges and Risks: What Could Reverse These Trends?

          While the current trends of Dollar rebound and Euro weakness appear established, the global financial landscape is constantly evolving. Several factors could emerge or intensify, potentially reversing these trajectories and introducing new challenges for the Forex market.

          Potential Reversal Triggers:

          ● Unexpected US Economic Weakness: A sudden downturn in US economic data, such as a sharp rise in unemployment or a significant slowdown in GDP growth, could diminish the Dollar’s appeal and prompt the Federal Reserve to adopt a more dovish stance, weakening the currency.
          ● Resolution of French Uncertainty: A clear and market-friendly outcome to the French elections, or a demonstration of political stability, could quickly alleviate pressure on the Euro and trigger a rebound.
          ● Shift in ECB Policy: If the European Central Bank adopts a more hawkish stance than anticipated, or if Eurozone inflation proves more persistent, it could lead to higher interest rates and support the Euro.
          ● Global Risk Appetite: A sustained improvement in global risk appetite, perhaps driven by a de-escalation of geopolitical tensions or a synchronized global economic recovery, could reduce safe-haven demand for the Dollar.
          ● Intervention from Central Banks: While rare, coordinated or unilateral central bank interventions to manage extreme currency fluctuations could significantly alter market dynamics.

          Investors must remain vigilant and adaptable, as these potential shifts could rapidly alter the prevailing trends and create new opportunities or risks within the Forex market. The interplay of economic, political, and monetary policy factors will continue to dictate the direction of major currency pairs.

          Compelling Summary: Navigating a Shifting Global Currency Landscape

          The global financial arena is currently witnessing a significant Dollar rebound, asserting its strength after earlier dips, primarily driven by robust US economic data and its enduring safe-haven appeal. In stark contrast, the Euro is experiencing pronounced Euro weakness, largely exacerbated by escalating French uncertainty stemming from snap elections and the potential for a populist government. These developments are creating substantial volatility within the Forex market, influencing everything from bond yields to commodity prices and impacting investor sentiment globally.

          Understanding these intricate currency movements is paramount for investors navigating the current economic climate. While the Dollar benefits from its perceived stability and the Federal Reserve’s cautious stance, the Euro struggles under the weight of political instability in a core member state. The implications are far-reaching, affecting trade balances, inflationary pressures, and the broader risk appetite that can indirectly influence digital asset markets. Vigilance, diversification, and a keen eye on central bank policies and geopolitical shifts are essential for making informed decisions in this evolving financial landscape. The coming weeks will be crucial in determining whether these trends consolidate or if new developments trigger a reversal, underscoring the dynamic nature of global finance.

          Source: CryptoSlate

          To stay updated on all economic events of today, please check out our Economic calendar
          Risk Warnings and Disclaimers
          You understand and acknowledge that there is a high degree of risk involved in trading. Following any strategies or investment methods may lead to potential losses. The content on the site is provided by our contributors and analysts for information purposes only. You are solely responsible for determining whether any trading assets, securities, strategy, or any other product is suitable for investing based on your own investment objectives and financial situation.
          Add to Favorites
          Share

          What Is An Inverse Fair Value Gap (IFVG) Concept In Trading?

          FXOpen

          Forex

          Cryptocurrency

          Technical Analysis

          Inverse Fair Value Gaps (IFVGs) are a fascinating concept for traders seeking to refine their understanding of price behaviour. By identifying areas where market sentiment shifts, IFVGs provide unique insights into potential reversals and key price levels. In this article, we’ll explore what IFVGs are, how they differ from Fair Value Gaps, and how traders can integrate them into their strategies for more comprehensive market analysis.

          What Is a Fair Value Gap (FVG)?

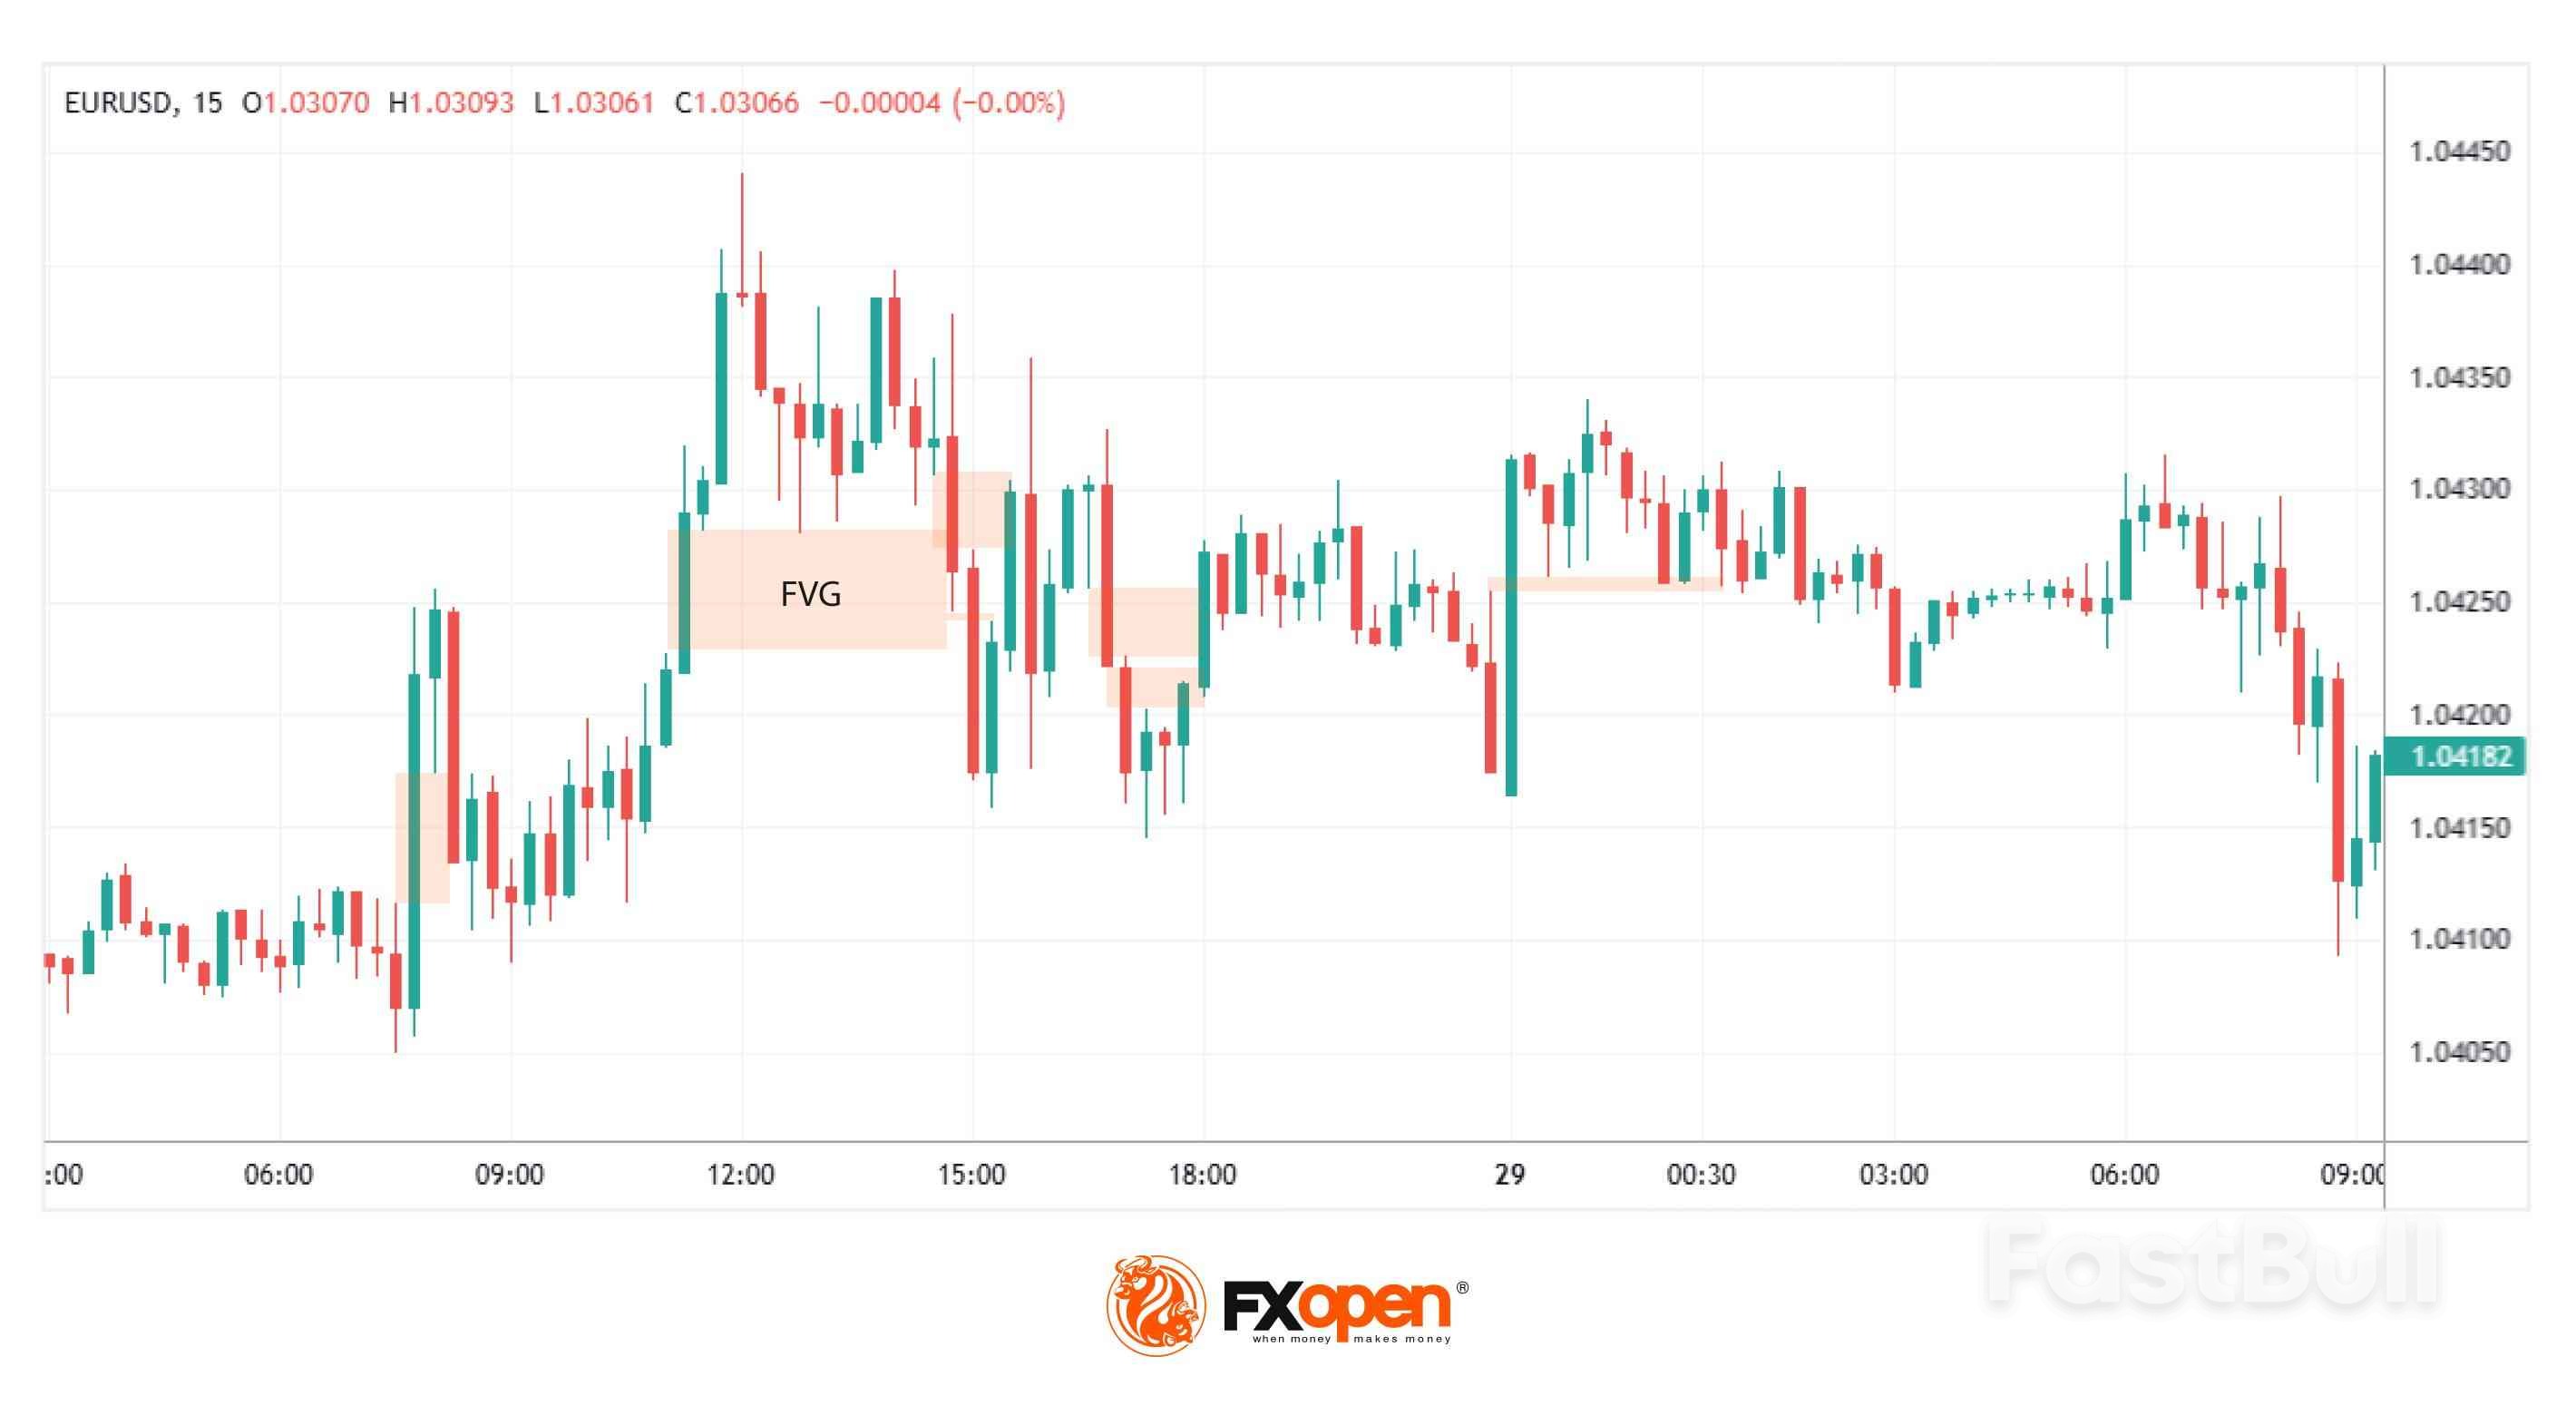
          A Fair Value Gap (FVG) occurs when the market moves so rapidly in one direction that it leaves an imbalance in price action. This imbalance shows up on a chart as a gap between three consecutive candles: the wick of the first candle and the wick of the third candle fail to overlap, leaving a “gap” created by the second candle. It essentially highlights an area where buying or selling pressure was so dominant that the market didn’t trade efficiently.

          Traders view these gaps as areas of potential interest because markets often revisit these levels to "fill" the imbalance. For example, in a bullish FVG, the gap reflects aggressive buying that outpaced selling, potentially creating a future support zone. On the other hand, bearish FVGs indicate overwhelming selling pressure, which might act as resistance later.

          FVGs are closely tied to the concept of fair value. The gap suggests the market may have deviated from a balanced state, making it an area traders watch for signs of price rebalancing. Recognising and understanding these gaps can provide insights into where the price might gravitate in the future, helping traders assess key zones of interest for analysis.

          Understanding Inverse Fair Value Gaps (IFVGs)

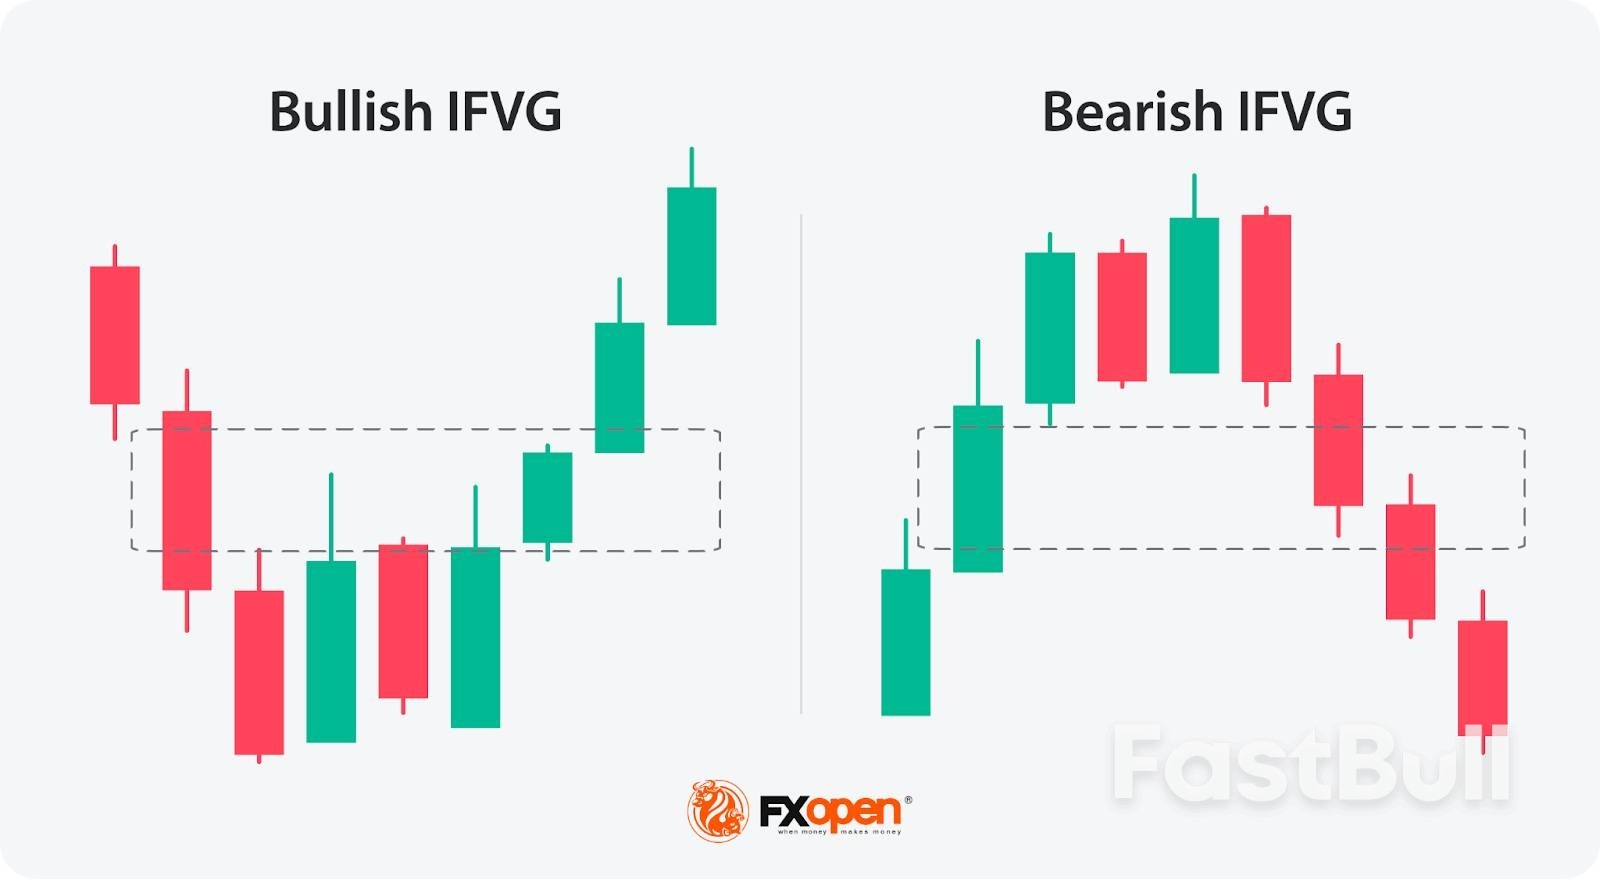
          An Inverse Fair Value Gap (IFVG), or Inversion Fair Value Gap, is an Inner Circle Trader (ICT) concept that builds on the idea of an FVG. While an FVG represents a price imbalance caused by strong directional movement, an IFVG emerges when an existing FVG is invalidated. This invalidation shifts the role of the gap, turning a bearish FVG into a bullish IFVG, or vice versa.

          Here’s how it works: a bearish FVG, for instance, forms when selling pressure dominates, leaving a gap that might act as resistance. However, if the market breaks through this gap—either with a wick or a candle close—it signals that the sellers in that zone have been overwhelmed. The bearish FVG is now invalidated and becomes a bullish IFVG, marking a potential area of support instead. The same applies in reverse for bullish FVGs becoming bearish IFVGs.

          Traders use inverted Fair Value Gaps to identify zones where market sentiment has shifted significantly. For example, when the price revisits a bullish IFVG, it may serve as a zone of interest for traders analysing potential buying opportunities. However, if the price moves past the bottom of the IFVG zone, it’s no longer valid and is typically disregarded.

          What makes these reverse FVGs particularly useful is their ability to highlight moments of structural change in the market. They can act as indicators of strength, revealing areas where price has transitioned from weakness to strength (or vice versa). By integrating IFVG analysis into their broader trading framework, traders can gain deeper insights into the evolving dynamics of supply and demand.

          Want to test your IFVG identification skills? Get started on FXOpen’s free TickTrader trading platform.

          How Traders Use IFVGs in Trading

          By integrating IFVGs into their strategy, traders can refine their decision-making process and uncover potential setups aligned with their broader market outlook. Here’s how IFVGs are commonly used:

          Identifying Key Zones of Interest

          Traders begin by spotting FVGs on price charts—areas where rapid movements create imbalances. An inversion FVG forms when such a gap is invalidated; for instance, a bearish FVG becomes bullish if the price breaks above it. These zones are then marked as potential areas of interest, indicating where the market may experience significant activity.

          Contextualising Market Sentiment

          The formation of an IFVG signals a shift in market sentiment. When a bearish FVG is invalidated and turns into a bullish IFVG, it suggests that selling pressure has diminished and buying interest is gaining momentum. Traders interpret this as a potential reversal point, providing context for the current market dynamics.

          Analysing Price Reactions

          Once an IFVG is identified, traders monitor how the price interacts with this zone. If the price revisits a bullish IFVG and shows signs of support—such as slowing down its decline or forming bullish candlestick patterns—it may indicate a strengthening upward movement. Conversely, if the price breaches the IFVG without hesitation, the anticipated reversal might not materialise.

          How Can You Trade IFVGs?

          IFVGs provide traders with a structured way to identify and analyse price levels where sentiment has shifted. The process typically looks like this:

          1. Establishing Market Bias

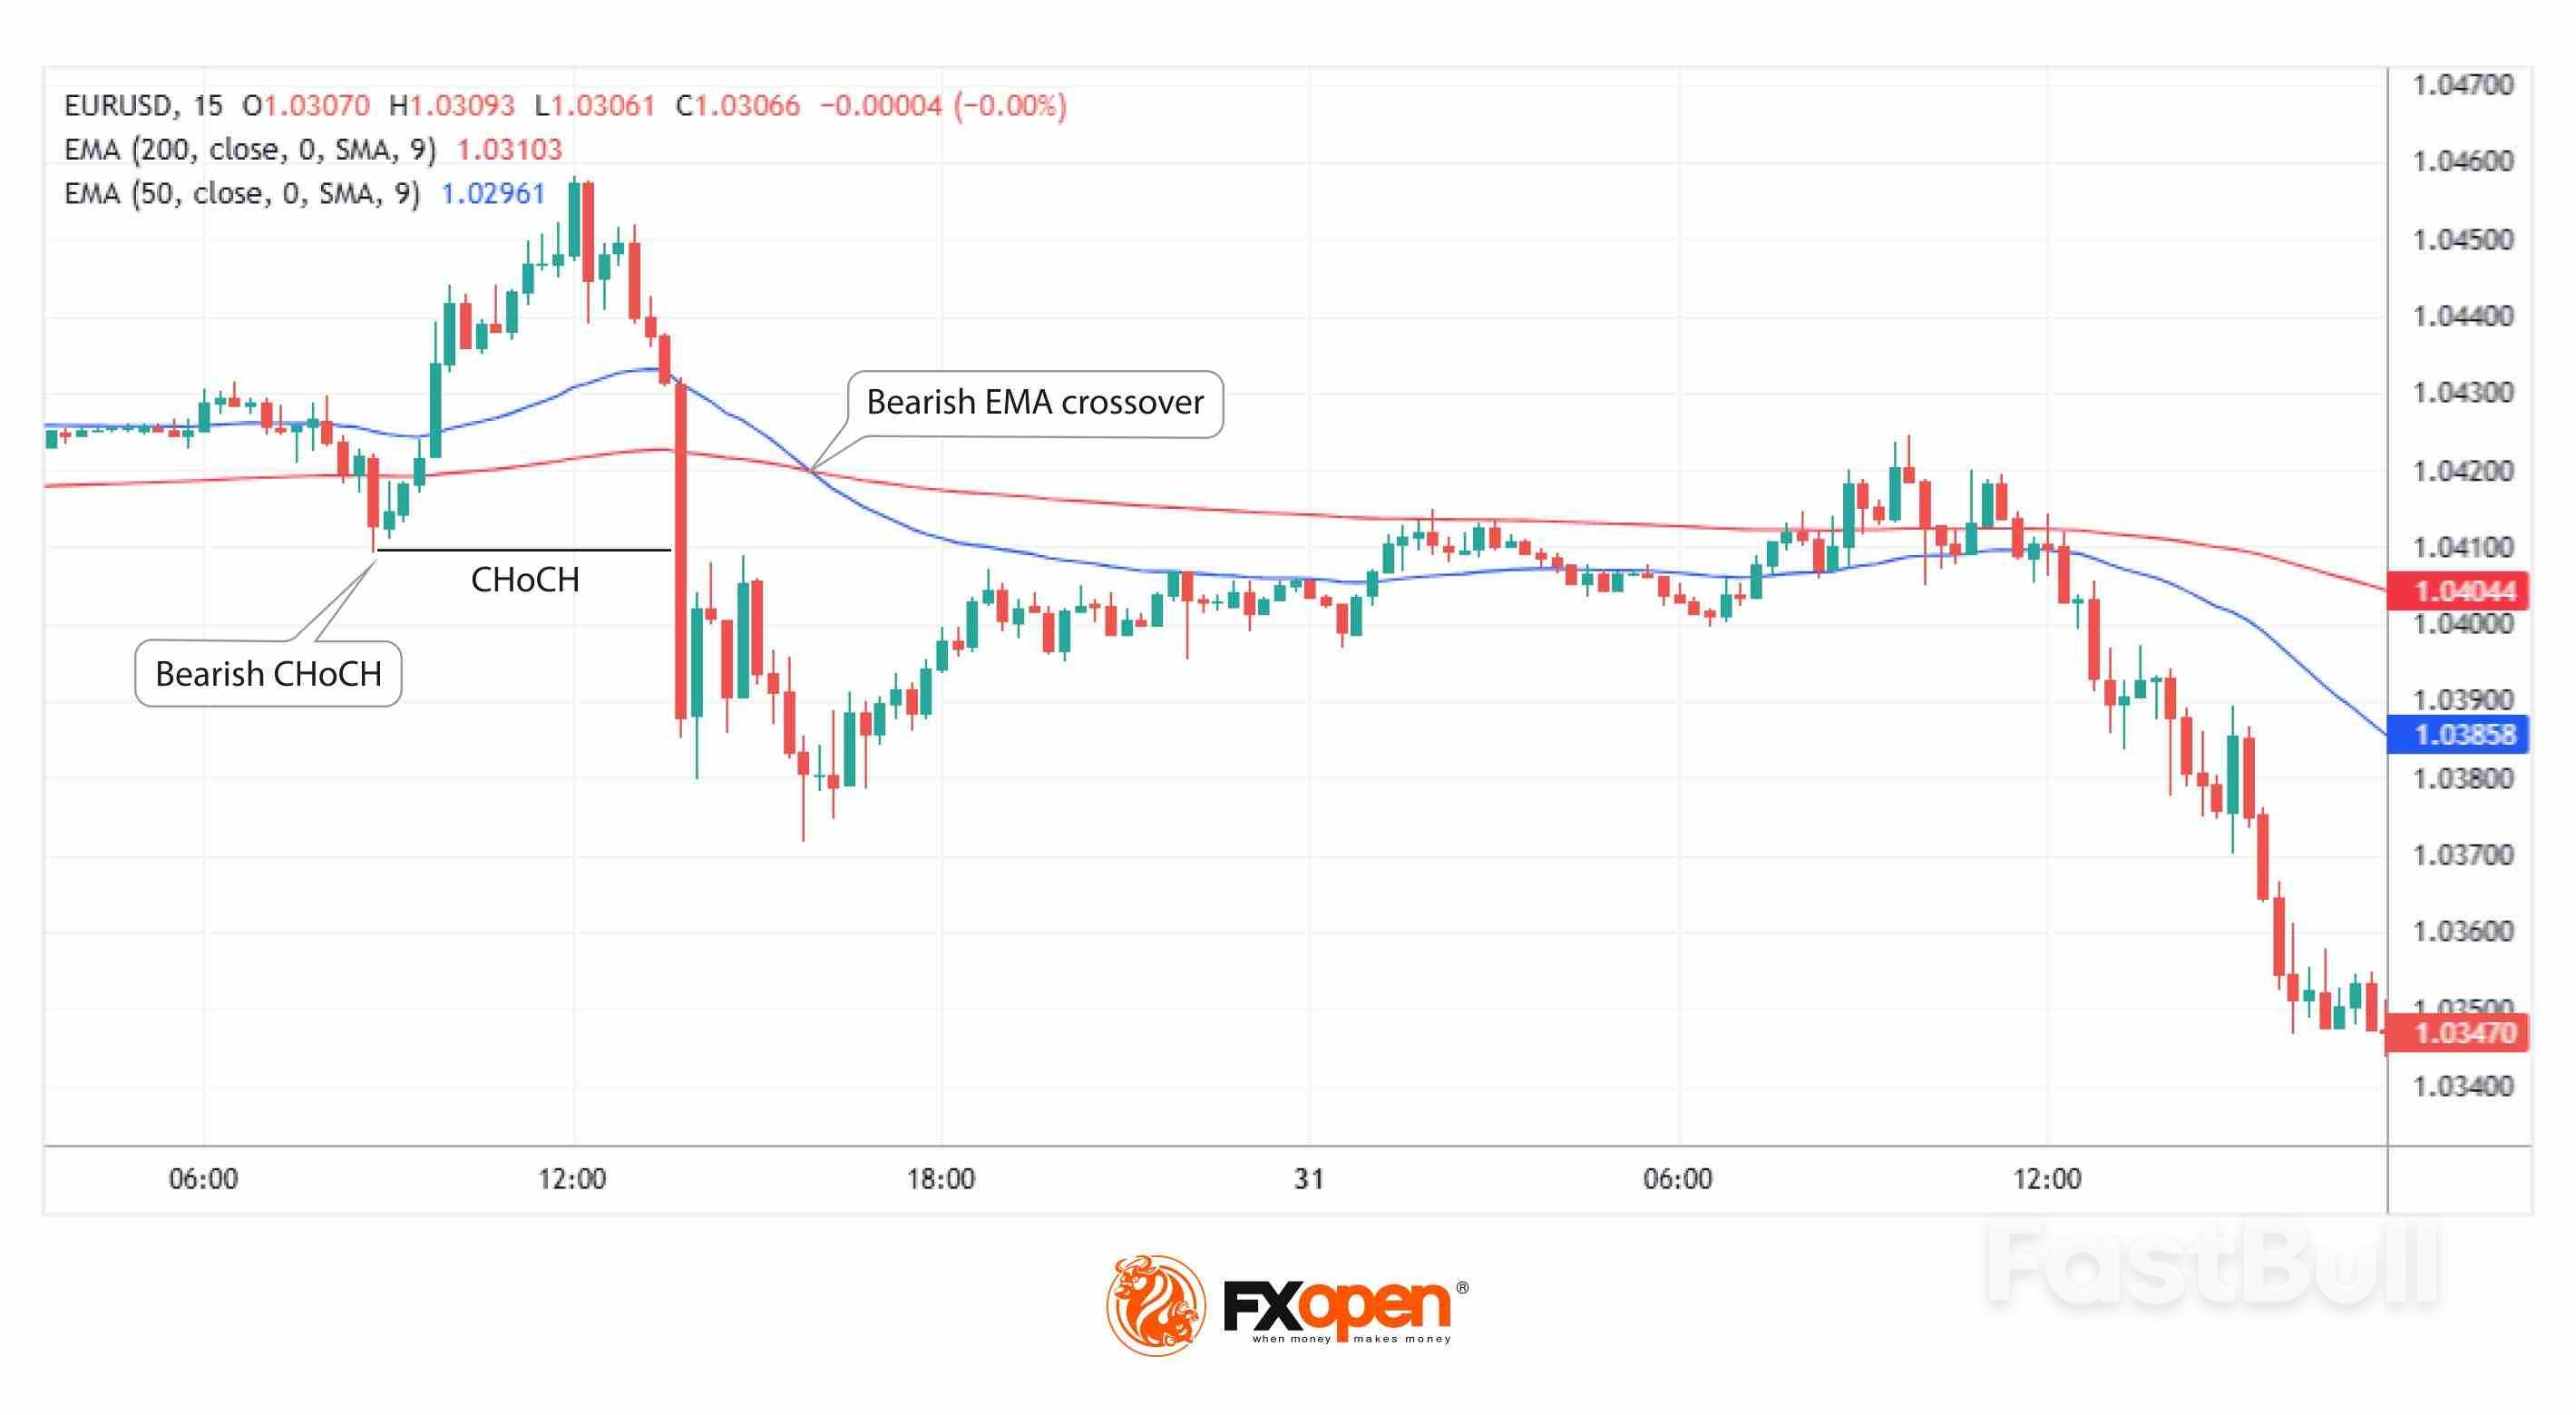
          Traders typically start by analysing the broader market direction. This often involves looking at higher timeframes, such as the daily or 4-hour charts, to identify trends or reversals. Tools like Breaks of Structure (BOS) or Changes of Character (CHoCH) within the ICT framework help clarify whether the market is leaning bullish or bearish.

          Indicators, such as moving averages or momentum oscillators, can also provide additional context for confirming directional bias. A strong bias ensures the trader is aligning setups with the dominant market flow.

          2. Identifying and Using IFVGs

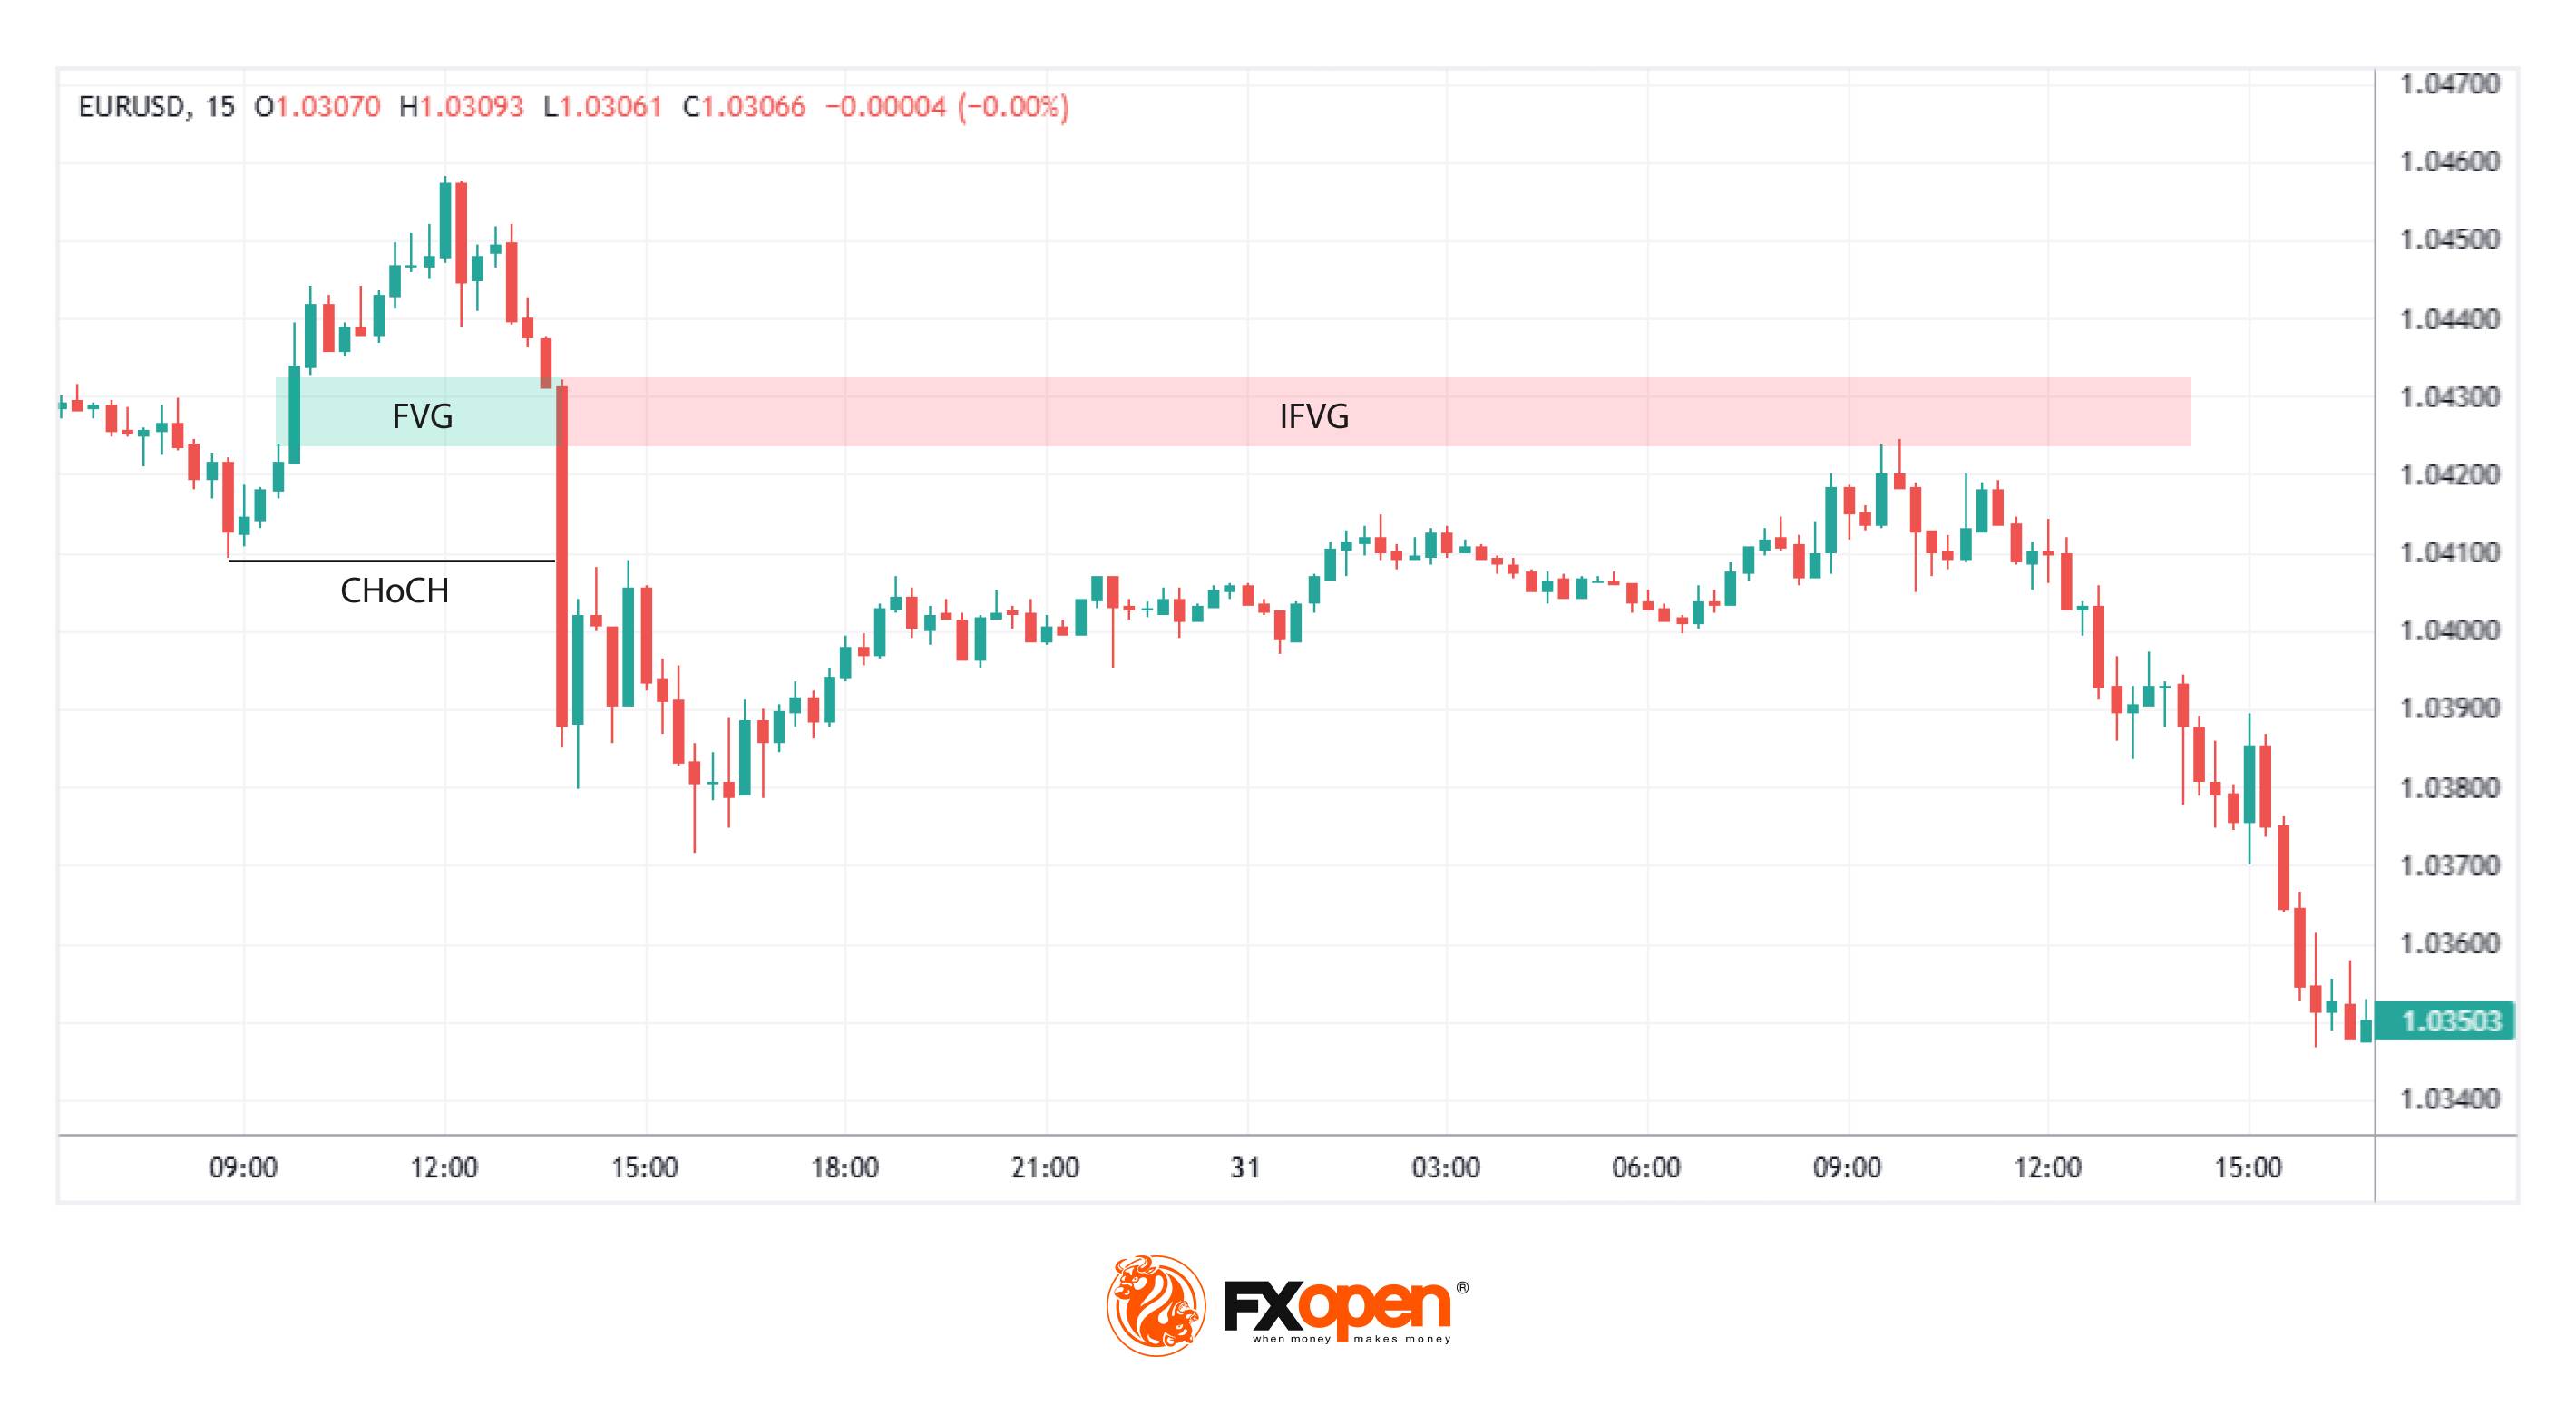
          Once a Fair Value Gap (FVG) is invalidated—indicating a significant shift in sentiment—it transforms into an Inverse Fair Value Gap (IFVG). Traders mark the IFVG zone as a key area of interest. If it aligns with their broader market bias, this zone can serve as a potential entry point. For instance, in a bearish bias, traders may focus on bearish IFVGs that act as potential resistance zones.

          3. Placing Orders and Risk Management

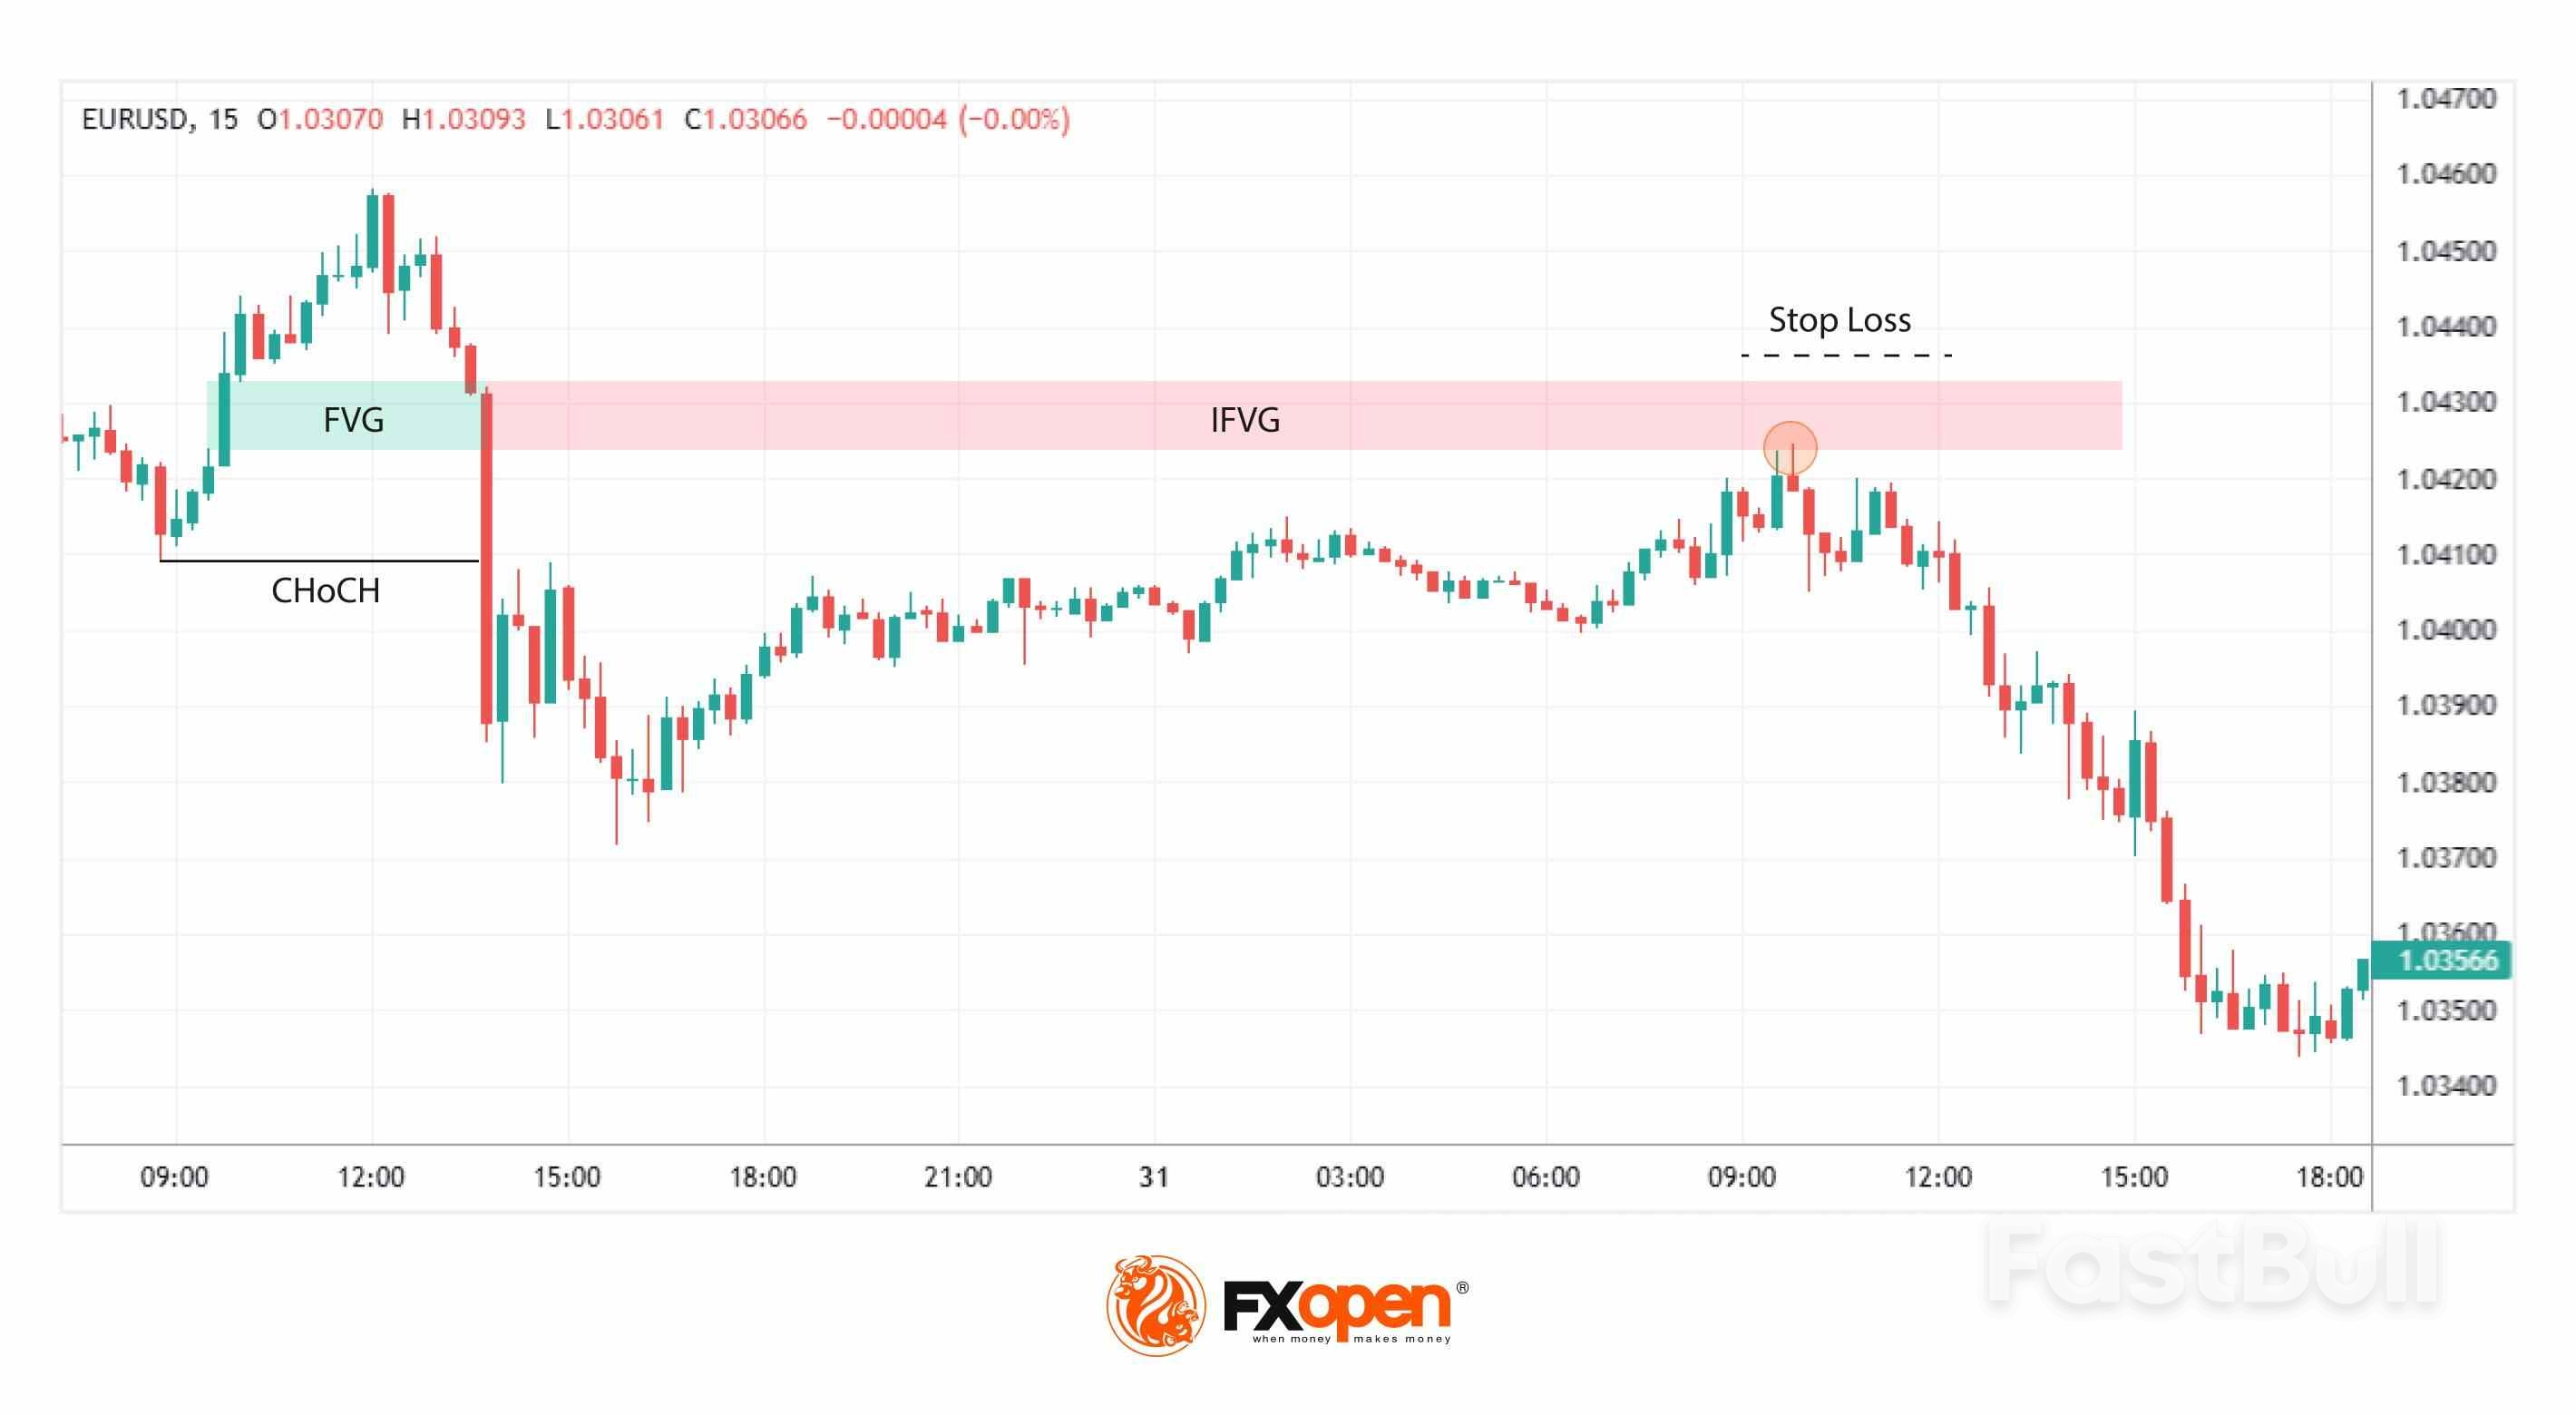
          Traders often set a limit order at the IFVG boundary, anticipating a retracement and for the area to hold. A stop loss is typically placed just beyond the IFVG or a nearby swing high/low to manage risk. For exits, targets might include a predefined risk/reward ratio, such as 1:3, or a significant technical level like an order block or support/resistance area. This approach ensures trades remain structured and grounded in analysis.

          Advantages and Disadvantages of IFVGs

          IFVGs offer traders a unique lens through which to analyse price movements, but like any tool, they come with both strengths and limitations. Understanding these can help traders incorporate IFVGs into their strategies.

          Advantages

          ● Highlight market sentiment shifts: IFVGs pinpoint areas where sentiment has reversed, helping traders identify key turning points.
          ● Refined entry zones: They provide precise areas for potential analysis, reducing guesswork and offering clear levels to watch.
          ● Flexibility across markets: IFVGs can be applied to any market, including forex, commodities, or indices, making them versatile.
          ● Complementary to other tools: They pair well with other ICT tools like BOS, CHoCH, and order blocks for enhanced analysis.

          Disadvantages

          ● Subject to interpretation: Identifying and confirming IFVGs can vary between traders, leading to inconsistencies.
          ● Limited standalone reliability: IFVGs need to be used alongside broader market analysis; relying solely on them increases risk.
          ● Higher timeframe dependence: Their effectiveness can diminish on lower timeframes, where noise often obscures true sentiment shifts.
          ● Potential for invalidation: While IFVGs signal potential opportunities, they aren’t guarantees; price can break through, rendering them ineffective.


          FAQ

          What Is an Inverse Fair Value Gap (IFVG)?

          The IFVG meaning refers to a formation that occurs when a Fair Value Gap (FVG) is invalidated. For example, a bearish FVG becomes bullish after the price breaks above it, creating a potential support zone. Similarly, a bullish FVG can transform into a bearish IFVG if the price breaks below it, creating a potential resistance zone. IFVGs highlight shifts in market sentiment, providing traders with areas of interest for analysing possible reversals or continuation zones.

          What Is the Difference Between a Fair Value Gap and an Inverse Fair Value Gap?

          A Fair Value Gap (FVG) is an imbalance caused by aggressive buying or selling, creating a price gap that may act as support or resistance. An Inverse Fair Value Gap (IFVG) occurs when the original FVG is invalidated—indicating a shift in sentiment—and its role flips. For instance, a bearish FVG invalidated by a price breakout becomes a bullish IFVG.

          What Is the Difference Between BPR and Inverse FVG?

          A Balanced Price Range (BPR) represents the overlap of two opposing Fair Value Gaps (FVGs), creating a sensitive zone for potential price reactions. In contrast, an Inverse Fair Value Gap (IFVG) is a concept based on a single FVG that has been invalidated, flipping its role. While both are useful, BPR reflects the equilibrium between buyers and sellers, whereas IFVG highlights sentiment reversal.

          Source: FXOpen

          Risk Warnings and Disclaimers
          You understand and acknowledge that there is a high degree of risk involved in trading. Following any strategies or investment methods may lead to potential losses. The content on the site is provided by our contributors and analysts for information purposes only. You are solely responsible for determining whether any trading assets, securities, strategy, or any other product is suitable for investing based on your own investment objectives and financial situation.
          Add to Favorites
          Share

          Oil Retreats Slightly After Supply-Driven Rally Amid Russian Sanction Fears

          Gerik

          Economic

          Commodity

          Oil Pauses After Surge, But Geopolitical Risks Keep Rally Alive

          Oil markets eased in early Tuesday trading, cooling slightly after Brent and WTI crude hit their highest levels in over two weeks on Monday. Brent fell by 42 cents to $67.80 per barrel, and WTI slipped 45 cents to $64.35 as of 0754 GMT. This mild correction came after a nearly 2% surge the day prior, driven by mounting concerns over disruptions to Russian oil infrastructure.
          Monday’s price gains were primarily sparked by intensified Ukrainian strikes on Russian energy facilities. These attacks caused substantial damage to Moscow’s refining capacity, disrupted fuel exports, and triggered localized gasoline shortages inside Russia. Analysts noted that this development could mark a turning point in market sentiment if further infrastructure attacks follow.

          Technical Breakout Signals Potential Further Upside

          WTI’s move above its 100-day moving average on Monday added a bullish tone to market dynamics. Analysts at IG pointed out that crude prices appear to be approaching a breakout point, particularly if WTI sustains a close above the $64–$65 resistance range. This level is seen as a critical threshold, where a sustained breach could invite further upside momentum.
          Barclays echoed the cautiously bullish stance in a client note, emphasizing that despite the geopolitical volatility, oil prices remain within a tight band, supported by robust underlying fundamentals and supply-side fears.

          Trump’s Sanction Threats Resurface as Risk Premium Builds

          A major driver of risk premium remains U.S. President Donald Trump’s revived threats to reimpose and expand sanctions on Russian oil unless Moscow engages in meaningful peace negotiations within two weeks. This stance, paired with the possibility of targeting third-party oil buyers, is raising alarm across the energy market.
          India now finds itself in Washington’s crosshairs, as a Department of Homeland Security notice confirmed an additional 25% tariff on Indian-origin goods starting Wednesday. This pushes total U.S. duties on Indian exports to as high as 50% levels usually reserved for strategic economic adversaries.
          With India being a major consumer of Russian oil under discounted terms, the dual threat of sanctions and tariffs could disrupt global trade flows and inject more volatility into oil markets. Indian exporters are already bracing for significant disruptions, which could have knock-on effects on refining demand and oil shipment logistics.
          The next immediate market catalyst will likely come from U.S. inventory data, with the American Petroleum Institute set to release figures later Tuesday. Consensus expectations point to a drawdown in crude and gasoline stocks, but a build-up in distillate inventories. If confirmed by Wednesday’s EIA report, this data could reinforce bullish sentiment and help sustain price gains.
          While oil prices took a breather Tuesday, the fundamental picture remains tight and filled with upside risks. Escalating conflict in Eastern Europe, looming U.S. sanctions, aggressive tariff policies, and shrinking inventories suggest that crude could continue climbing if key resistance levels are cleared. Volatility will remain elevated, and traders are increasingly pricing in geopolitical risk premiums not seen since early 2024.

          Source: Reuters

          To stay updated on all economic events of today, please check out our Economic calendar
          Risk Warnings and Disclaimers
          You understand and acknowledge that there is a high degree of risk involved in trading. Following any strategies or investment methods may lead to potential losses. The content on the site is provided by our contributors and analysts for information purposes only. You are solely responsible for determining whether any trading assets, securities, strategy, or any other product is suitable for investing based on your own investment objectives and financial situation.
          Add to Favorites
          Share
          FastBull
          Copyright © 2025 FastBull Ltd

          728 RM B 7/F GEE LOK IND BLDG NO 34 HUNG TO RD KWUN TONG KLN HONG KONG

          TelegramInstagramTwitterfacebooklinkedin
          App Store Google Play Google Play
          Products
          Charts

          Chats

          Q&A with Experts
          Screeners
          Economic Calendar
          Data
          Tools
          Membership
          Features
          Function
          Markets
          Copy Trading
          Latest Signals
          Contests
          News
          Analysis
          24/7
          Columns
          Education
          Company
          Careers
          About Us
          Contact Us
          Advertising
          Help Center
          Feedback
          User Agreement
          Privacy Policy
          Business

          White Label

          Data API

          Web Plug-ins

          Poster Maker

          Affiliate Program

          Risk Disclosure

          The risk of loss in trading financial instruments such as stocks, FX, commodities, futures, bonds, ETFs and crypto can be substantial. You may sustain a total loss of the funds that you deposit with your broker. Therefore, you should carefully consider whether such trading is suitable for you in light of your circumstances and financial resources.

          No decision to invest should be made without thoroughly conducting due diligence by yourself or consulting with your financial advisors. Our web content might not suit you since we don't know your financial conditions and investment needs. Our financial information might have latency or contain inaccuracy, so you should be fully responsible for any of your trading and investment decisions. The company will not be responsible for your capital loss.

          Without getting permission from the website, you are not allowed to copy the website's graphics, texts, or trademarks. Intellectual property rights in the content or data incorporated into this website belong to its providers and exchange merchants.

          Not Logged In

          Log in to access more features

          FastBull Membership

          Not yet

          Purchase

          Become a signal provider
          Help Center
          Customer Service
          Dark Mode
          Price Up/Down Colors

          Log In

          Sign Up

          Position
          Layout
          Fullscreen
          Default to Chart
          The chart page opens by default when you visit fastbull.com