• Trade
  • Markets
  • Copy
  • Contests
  • 24/7
  • Calendar
  • Q&A
  • Chats
Screeners
SYMBOL
LAST
BID
ASK
HIGH
LOW
NET CHG.
%CHG.
SPREAD
SOURCE
SPX
S&P 500 Index
7370.57
7370.57
7370.57
7376.16
7349.50
-32.47
-0.44%
--
--
DJI
Dow Jones Industrial Average
49524.38
49524.38
49524.38
49696.53
49245.11
-161.73
-0.33%
--
--
IXIC
NASDAQ Composite Index
25936.53
25936.53
25936.53
26026.17
25853.75
-154.19
-0.59%
--
--
USDX
US Dollar Index
99.200
99.200
99.280
99.270
98.860
+0.310
+ 0.31%
--
--
EURUSD
Euro / US Dollar
1.16108
1.16108
1.16115
1.16612
1.16012
-0.00449
-0.39%
--
--
GBPUSD
Pound Sterling / US Dollar
1.33987
1.33987
1.33995
1.34368
1.33858
-0.00340
-0.25%
--
--
XAUUSD
Gold / US Dollar
4495.29
4495.29
4495.70
4589.00
4464.72
-71.07
-1.56%
--
--
WTI
Light Sweet Crude Oil
102.969
102.969
102.999
104.004
101.420
+0.931
+ 0.91%
--
--

Community Accounts

Signal Accounts
--
Profit Accounts
--
Loss Accounts
--
View More

Become a signal provider

Sell trading signals to earn additional income

View More

Guide to Copy Trading

Get started with ease and confidence

View More

Signal Accounts for Members

All Signal Accounts

Best Return
  • Best Return
  • Best P/L
  • Best MDD
Past 1W
  • Past 1W
  • Past 1M
  • Past 1Y

All Contests

  • All
  • Recommend
  • Stocks
  • Cryptocurrencies
  • Central Banks
  • Trump Updates
  • Featured News
Top News Only
Share

U.S. Treasury Secretary Bessenter: If The Japanese Government Grants Bank Of Japan Governor Kazuo Ueda Sufficient Independence, He Will "take The Necessary Measures"

Share

Inflation Concerns Intensify As The 30-year U.S. Treasury Yield Surges To 5.18%

Share

The Yield On The 10-year U.S. Treasury Note Rose To 4.663%, Its Highest Level Since January 2025

Share

European Commission: Today, The European Commission Adopted The Fertilizer Action Plan, Which Aims To Support Farmers Facing Rising Fertilizer Costs And Shortages, Strengthen Domestic Production, And Reduce Europe's Dependence On Imports

Share

The Yield On 30-year U.S. Treasury Bonds Continued To Rise, Reaching 3.181%, Marking Its Highest Level Since 2007

Share

Spot Gold Continues To Decline, Falling Below $4,500 Per Ounce And Dropping Nearly 2% Within The Day. Spot Silver Has Slipped Below $74 Per Ounce, Down Nearly 6% On The Day. U.S. Gold Stocks Opened Lower Across The Board, With Cordillera Mining Down More Than 4% And Newmont Down More Than 3%

Share

Spot Gold Continued Its Sharp Decline, Falling Below $4,470 Per Ounce, Down 2.13% On The Day. Spot Silver Plunged $4 On The Day, Currently Trading At $73.64 Per Ounce, A Drop Of 5.18%

Share

Spot Gold Fell Below $4,490 Per Ounce, Down 1.68% On The Day

Share

The Most Active Shanghai Silver Futures Contract Fell 4.22% Intraday, Currently Trading At 18,056 Yuan/kg. The Most Active Shanghai Gold Futures Contract Fell Over 1% Intraday, Currently Trading At 987.74 Yuan/gram

Share

Spot Silver Fell 5.00% Intraday, Currently Trading At $73.73 Per Ounce. New York Silver Futures Fell Below $74 Per Ounce, Down 4.45% Intraday

Share

Spot Gold Continued Its Decline, Breaching The $4,500 Per Ounce Level And Falling 1.45% On The Day. Spot Silver Retreated Below $74 Per Ounce, Down 4.74% On The Day

Share

[Spot Gold Breaks Below $4500 Mark] May 19th, According To Bitget Market Data, The Spot Gold Price Continued To Fall, Dropping Below $4500 Per Ounce, With A 1.45% Intraday Decline.Spot Silver Fell Below $74 Per Ounce, With A 4.74% Intraday Decline

Share

The SC Crude Oil Futures Contract Rose 2.00% Intraday, Currently Trading At 687.30 Yuan/barrel. The Styrene (EB) Futures Contract Rose 2.00% Intraday, Currently Trading At 9486.00 Yuan/ton. The Low-sulfur Fuel Oil (LU) Futures Contract Rose 2.00% Intraday, Currently Trading At 5262.00 Yuan/ton

Share

The Yield On The 30-year U.S. Treasury Note Rose To 5.177%, The Highest Level Since 2007

Share

The Yield On 10-year U.S. Treasury Bonds Continued To Rise, Reaching 4.569%

Share

The White House: Trump Will Sign An Executive Order At 4:30 P.m. Eastern Time (4:30 A.m. Beijing Time On Wednesday)

Share

Spot Gold Fell Below $4,510 Per Ounce, Down 1.24% On The Day. Spot Silver Fell Below $75 Per Ounce, Down 3.44% On The Day

Share

US Treasury Secretary Bessen: Middle Eastern Countries Also Need To Eradicate Iran's Shadow Banking Network

Share

U.S. Treasury Secretary Bessenter: Some Of The U.S. Sanctions Lists Are Outdated And Could Lead To Unintended Consequences

Share

Goldman Sachs: Rising Oil Prices, Persistent Inflation, And Climbing Bond Yields Could Trigger A Recent Stock Market Correction

TIME
ACT
FCST
PREV
IMPACT
U.S. Manufacturing Output MoM (SA) (Apr)

A:--

F: --

P: --
USDX
  • USDX
  • XAUUSD
  • XAGUSD
  • WTI
Russia CPI YoY (Apr)

A:--

F: --

P: --

WTI
  • WTI
  • XAUUSD
  • XAGUSD
  • USDX
U.S. Weekly Total Oil Rig Count

A:--

F: --

P: --

WTI
  • WTI
  • XAUUSD
  • XAGUSD
  • USDX
U.S. Weekly Total Rig Count

A:--

F: --

P: --

WTI
  • WTI
  • XAUUSD
  • XAGUSD
  • USDX
U.K. Rightmove House Price Index YoY (May)

A:--

F: --

P: --

GBPUSD
  • GBPUSD
  • XAUUSD
  • XAGUSD
  • WTI
  • USDX
China, Mainland Industrial Output YoY (YTD) (Apr)

A:--

F: --

P: --

XAUUSD
  • XAUUSD
  • XAGUSD
  • WTI
  • USDX
China, Mainland Urban Area Unemployment Rate (Apr)

A:--

F: --

P: --

XAUUSD
  • XAUUSD
  • XAGUSD
  • WTI
  • USDX
Turkey Consumer Confidence Index (May)

A:--

F: --

P: --

XAUUSD
  • XAUUSD
  • XAGUSD
  • WTI
  • USDX
U.S. NAHB Housing Market Index (May)

A:--

F: --

P: --

USDX
  • USDX
  • XAUUSD
  • XAGUSD
  • WTI
Japan Real GDP QoQ (Q1)

A:--

F: --

P: --
USDJPY
  • USDJPY
  • XAUUSD
  • XAGUSD
  • WTI
  • USDX
Japan Nominal GDP Prelim QoQ (Q1)

A:--

F: --

P: --

USDJPY
  • USDJPY
  • XAUUSD
  • XAGUSD
  • WTI
  • USDX
RBA Monetary Policy Meeting Minutes
U.K. 3-Month ILO Unemployment Rate (Mar)

A:--

F: --

P: --

GBPUSD
  • GBPUSD
  • XAUUSD
  • XAGUSD
  • WTI
  • USDX
U.K. Unemployment Rate (Apr)

A:--

F: --

P: --

GBPUSD
  • GBPUSD
  • XAUUSD
  • XAGUSD
  • WTI
  • USDX
U.K. Unemployment Claimant Count (Apr)

A:--

F: --

P: --
GBPUSD
  • GBPUSD
  • XAUUSD
  • XAGUSD
  • WTI
  • USDX
U.K. 3-Month ILO Employment Change (Mar)

A:--

F: --

P: --

GBPUSD
  • GBPUSD
  • XAUUSD
  • XAGUSD
  • WTI
  • USDX
U.K. Average Weekly Earnings (3-Month Average, Excluding Bonuses) YoY (Mar)

A:--

F: --

P: --

GBPUSD
  • GBPUSD
  • XAUUSD
  • XAGUSD
  • WTI
  • USDX
U.K. Average Weekly Earnings (3-Month Average, Including Bonuses) YoY (Mar)

A:--

F: --

P: --
GBPUSD
  • GBPUSD
  • XAUUSD
  • XAGUSD
  • WTI
  • USDX
Euro Zone Trade Balance (SA) (Mar)

A:--

F: --

P: --
EURUSD
  • EURUSD
  • XAUUSD
  • XAGUSD
  • WTI
  • USDX
Euro Zone Trade Balance (Not SA) (Mar)

A:--

F: --

P: --
EURUSD
  • EURUSD
  • XAUUSD
  • XAGUSD
  • WTI
  • USDX
Canada National Economic Confidence Index

A:--

F: --

P: --

USDCAD
  • USDCAD
  • XAUUSD
  • XAGUSD
  • WTI
  • USDX
European Central Bank Chief Economist Lane and Federal Reserve Governor Waller spoke at the European Central Bank research conference.
Canada CPI MoM (Apr)

A:--

F: --

P: --

WTI
  • WTI
  • XAUUSD
  • XAGUSD
  • USDX
Canada CPI YoY (Apr)

A:--

F: --

P: --

WTI
  • WTI
  • XAUUSD
  • XAGUSD
  • USDX
Canada Building Permits MoM (SA) (Mar)

A:--

F: --

P: --
USDCAD
  • USDCAD
  • XAUUSD
  • XAGUSD
  • WTI
  • USDX
Canada New Housing Price Index MoM (Apr)

A:--

F: --

P: --

USDCAD
  • USDCAD
  • XAUUSD
  • XAGUSD
  • WTI
  • USDX
Canada Trimmed CPI YoY (SA) (Apr)

A:--

F: --

P: --

WTI
  • WTI
  • XAUUSD
  • XAGUSD
  • USDX
Canada Core CPI YoY (Apr)

A:--

F: --

P: --

WTI
  • WTI
  • XAUUSD
  • XAGUSD
  • USDX
Canada Core CPI MoM (Apr)

A:--

F: --

P: --

WTI
  • WTI
  • XAUUSD
  • XAGUSD
  • USDX
U.S. Weekly Redbook Index YoY

A:--

F: --

P: --

XAUUSD
  • XAUUSD
  • XAGUSD
  • WTI
  • USDX
U.S. Pending Home Sales Index (Apr)

--

F: --

P: --

U.S. Pending Home Sales Index MoM (SA) (Apr)

--

F: --

P: --

U.S. Pending Home Sales Index YoY (Apr)

--

F: --

P: --

U.S. API Weekly Cushing Crude Oil Stocks

--

F: --

P: --

U.S. API Weekly Crude Oil Stocks

--

F: --

P: --

U.S. API Weekly Gasoline Stocks

--

F: --

P: --

U.S. API Weekly Refined Oil Stocks

--

F: --

P: --

Japan Reuters Tankan Non-Manufacturers Index (May)

--

F: --

P: --

Japan Reuters Tankan Manufacturers Index (May)

--

F: --

P: --

Philadelphia Fed President Henry Paulson delivers a speech
Australia Westpac Leading Index MoM (Apr)

--

F: --

P: --

China, Mainland 1-Year Loan Prime Rate (LPR)

--

F: --

P: --

China, Mainland 5-Year Loan Prime Rate

--

F: --

P: --

U.K. Core CPI MoM (Apr)

--

F: --

P: --

U.K. CPI YoY (Apr)

--

F: --

P: --

U.K. Output PPI YoY (Not SA) (Apr)

--

F: --

P: --

U.K. Input PPI YoY (Not SA) (Apr)

--

F: --

P: --

U.K. Core CPI YoY (Apr)

--

F: --

P: --

U.K. Output PPI MoM (Not SA) (Apr)

--

F: --

P: --

U.K. Retail Prices Index YoY (Apr)

--

F: --

P: --

U.K. Core Retail Prices Index YoY (Apr)

--

F: --

P: --

U.K. Input PPI MoM (Not SA) (Apr)

--

F: --

P: --

Germany PPI YoY (Apr)

--

F: --

P: --

Germany PPI MoM (Apr)

--

F: --

P: --

U.K. Retail Prices Index MoM (Apr)

--

F: --

P: --

U.K. CPI MoM (Apr)

--

F: --

P: --

Indonesia 7-Day Reverse Repo Rate

--

F: --

P: --

Indonesia Loan Growth YoY (Apr)

--

F: --

P: --

Indonesia Lending Facility Rate (May)

--

F: --

P: --

Indonesia Deposit Facility Rate (May)

--

F: --

P: --

South Africa Core CPI YoY (Apr)

--

F: --

P: --

Q&A with Experts
    • All
    • Chatrooms
    • Groups
    • Friends
    Mickey flag
    EuroTrader
    @Mickey Ohh well .Yeahh you gotta keep a low profile. That's humility brother. Don't make things so loud
    are mine
    Victor flag
    Mickey
    linga on
    @Mickey Because sometimes gold gives me a heart attack.
    EuroTrader flag
    Osaghae Cephas
    I've already called the sells@srinivas
    @Osaghae CephasCongrats you are the winner in the chatroom today. You really called the sells before most tradera here
    sonam flag
    sonam
    Gold Buy Now 4470-4467 SL 4461 TP 4473 TP 4476 TP 4479 TP Open
    Gold Buy All TP Hit 220 pips Done
    Victor flag
    So sometimes I need to work with other couples
    EuroTrader flag
    Mickey
    are mine
    @Mickey That's how it should be man. Keep a low profile and make the money low key
    Size flag
    srinivas
    STOP SHORTING gold!!!
    @srinivas😂😂 alright alright… the boss has spoken
    marsgents flag
    nice i long 4468 🤣
    Victor flag
    sonam
    Gold Buy All TP Hit 220 pips Done
    @sonamMy TP1 200 is also finished.
    C.E.O flag
    EuroTrader
    @C.E.OBitcoin is still consolidating, it hasn't picked a side yet
    @EuroTrader76560 saya masuk belian kecil 0.01 ia berlaku semasa saya sibuk jualan emas 4521 tp 4490
    Victor flag
    It's all thanks to you.
    Size flag
    Now let’s see if gold actually listens this time 😄.@srinivas
    Mickey flag
    EuroTrader
    @Mickey That's how it should be man. Keep a low profile and make the money low key
    gat you man
    EuroTrader flag
    Mickey flag
    Size
    Now let’s see if gold actually listens this time 😄.@srinivas
    but seriously gold is get close to buy.watch your back
    EuroTrader flag
    EuroTrader
    @Mickey high risk shorts on Bitcoin I just took. Are you joining me in this shorts
    C.E.O flag
    andre andre andre
    Mickey flag
    EuroTrader
    @Mickey high risk shorts on Bitcoin I just took. Are you joining me in this shorts
    @EuroTraderonly gold man
    Victor flag
    C.E.O
    @EuroTrader76560 saya masuk belian kecil 0.01 ia berlaku semasa saya sibuk jualan emas 4521 tp 4490
    @C.E.OHaha, that's the epitome of a multitask trader, bro!
    Size flag
    Mickey
    but seriously gold is get close to buy.watch your back
    @Mickey yeah it’s getting into an interesting zone now.
    Type here...
    Add Symbol or Code

      No matching data

      All
      Recommend
      Stocks
      Cryptocurrencies
      Central Banks
      Trump Updates
      Featured News
      • All
      • Russia-Ukraine Conflict
      • Middle East Flashpoint
      • All
      • Russia-Ukraine Conflict
      • Middle East Flashpoint

      Search
      Products

      Charts Free Forever

      Chats Q&A with Experts
      Screeners Economic Calendar Data Tools
      Membership Features
      Data Warehouse Market Trends Institutional Data Policy Rates Macro

      Market Trends

      Market Sentiment Order Book Forex Correlations

      Top Indicators

      Charts Free Forever
      Markets

      News

      24/7 Analysis Education

      Latest Views

      Latest Update

      Signals

      Copy Rankings Latest Signals Become a signal provider AI Rating
      Contests
      Brokers

      Overview Brokers Assessment Rankings Regulators News Claims
      Broker listing Forex Brokers Comparison Tool Live Spread Comparison Scam
      Q&A Complaint Scam Alert Videos Tips to Detect Scam
      More

      Business
      Events
      Careers About Us Advertising Help Center

      White Label

      Broker API

      Data API

      Web Plug-ins

      Affiliate Program

      Awards Institution Evaluation IB Seminar Salon Event Exhibition
      Vietnam Thailand Singapore Dubai
      Fans Party Investment Sharing Session
      FastBull Summit BrokersView Expo
      Recent Searches
        Top Searches
          Markets
          Analysis
          User
          24/7
          Economic Calendar
          Education
          Data
          • Names
          • Latest
          • Prev

          View All

          No data

          Scan to Download

          Faster Charts, Chat Faster!

          Download App
          English
          • English
          • Español
          • العربية
          • Bahasa Indonesia
          • Bahasa Melayu
          • Tiếng Việt
          • ภาษาไทย
          • Français
          • Italiano
          • Türkçe
          • Русский язык
          • 简中
          • 繁中
          Open Account
          Search
          Products
          Charts Free Forever
          Markets
          News
          Signals

          Copy Rankings Latest Signals Become a signal provider AI Rating
          Contests
          Brokers

          Overview Brokers Assessment Rankings Regulators News Claims
          Broker listing Forex Brokers Comparison Tool Live Spread Comparison Scam
          Q&A Complaint Scam Alert Videos Tips to Detect Scam
          More

          Business
          Events
          Careers About Us Advertising Help Center

          White Label

          Broker API

          Data API

          Web Plug-ins

          Affiliate Program

          Awards Institution Evaluation IB Seminar Salon Event Exhibition
          Vietnam Thailand Singapore Dubai
          Fans Party Investment Sharing Session
          FastBull Summit BrokersView Expo

          BTC/USD Chart Analysis: Bitcoin Price Falls Below $90k

          FXOpen

          Forex

          Cryptocurrency

          Summary:

          As the BTC/USD chart shows, the price of the leading cryptocurrency briefly dipped below the psychological $90k level this morning, despite trading above $94k earlier in the week.Why is Bitcoin fallin

          As the BTC/USD chart shows, the price of the leading cryptocurrency briefly dipped below the psychological $90k level this morning, despite trading above $94k earlier in the week.

          Why is Bitcoin falling today?

          Among the key drivers, the following stand out:

          → Decline in the geopolitical risk premium. Bitcoin's rise earlier this week was supported by news of Maduro's detention and US actions in Venezuela. However, this factor is now losing relevance.

          → Ahead of key macroeconomic data. On Friday, the US Nonfarm Payrolls report is due to be released. Recent ADP Employment Change data suggest that Friday's figures could point to a recession in the US. In such an environment, traders may seek to reduce exposure to risk assets.

          Technical analysis of the BTC/USD chart

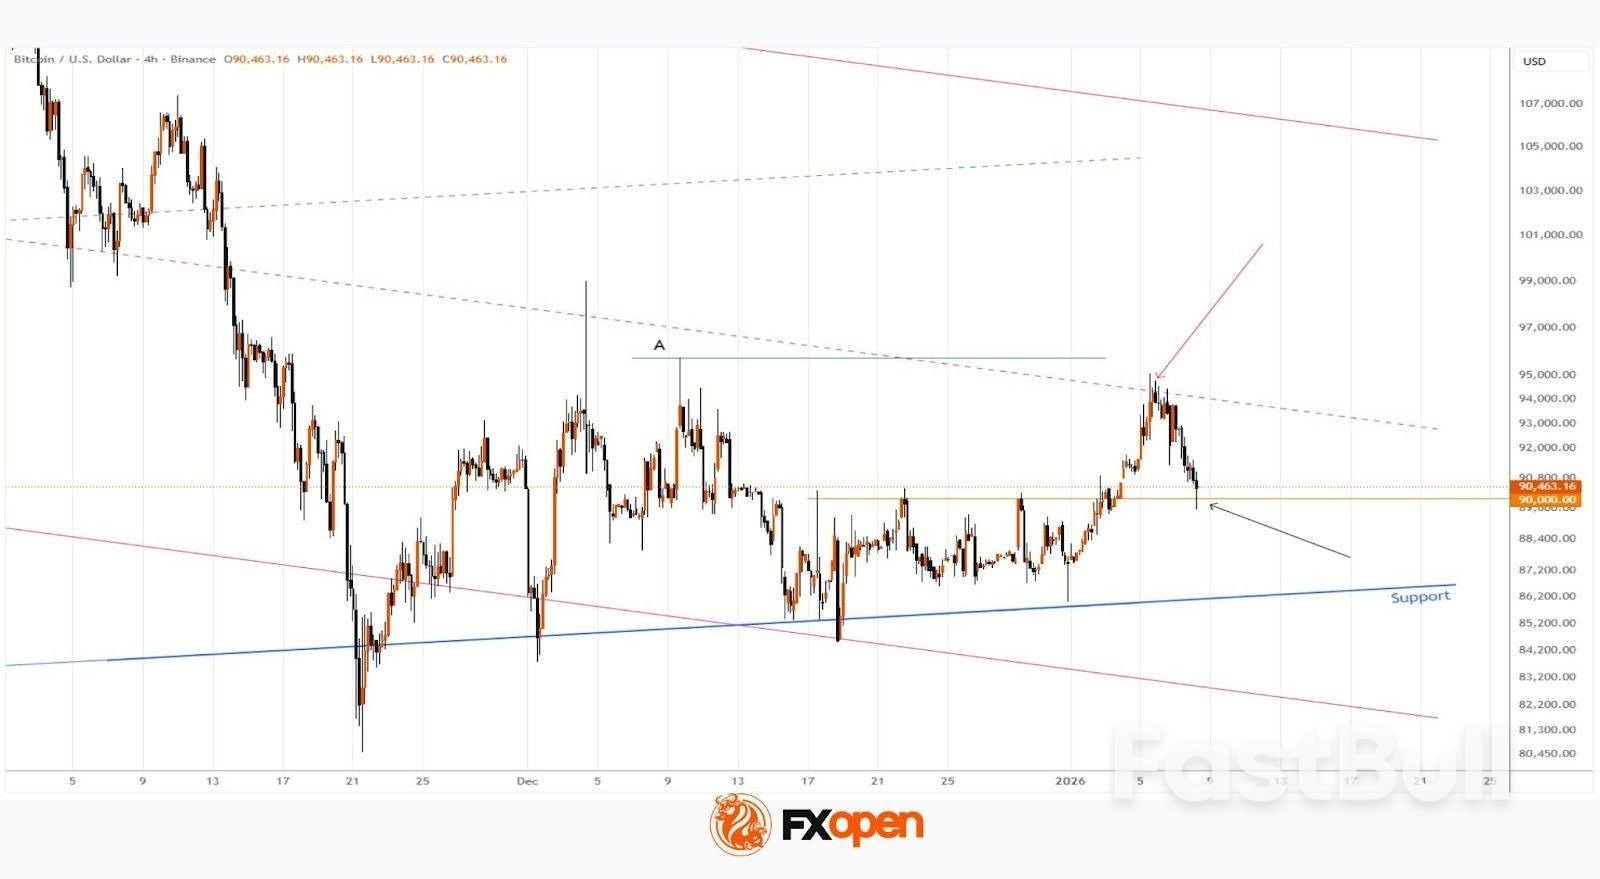
          On 18 December, we discussed Bitcoin's price action within a system of two channels, which remain relevant. This week, as indicated by the red arrow:
          → the channel median acted as resistance;
          → on the CME exchange, futures prices posted a false bullish breakout above the December high (A).

          These observations suggest that bears retain strength in the medium term. However, a sharp rebound from the $90k level (marked by the black arrow) points to renewed bullish activity. Therefore, if bears are indeed targeting a break below the lower boundary of the ascending channel, they will need to exert considerable pressure to push BTC/USD below this key psychological level.

          Source: FXOpen

          Risk Warnings and Disclaimers
          You understand and acknowledge that there is a high degree of risk involved in trading. Following any strategies or investment methods may lead to potential losses. The content on the site is provided by our contributors and analysts for information purposes only. You are solely responsible for determining whether any trading assets, securities, strategy, or any other product is suitable for investing based on your own investment objectives and financial situation.
          Add to Favorites
          Share
          FastBull
          Copyright © 2026 FastBull Ltd

          728 RM B 7/F GEE LOK IND BLDG NO 34 HUNG TO RD KWUN TONG KLN HONG KONG

          TelegramInstagramTwitterfacebooklinkedin
          App Store Google Play Google Play
          Products
          Charts

          Chats

          Q&A with Experts
          Screeners
          Economic Calendar
          Data
          Tools
          Membership
          Features
          Function
          Markets
          Copy Trading
          Latest Signals
          Contests
          24/7
          Analysis
          Education
          Company
          Careers
          About Us
          Contact Us
          Advertising
          Help Center
          Feedback
          User Agreement
          Privacy Policy
          Personal Information Protection Statement
          Business

          White Label

          Broker API

          Data API

          Web Plug-ins

          Poster Maker

          Affiliate Program

          Risk Disclosure

          The risk of loss in trading financial instruments such as stocks, FX, commodities, futures, bonds, ETFs and crypto can be substantial. You may sustain a total loss of the funds that you deposit with your broker. Therefore, you should carefully consider whether such trading is suitable for you in light of your circumstances and financial resources.

          No decision to invest should be made without thoroughly conducting due diligence by yourself or consulting with your financial advisors. Our web content might not suit you since we don't know your financial conditions and investment needs. Our financial information might have latency or contain inaccuracy, so you should be fully responsible for any of your trading and investment decisions. The company will not be responsible for your capital loss.

          Without getting permission from the website, you are not allowed to copy the website's graphics, texts, or trademarks. Intellectual property rights in the content or data incorporated into this website belong to its providers and exchange merchants.

          Not Logged In

          Log in to access more features

          Connect Broker
          Become a signal provider
          Help Center
          Customer Service
          Dark Mode
          Price Up/Down Colors

          Log In

          Sign Up

          Position
          Layout
          Fullscreen
          Default to Chart
          The chart page opens by default when you visit fastbull.com