• Trade
  • Markets
  • Copy
  • Contests
  • News
  • 24/7
  • Calendar
  • Q&A
  • Chats
Trending
Screeners
SYMBOL
LAST
BID
ASK
HIGH
LOW
NET CHG.
%CHG.
SPREAD
SPX
S&P 500 Index
6827.42
6827.42
6827.42
6899.86
6801.80
-73.58
-1.07%
--
DJI
Dow Jones Industrial Average
48458.04
48458.04
48458.04
48886.86
48334.10
-245.98
-0.51%
--
IXIC
NASDAQ Composite Index
23195.16
23195.16
23195.16
23554.89
23094.51
-398.69
-1.69%
--
USDX
US Dollar Index
98.000
98.080
98.000
98.070
97.920
+0.050
+ 0.05%
--
EURUSD
Euro / US Dollar
1.17335
1.17342
1.17335
1.17447
1.17283
-0.00059
-0.05%
--
GBPUSD
Pound Sterling / US Dollar
1.33562
1.33572
1.33562
1.33740
1.33549
-0.00145
-0.11%
--
XAUUSD
Gold / US Dollar
4327.04
4327.42
4327.04
4329.64
4294.68
+27.65
+ 0.64%
--
WTI
Light Sweet Crude Oil
57.536
57.573
57.536
57.601
57.194
+0.303
+ 0.53%
--

Community Accounts

Signal Accounts
--
Profit Accounts
--
Loss Accounts
--
View More

Become a signal provider

Sell trading signals to earn additional income

View More

Guide to Copy Trading

Get started with ease and confidence

View More

Signal Accounts for Members

All Signal Accounts

Best Return
  • Best Return
  • Best P/L
  • Best MDD
Past 1W
  • Past 1W
  • Past 1M
  • Past 1Y

All Contests

  • All
  • Trump Updates
  • Recommend
  • Stocks
  • Cryptocurrencies
  • Central Banks
  • Featured News
Top News Only
Share

Reuters Poll - Bank Of Thailand To Lower Key Policy Rate To 1.00% In Q1 Of 2026, Said A Majority Of Economists

Share

Reuters Poll - Bank Of Thailand To Cut Its Key Interest Rate To 1.25% On December 17, Said 26 Of 27 Economists

Share

Thai Finance Minister: Earlier Stimulus Measures To Shore Up Economy

Share

Thai Finance Minister: Strong Baht Driven By Capital Inflows

Share

Thai Finance Minister: Has Discussed With Central Bank To Handle Baht

Share

India's Nifty Bank Futures Down 0.1% In Pre-Open Trade

Share

India's Nifty 50 Futures Down 0.3% In Pre-Open Trade

Share

India's Nifty 50 Index Down 0.45% In Pre-Open Trade

Share

Indian Rupee Weakens Past 90.55 Versus USA Dollar To All-Time Low

Share

China's Fossil-Fuelled Power Generation Falls 4.2% Year-On-Year In November

Share

Indian Rupee Opens Down 0.1% At 90.5450 Per USA Dollar, Versus 90.4150 Previous Close

Share

Australia Home Minister: Father Involved In Bondi Gun Attack Came To Australia On Student Visa, Son Is An Australian-Born Citizen

Share

Australian Prime Minister Albanese: Stricter Gun Control Laws Will Include Restrictions On The Number Of Guns An Individual Can Own Or License To Use

Share

Australia's Prime Minister Albanese: We Are Considering A Review Of Gun Licenses For Some Time

Share

Australia's Prime Minister Albanese: Government Considering Tougher Gun Laws

Share

China Stats Bureau Spokesperson: Next Year, Adverse Impact Of Protectionism And Unilateralism May Continue

Share

China's Onshore Yuan Strengthens To A High Of 7.0516 Per Dollar, Strongest Level Since Oct 8, 2024

Share

Indonesia's November Refined Tin Exports At 7458.64 Metric Tons

Share

China's National Bureau Of Statistics: In The Next Stage, We Will Continue To Implement The Special Action To Boost Consumption And Focus On Stabilizing Employment And Promoting Income Growth

Share

China Stats Bureau Spokesperson: Household Consumption Capability And Confidence Needs To Be Further Improved

TIME
ACT
FCST
PREV
U.K. Trade Balance (Oct)

A:--

F: --

P: --

France HICP Final MoM (Nov)

A:--

F: --

P: --

China, Mainland Outstanding Loans Growth YoY (Nov)

A:--

F: --

P: --

China, Mainland M2 Money Supply YoY (Nov)

A:--

F: --

P: --

China, Mainland M0 Money Supply YoY (Nov)

A:--

F: --

P: --

China, Mainland M1 Money Supply YoY (Nov)

A:--

F: --

P: --

India CPI YoY (Nov)

A:--

F: --

P: --

India Deposit Gowth YoY

A:--

F: --

P: --

Brazil Services Growth YoY (Oct)

A:--

F: --

P: --

Mexico Industrial Output YoY (Oct)

A:--

F: --

P: --

Russia Trade Balance (Oct)

A:--

F: --

P: --

Philadelphia Fed President Henry Paulson delivers a speech
Canada Building Permits MoM (SA) (Oct)

A:--

F: --

P: --

Canada Wholesale Sales YoY (Oct)

A:--

F: --

P: --

Canada Wholesale Inventory MoM (Oct)

A:--

F: --

P: --

Canada Wholesale Inventory YoY (Oct)

A:--

F: --

P: --

Canada Wholesale Sales MoM (SA) (Oct)

A:--

F: --

P: --

Germany Current Account (Not SA) (Oct)

A:--

F: --

P: --

U.S. Weekly Total Rig Count

A:--

F: --

P: --

U.S. Weekly Total Oil Rig Count

A:--

F: --

P: --

Japan Tankan Small Manufacturing Outlook Index (Q4)

A:--

F: --

P: --

Japan Tankan Large Non-Manufacturing Diffusion Index (Q4)

A:--

F: --

P: --

Japan Tankan Large Non-Manufacturing Outlook Index (Q4)

A:--

F: --

P: --

Japan Tankan Large Manufacturing Outlook Index (Q4)

A:--

F: --

P: --

Japan Tankan Small Manufacturing Diffusion Index (Q4)

A:--

F: --

P: --

Japan Tankan Large Manufacturing Diffusion Index (Q4)

A:--

F: --

P: --

Japan Tankan Large-Enterprise Capital Expenditure YoY (Q4)

A:--

F: --

P: --

U.K. Rightmove House Price Index YoY (Dec)

A:--

F: --

P: --

China, Mainland Industrial Output YoY (YTD) (Nov)

A:--

F: --

P: --

China, Mainland Urban Area Unemployment Rate (Nov)

A:--

F: --

P: --

Saudi Arabia CPI YoY (Nov)

--

F: --

P: --

Euro Zone Industrial Output YoY (Oct)

--

F: --

P: --

Euro Zone Industrial Output MoM (Oct)

--

F: --

P: --

Canada Existing Home Sales MoM (Nov)

--

F: --

P: --

Euro Zone Total Reserve Assets (Nov)

--

F: --

P: --

U.K. Inflation Rate Expectations

--

F: --

P: --

Canada National Economic Confidence Index

--

F: --

P: --

Canada New Housing Starts (Nov)

--

F: --

P: --

U.S. NY Fed Manufacturing Employment Index (Dec)

--

F: --

P: --

U.S. NY Fed Manufacturing Index (Dec)

--

F: --

P: --

Canada Core CPI YoY (Nov)

--

F: --

P: --

Canada Manufacturing Unfilled Orders MoM (Oct)

--

F: --

P: --

U.S. NY Fed Manufacturing Prices Received Index (Dec)

--

F: --

P: --

U.S. NY Fed Manufacturing New Orders Index (Dec)

--

F: --

P: --

Canada Manufacturing New Orders MoM (Oct)

--

F: --

P: --

Canada Core CPI MoM (Nov)

--

F: --

P: --

Canada Trimmed CPI YoY (SA) (Nov)

--

F: --

P: --

Canada Manufacturing Inventory MoM (Oct)

--

F: --

P: --

Canada CPI YoY (Nov)

--

F: --

P: --

Canada CPI MoM (Nov)

--

F: --

P: --

Canada CPI YoY (SA) (Nov)

--

F: --

P: --

Canada Core CPI MoM (SA) (Nov)

--

F: --

P: --

Canada CPI MoM (SA) (Nov)

--

F: --

P: --

Federal Reserve Board Governor Milan delivered a speech
U.S. NAHB Housing Market Index (Dec)

--

F: --

P: --

Australia Composite PMI Prelim (Dec)

--

F: --

P: --

Australia Services PMI Prelim (Dec)

--

F: --

P: --

Australia Manufacturing PMI Prelim (Dec)

--

F: --

P: --

Japan Manufacturing PMI Prelim (SA) (Dec)

--

F: --

P: --

U.K. Unemployment Rate (Nov)

--

F: --

P: --

U.K. 3-Month ILO Unemployment Rate (Oct)

--

F: --

P: --

Q&A with Experts
    • All
    • Chatrooms
    • Groups
    • Friends
    Connecting
    .
    .
    .
    Type here...
    Add Symbol or Code

      No matching data

      All
      Trump Updates
      Recommend
      Stocks
      Cryptocurrencies
      Central Banks
      Featured News
      • All
      • Russia-Ukraine Conflict
      • Middle East Flashpoint
      • All
      • Russia-Ukraine Conflict
      • Middle East Flashpoint

      Search
      Products

      Charts Free Forever

      Chats Q&A with Experts
      Screeners Economic Calendar Data Tools
      Membership Features
      Data Warehouse Market Trends Institutional Data Policy Rates Macro

      Market Trends

      Market Sentiment Order Book Forex Correlations

      Top Indicators

      Charts Free Forever
      Markets

      News

      News Analysis 24/7 Columns Education
      From Institutions From Analysts
      Topics Columnists

      Latest Views

      Latest Views

      Trending Topics

      Top Columnists

      Latest Update

      Signals

      Copy Rankings Latest Signals Become a signal provider AI Rating
      Contests
      Brokers

      Overview Brokers Assessment Rankings Regulators News Claims
      Broker listing Forex Brokers Comparison Tool Live Spread Comparison Scam
      Q&A Complaint Scam Alert Videos Tips to Detect Scam
      More

      Business
      Events
      Careers About Us Advertising Help Center

      White Label

      Data API

      Web Plug-ins

      Affiliate Program

      Awards Institution Evaluation IB Seminar Salon Event Exhibition
      Vietnam Thailand Singapore Dubai
      Fans Party Investment Sharing Session
      FastBull Summit BrokersView Expo
      Recent Searches
        Top Searches
          Markets
          News
          Analysis
          User
          24/7
          Economic Calendar
          Education
          Data
          • Names
          • Latest
          • Prev

          View All

          No data

          Scan to Download

          Faster Charts, Chat Faster!

          Download App
          English
          • English
          • Español
          • العربية
          • Bahasa Indonesia
          • Bahasa Melayu
          • Tiếng Việt
          • ภาษาไทย
          • Français
          • Italiano
          • Türkçe
          • Русский язык
          • 简中
          • 繁中
          Open Account
          Search
          Products
          Charts Free Forever
          Markets
          News
          Signals

          Copy Rankings Latest Signals Become a signal provider AI Rating
          Contests
          Brokers

          Overview Brokers Assessment Rankings Regulators News Claims
          Broker listing Forex Brokers Comparison Tool Live Spread Comparison Scam
          Q&A Complaint Scam Alert Videos Tips to Detect Scam
          More

          Business
          Events
          Careers About Us Advertising Help Center

          White Label

          Data API

          Web Plug-ins

          Affiliate Program

          Awards Institution Evaluation IB Seminar Salon Event Exhibition
          Vietnam Thailand Singapore Dubai
          Fans Party Investment Sharing Session
          FastBull Summit BrokersView Expo

          The Dollar’s Reversal to Growth Is in The Hands of Policymakers

          FxPro

          Technical Analysis

          Summary:

          The US dollar is retreating on all fronts, showing a daily decline since last Monday, when the military conflict between Israel and Iran came out of its hot phase and the tax bill in the US returned to the forefront.

          The US dollar is retreating on all fronts, showing a daily decline since last Monday, when the military conflict between Israel and Iran came out of its hot phase and the tax bill in the US returned to the forefront.

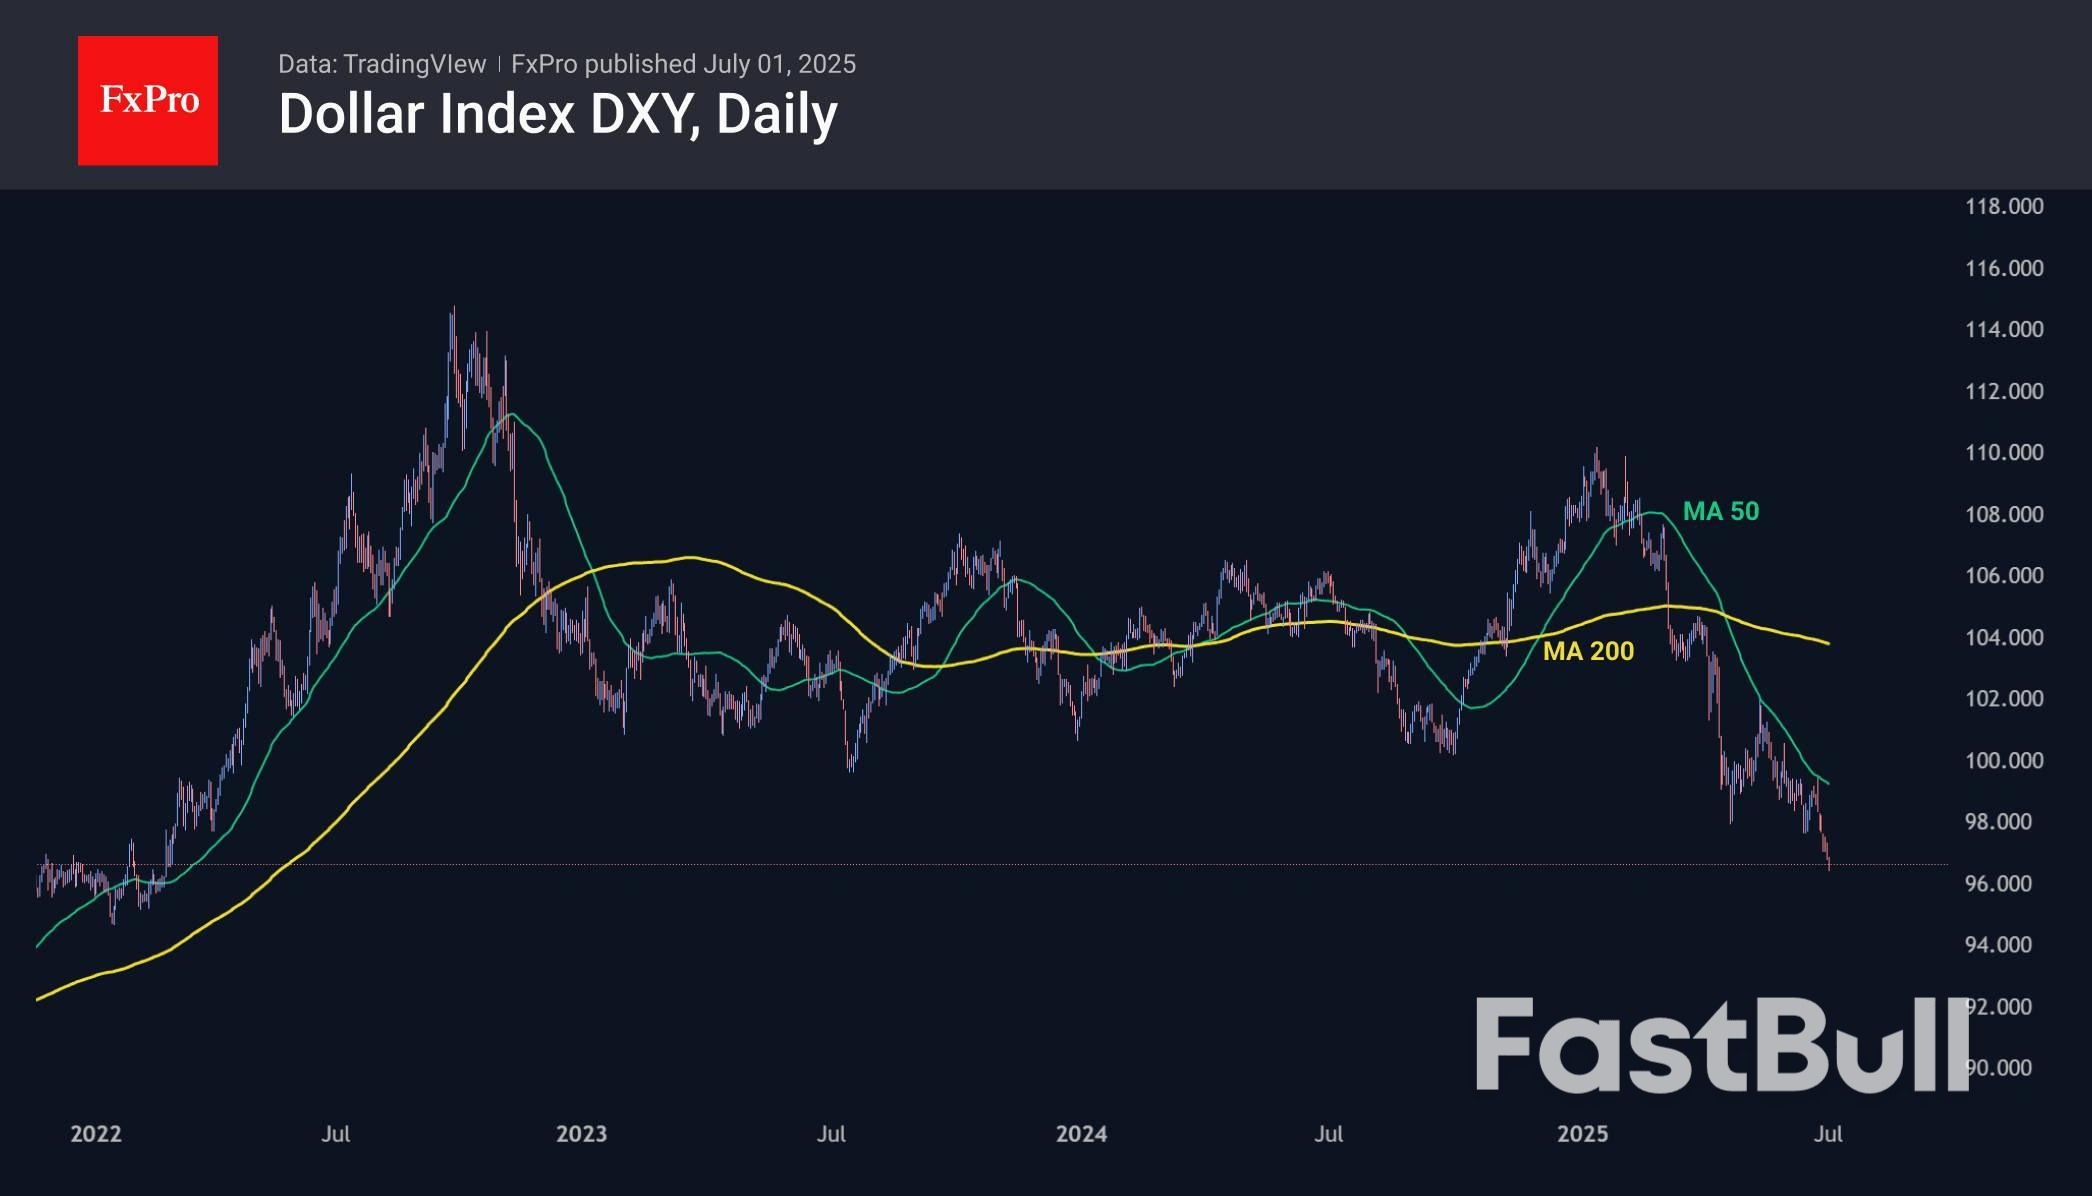
          Resuming its decline, interrupted by the bombing between Israel and Iran, the dollar index has been updating its more than three-year lows on a daily basis since the second half of last week. With total losses of over 12%, the first half of the year was the worst for the US currency since 1973, i.e. in the entire history of the free forex market.

          A more neutral geopolitical background removed the ‘war premium’ from the dollar’s price and brought back the focus on Trump’s pressure on Powell and the discussion of Trump’s bill. This ‘One Big and Beautiful Bill’ promises to create a 7% budget deficit. The situation is not as serious as it was in September 2022 in Britain, but it is moving in the same direction.

          However, we still see more influence in the changing mood of market participants, where expectations of a rate cut are growing. Markets are pricing in a 65% chance that there will be at least three cuts by the end of the year, almost double the figure a month ago.

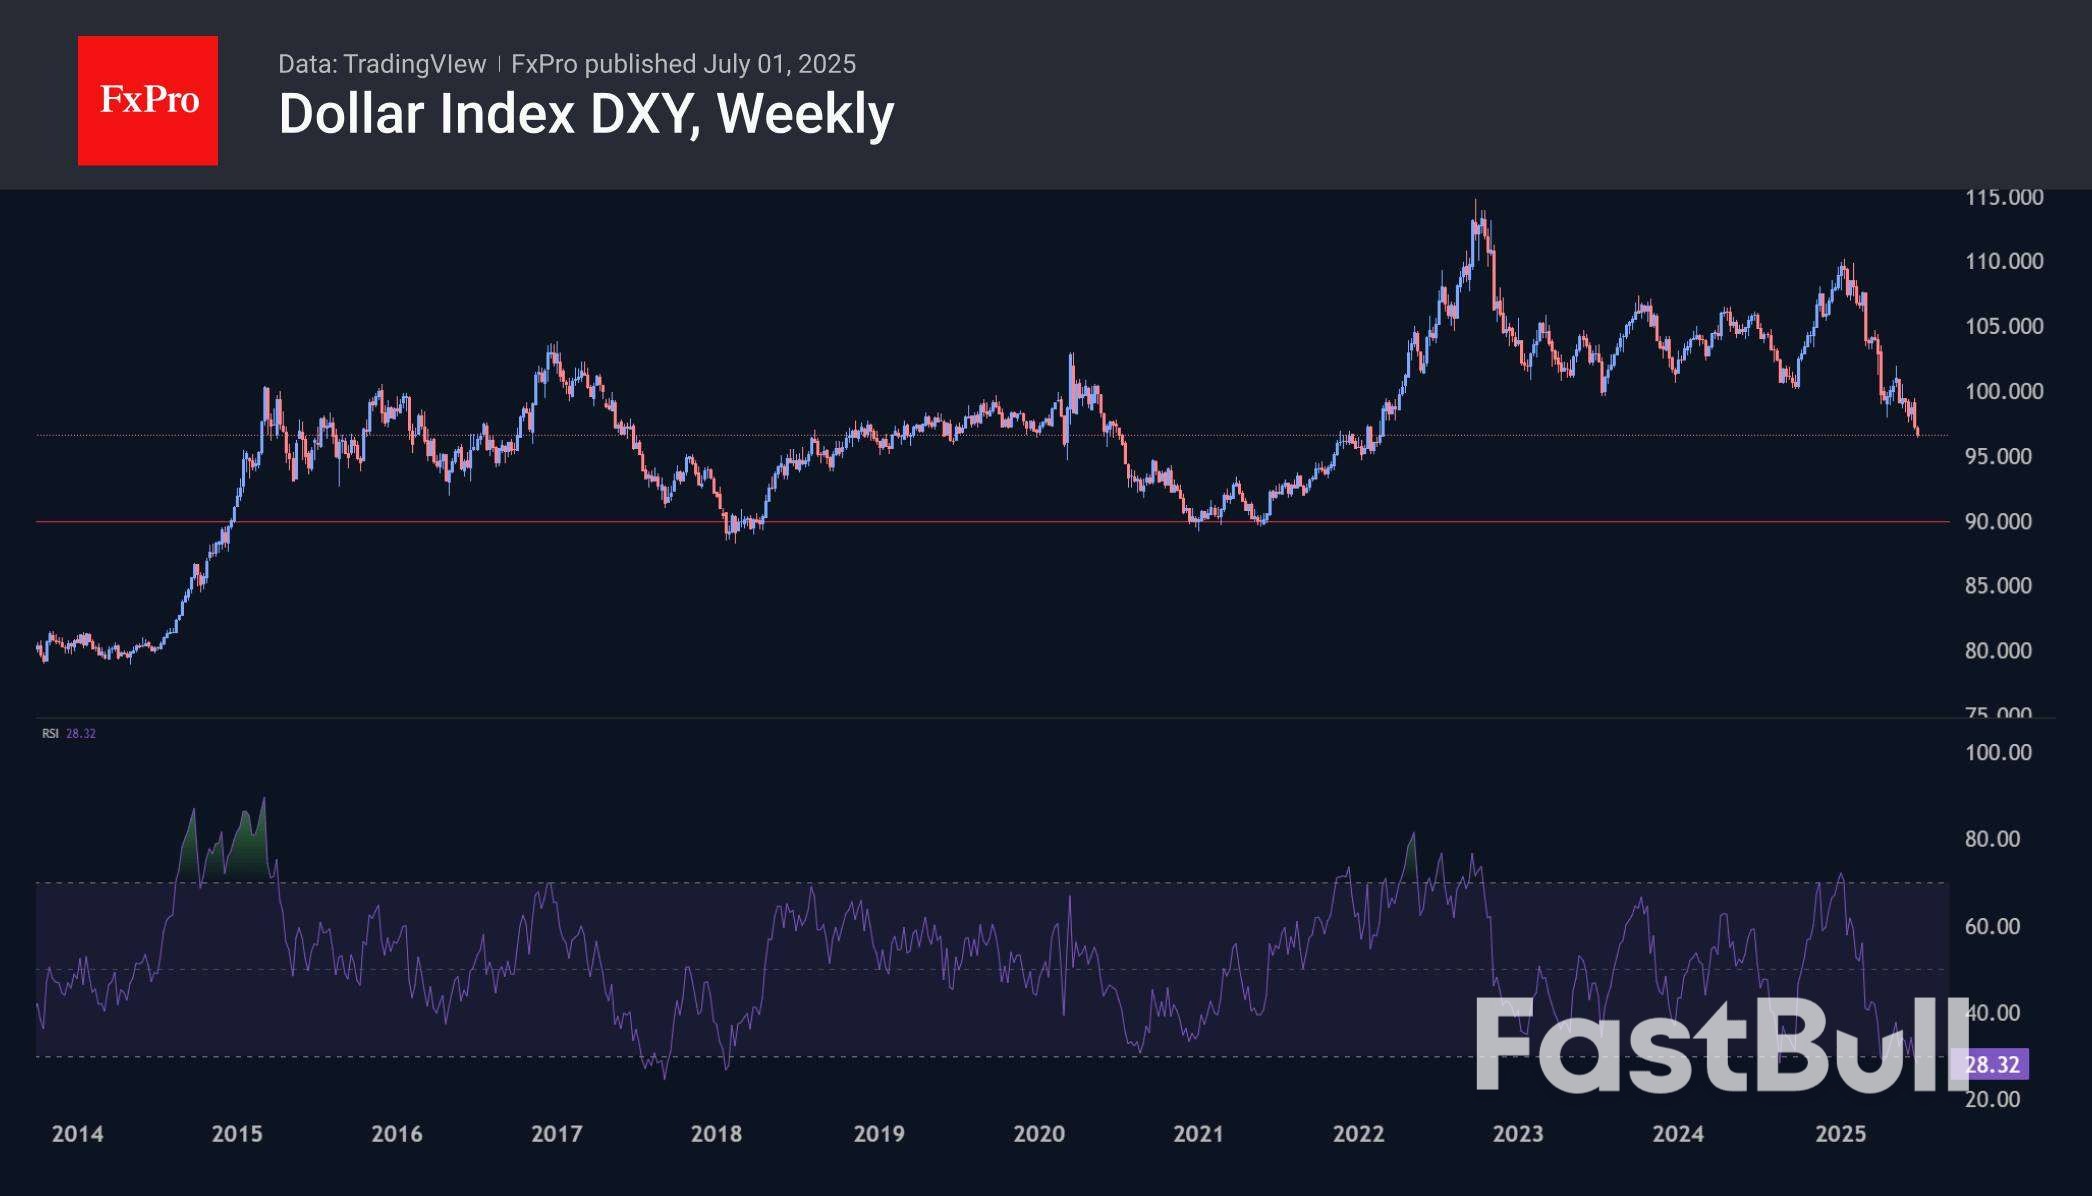
          On weekly timeframes, the RSI index has been updating its lows since early 2018, indicating an aggressive decline over the past seven years. This has dashed hopes for a bottoming out and rebound earlier this year.

          The technical picture indicates the potential for the dollar to decline by another 7-8% to the 88-90 range on the DXY from the current 96.6. However, this is a rare case where the situation is in the hands of politicians. We turn our attention to representatives of the US Treasury and the Fed with comments on maintaining a strong dollar policy. Strong macroeconomic employment data this week may halt the dollar sell-off, but this is unlikely during a period of economic slowdown.

          Source: FxPro

          Risk Warnings and Disclaimers
          You understand and acknowledge that there is a high degree of risk involved in trading. Following any strategies or investment methods may lead to potential losses. The content on the site is provided by our contributors and analysts for information purposes only. You are solely responsible for determining whether any trading assets, securities, strategy, or any other product is suitable for investing based on your own investment objectives and financial situation.
          Add to Favorites
          Share

          U.S. Faces Largest Economic Risk if Tariff Talks Collapse, South Korea’s BoK Warns

          Gerik

          Economic

          Escalating Tariff Risks Could Backfire on the U.S. Economy

          A recent report from the Bank of Korea (BoK)’s New York office warns that the United States stands to bear the greatest economic cost should current tariff negotiations with major trading partners fail. The analysis, published under the title "U.S. Economic Outlook and Key Issues for H2 2025," points to the country's growing trade dependence as a critical vulnerability.
          Contrary to its historical posture as a less trade-dependent economy, the U.S. now exhibits twice the level of trade reliance compared to the 1930s Smoot-Hawley tariff era. The report cautions that retaliatory tariffs from trading partners could disproportionately harm the U.S. economy, especially in the event of a 25% average tariff increase proposed by the Trump administration.

          Quantifying the Asymmetry in Economic Exposure

          In 2023, U.S. exports accounted for approximately 7% of its GDP. By contrast, the proportion of GDP dependent on exports to the U.S. was only 3.1% for the European Union and 2.9% for China. These figures suggest that if a wave of retaliatory tariffs were enacted, the damage to the U.S. economy could be more severe than the impact on its trading partners.
          Using this ratio-based comparison, the BoK notes that nearly 7% of U.S. economic output could be exposed to foreign countermeasures, while the reciprocal exposure for the EU and China remains notably smaller. This economic imbalance underscores why the U.S. might find itself more economically vulnerable than its trading counterparts in a tit-for-tat tariff war.

          Policy Uncertainty as a Drag on Growth and Investment

          The warning from BoK comes amid a 90-day suspension of tariff enforcement announced on April 2, with the temporary halt set to expire on July 8. The U.S. administration is currently engaged in bilateral negotiations to avoid a full-scale trade escalation, but the report signals growing concern that the final tariff rates may still remain high.
          Market analysts expect that any eventual tariff implementation could be less aggressive than President Trump’s initial proposal. However, the risk remains that if talks fail, markets could face a dual shock—first from weakened global demand, and second from a sharp repricing of financial assets, particularly in sectors sensitive to trade and inflation.

          Asset Markets at Risk Amid Recession and Inflation Scenarios

          The BoK report goes further to warn that failure in trade negotiations—combined with the onset of recessionary pressures or a rise in inflation—could result in swift downward adjustments in asset prices. This warning implies that financial markets are likely underestimating the potential spillover effects of a deteriorating trade environment.
          The twin threats of slower economic growth and higher inflation, catalyzed by tariff hikes, could lead to tighter financial conditions, reduced consumer confidence, and heightened volatility in equity and bond markets. Investors are being advised to monitor the July 8 outcome closely, as it may determine the trajectory of U.S. asset pricing in the second half of the year.

          A High-Stakes Test for U.S. Trade Strategy

          While the U.S. seeks to pressure its trading partners into more favorable terms, the economic calculus presented by the Bank of Korea suggests that Washington may face the steepest costs if talks collapse. With its high export-to-GDP ratio and sensitivity to retaliatory tariffs, the U.S. could find its financial markets and broader economy disproportionately affected.
          As the deadline approaches, the ability of policymakers to reach negotiated outcomes will be crucial not only to global trade stability but also to domestic financial resilience. The path forward demands strategic compromise, as the margin for unilateral escalation grows increasingly narrow.

          Source: Reuters

          To stay updated on all economic events of today, please check out our Economic calendar
          Risk Warnings and Disclaimers
          You understand and acknowledge that there is a high degree of risk involved in trading. Following any strategies or investment methods may lead to potential losses. The content on the site is provided by our contributors and analysts for information purposes only. You are solely responsible for determining whether any trading assets, securities, strategy, or any other product is suitable for investing based on your own investment objectives and financial situation.
          Add to Favorites
          Share

          DWS-Backed AllUnity Secures BaFin Approval to Launch Euro-Pegged Stablecoin

          Gerik

          Economic

          Cryptocurrency

          BaFin Greenlights Euro Stablecoin Issuance by DWS Venture

          In a significant development for the European digital finance sector, AllUnity—a joint venture that includes Deutsche Bank's asset management arm DWS—announced on Wednesday that it has received formal authorization from Germany’s financial regulator BaFin to issue a euro-backed stablecoin. The approval comes after more than a year of preparation and regulatory engagement.
          This regulatory milestone positions AllUnity as one of the first ventures in Europe to bring a fully compliant, euro-pegged stablecoin to market under the supervision of a major financial authority. The decision underscores BaFin’s willingness to support innovation in tokenized assets within a structured legal framework.

          Stablecoins Gain Ground in Europe’s Regulated Financial Ecosystem

          Stablecoins are digital tokens that maintain a fixed value by being backed 1:1 by fiat currencies such as the euro or US dollar. While the majority of stablecoins globally are pegged to the dollar, the emergence of a euro-denominated token under German regulation is seen as a strategic step toward increasing the euro’s presence in the growing digital asset landscape.
          BaFin’s approval signals institutional support for regulated stablecoins that can serve as bridges between traditional banking and decentralized finance (DeFi), while offering predictability and compliance to corporate users, fintechs, and digital asset platforms.

          Implications for the Future of Digital Payments and Tokenization in Europe

          AllUnity’s stablecoin could have broad applications in payment settlements, digital marketplaces, and blockchain-based financial services, providing a euro-denominated option for real-time transactions and on-chain liquidity. As European regulators continue to define frameworks under MiCA (Markets in Crypto-Assets Regulation), early approvals such as this one may shape how stablecoins are adopted across the EU.
          The venture’s backing by DWS—one of Europe’s leading asset managers—adds institutional credibility to the project, and may pave the way for further integration of tokenized finance into mainstream investment infrastructure.
          BaFin’s authorization of AllUnity’s euro stablecoin is more than just a technical milestone—it reflects a broader trend of increasing regulatory clarity and institutional participation in the digital asset economy. With Europe moving toward a harmonized crypto regulatory regime, this development may serve as a catalyst for broader adoption of regulated stablecoins and deeper fintech-bank collaboration in the evolving financial landscape.

          Source: Reuters

          To stay updated on all economic events of today, please check out our Economic calendar
          Risk Warnings and Disclaimers
          You understand and acknowledge that there is a high degree of risk involved in trading. Following any strategies or investment methods may lead to potential losses. The content on the site is provided by our contributors and analysts for information purposes only. You are solely responsible for determining whether any trading assets, securities, strategy, or any other product is suitable for investing based on your own investment objectives and financial situation.
          Add to Favorites
          Share

          GBP/USD: July Seasonality Favors Upside, But Is The Rally Already Overdone?

          Michelle

          Economic

          Forex

          July has historically been a bullish month for GBP/USD going back to the Bretton Woods Agreement in 1971 - will it hold this month?

          July Forex Seasonality Key Points

          • July has historically been a bullish month for GBP/USD going back to the Bretton Woods Agreement in 1971.
          • In contrast, AUD/USD and USD/CAD have tended to consolidate in July over the last 50+ years.
          • With US President Trump’s trade war in flux as we go to press, it’s worth watching the headlines to determine if deals, or more uncertainty, is likely in the second half of the year.

          The beginning of a new month marks a good opportunity to review the seasonal patterns that have influenced the forex market over the 50+ years since the Bretton Woods system was dismantled in 1971, ushering in the modern foreign exchange market.

          As always, these seasonal tendencies are just historical averages, and any individual month or year may vary from the historic average, so it’s important to complement these seasonal leans with alternative forms of analysis to create a long-term successful trading strategy. In other words, past performance is not necessarily indicative of future results.

          Euro Forex Seasonality – EUR/USD Chart

          Source: TradingView, StoneX. Please note that past performance is not necessarily indicative of future results.

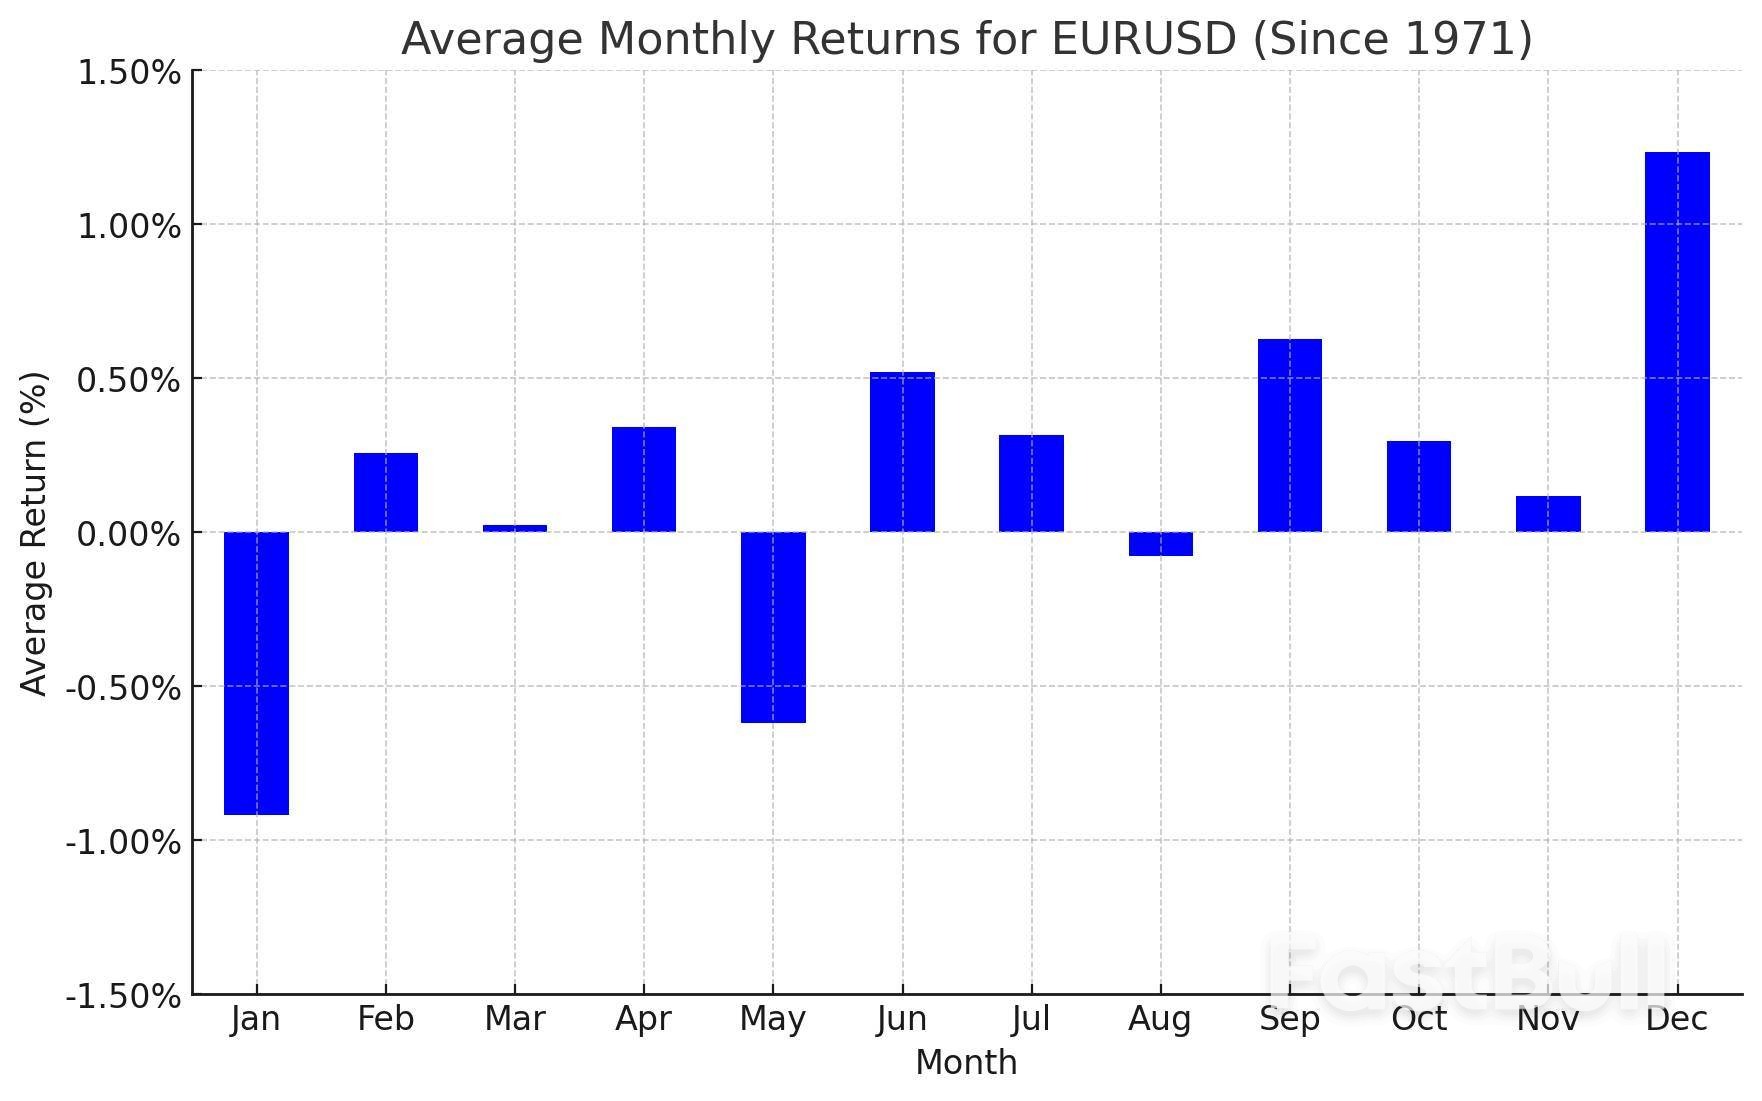
          Historically, July has been a modestly bullish month for EUR/USD, with the world’s most widely-traded currency pair sporting an average return of +0.32% over the last 50+ years. In June, EUR/USD followed its bullish seasonal trend, surging nearly 4% to reach its highest level in over 3.5 years.

          While the momentum and seasonal tendency point to the potential for continued gains in July, it’s worth noting that the pair is very stretched relative to its medium- and long-term moving averages, suggesting that a near-term dip in the first half of the month may be more likely than usual.

          British Pound Forex Seasonality – GBP/USD Chart

          Source: TradingView, StoneX. Please note that past performance is not necessarily indicative of future results.

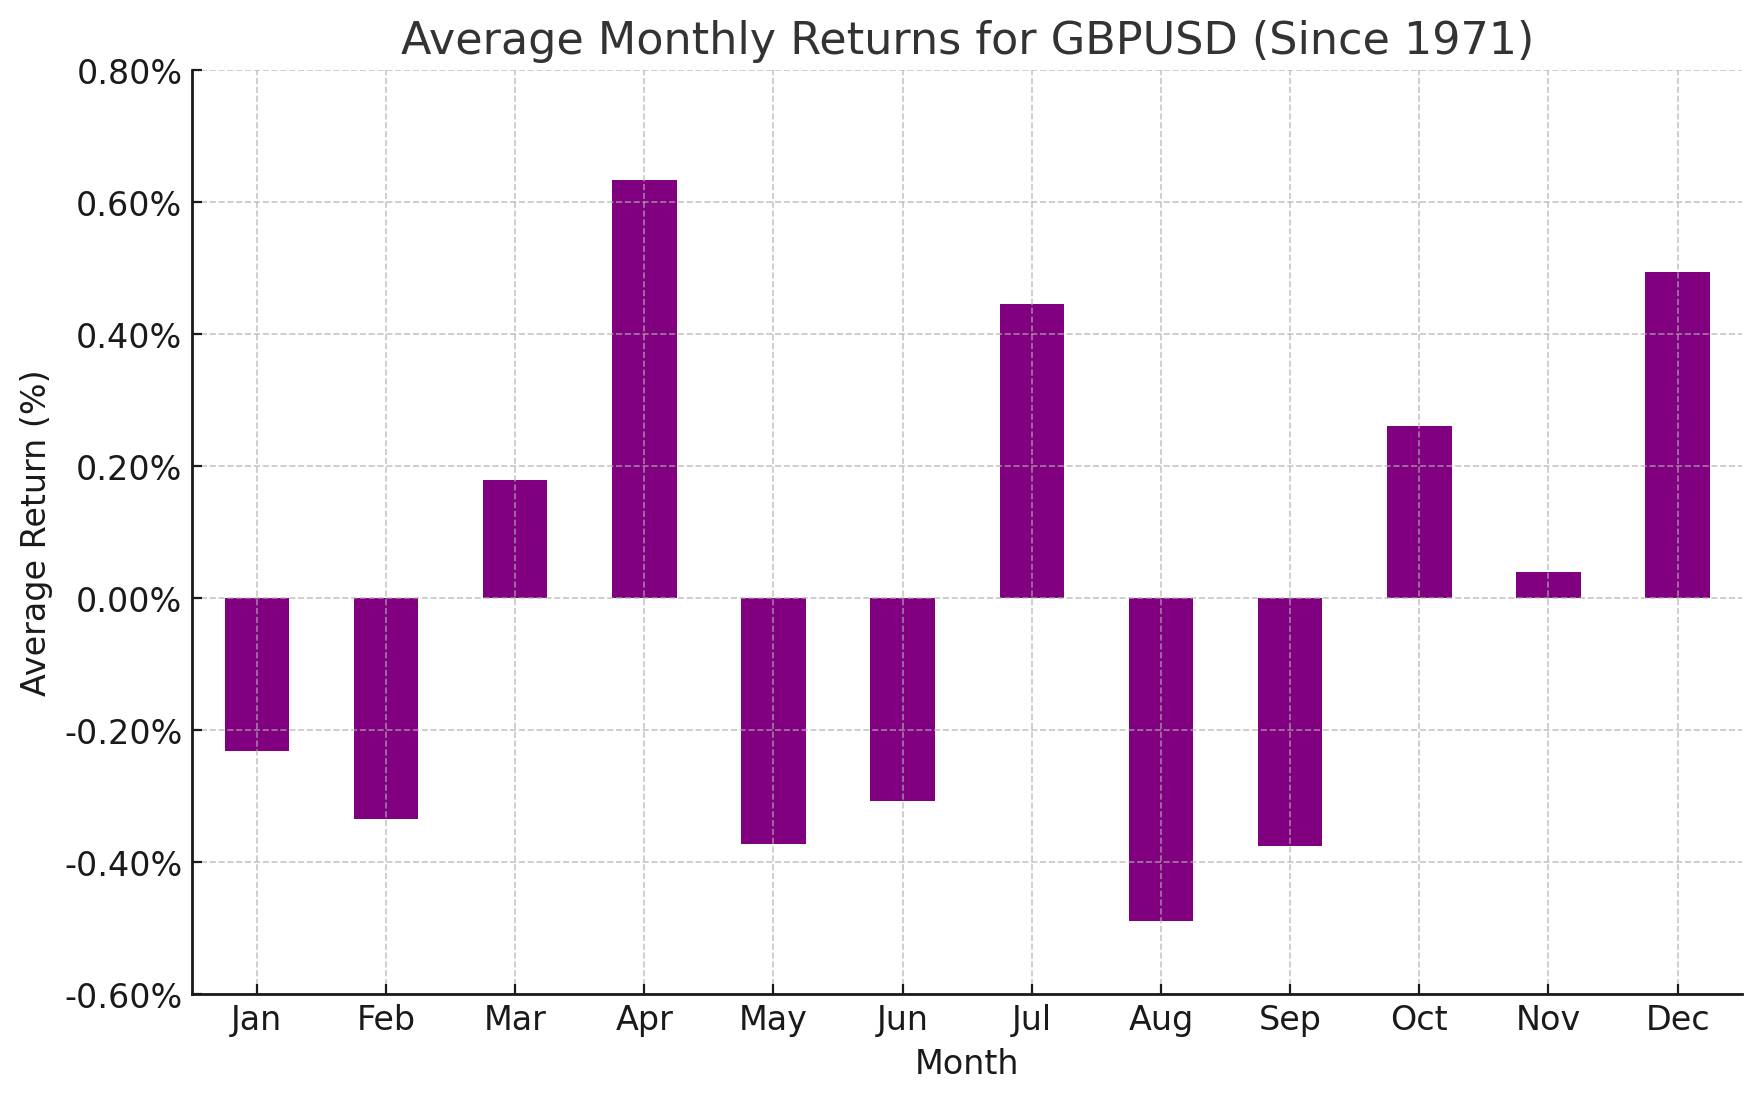
          Looking at the above chart, GBP/USD has historically seen strength in July, with average returns of around +0.45% since 1971. Like the euro, the British pound traded higher in June to reach multi-month highs amidst broad-based US dollar weakness. After a run of five straight “up” months, it may be more difficult for bulls to build on this year’s gains through the summer without a near-term pullback or consolidation first.

          Japanese Yen Forex Seasonality – USD/JPY Chart

          Source: TradingView, StoneX. Please note that past performance is not necessarily indicative of future results.

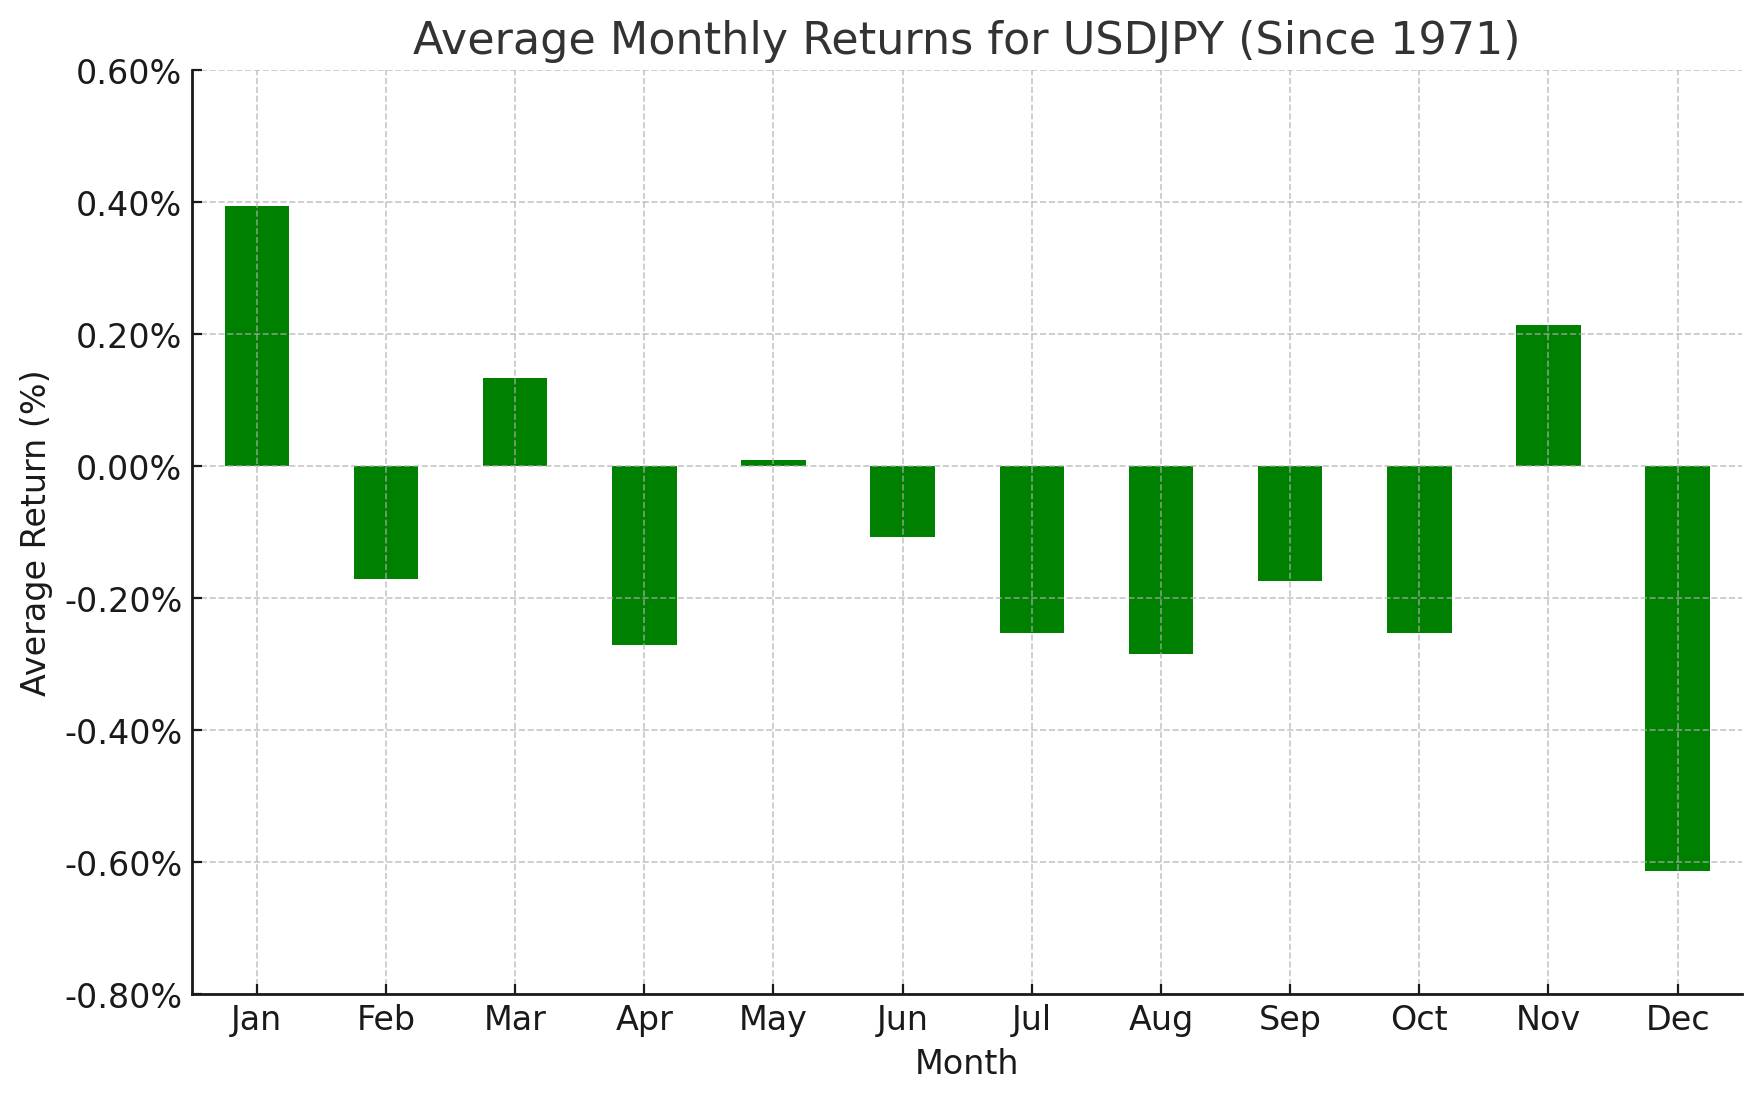
          July has historically been a modestly bearish month for USD/JPY, with the pair falling by an average of -0.25% since the Bretton Woods agreement. In line with its long-term seasonal trend, USD/JPY saw relatively quiet trade in June amidst a lack of clear progress in trade negotiations between the US and Japan. Traders will be watching the 2-year lows at 1.3950 for a potential breakdown if the seasonal trend asserts itself again this month.

          Australian Dollar Forex Seasonality – AUD/USD Chart

          Source: TradingView, StoneX. Please note that past performance is not necessarily indicative of future results.

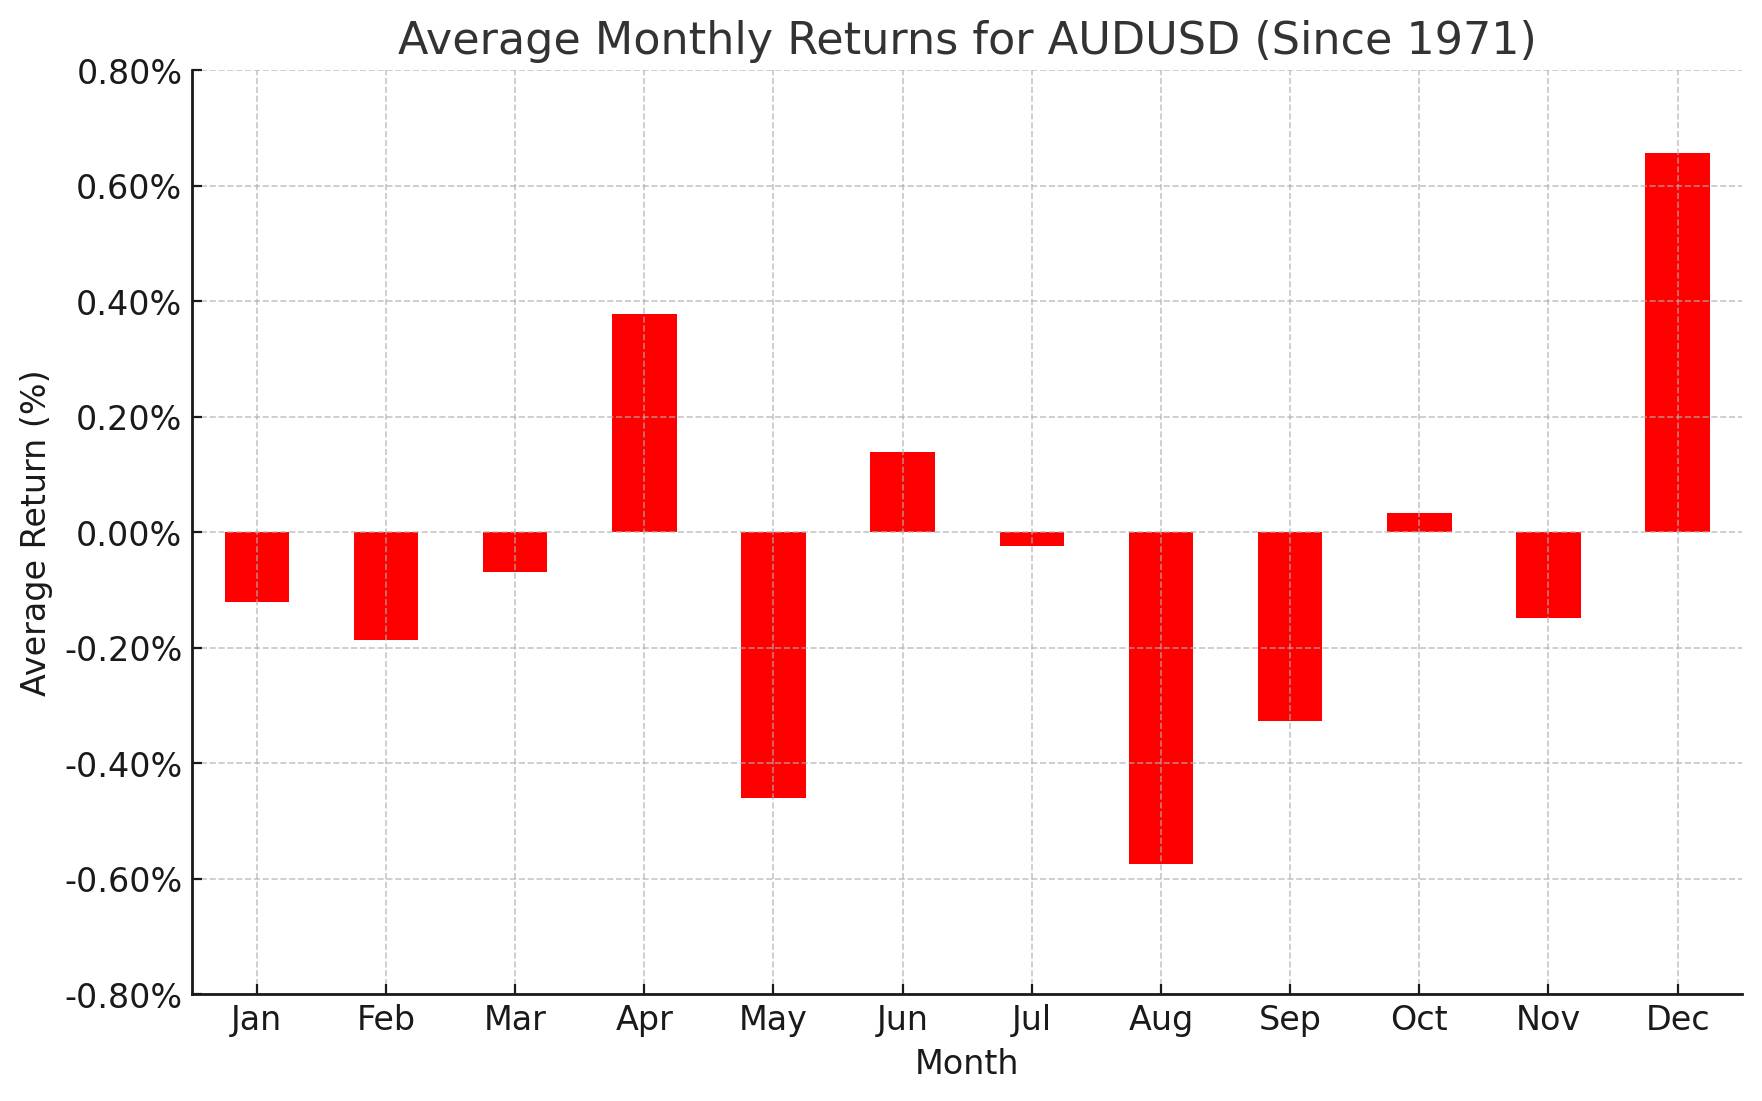
          Turning our attention Down Under, AUD/USD has historically seen quiet price action in July, with an average move of -0.2% going back to 1971. Last month, AUD/USD rallied more than 2%, following its bullish seasonal trend to break above the 61.8% Fibonacci retracement of the September 2024 to April 2025 drop at 0.6550. Following four straight positive months, a consolidation in line with the seasonal trend this month would not be surprising.

          Canadian Dollar Forex Seasonality – USD/CAD Chart

          Source: TradingView, StoneX. Please note that past performance is not necessarily indicative of future results.

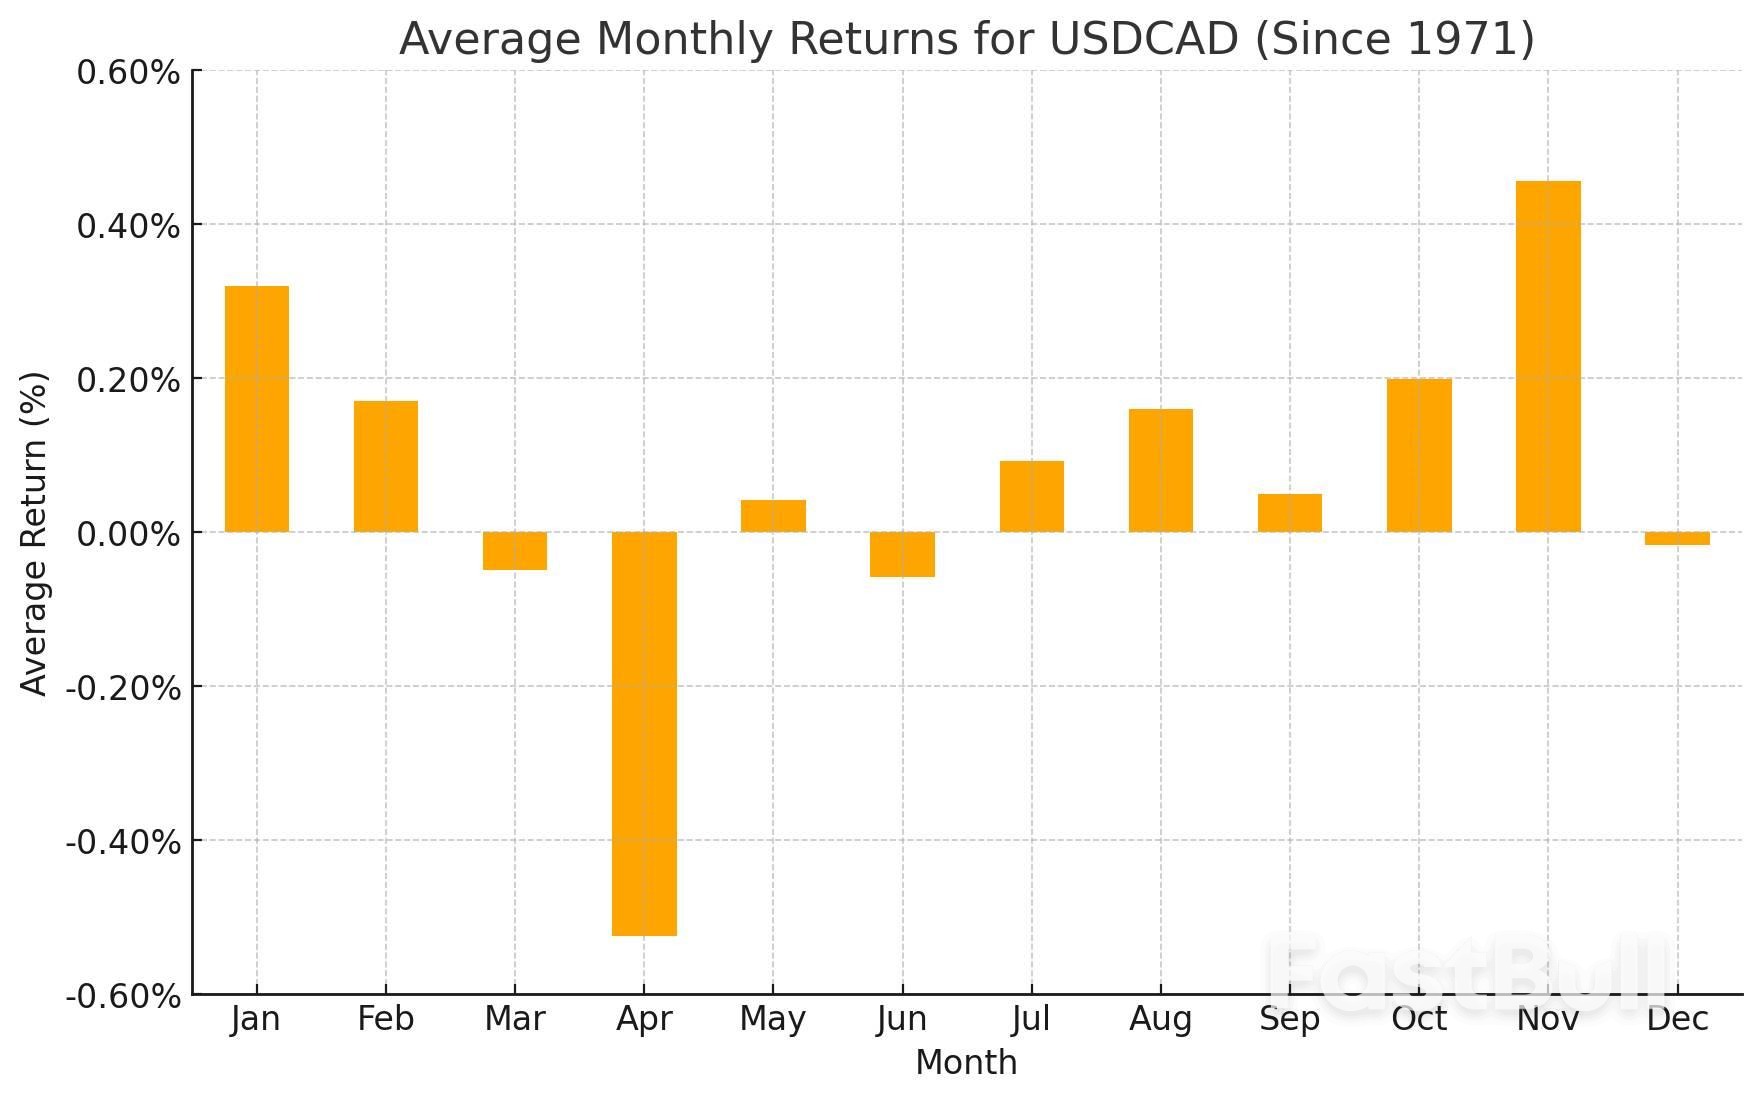
          Last but not least, July has been a modestly positive month for USD/CAD, with an average historical return of +0.09%. The US dollar fell against its Northern rival last month, and bulls are starting to warily eye the 1.5-year low at 1.3425 as a key support level that needs to hold to keep any semblance of optimism intact.

          As always, we want to close this article by reminding readers that seasonal tendencies are not gospel – even if they’ve tracked relatively closely so far this year–so it’s important to complement this analysis with an examination of the current fundamental and technical backdrops for the major currency pairs.

          Source: Investing

          To stay updated on all economic events of today, please check out our Economic calendar
          Risk Warnings and Disclaimers
          You understand and acknowledge that there is a high degree of risk involved in trading. Following any strategies or investment methods may lead to potential losses. The content on the site is provided by our contributors and analysts for information purposes only. You are solely responsible for determining whether any trading assets, securities, strategy, or any other product is suitable for investing based on your own investment objectives and financial situation.
          Add to Favorites
          Share

          Gold Steadies Near $3,330 as Traders Weigh US Jobs Data and Tax Bill Impact

          Gerik

          Economic

          Commodity

          Gold Holds Gains as Fiscal Concerns and Fed Outlook Dominate Market Focus

          Gold remained steady near $3,330 per ounce on Wednesday, consolidating its recent 2% gain across the previous two sessions. The stability in prices reflects investor hesitation as they await two key developments in the US: the June jobs report and the House decision on President Donald Trump’s expansive tax reform package.
          The Senate approved the tax bill on Tuesday, which is projected to increase the federal deficit by $3.3 trillion over the next ten years. If passed by the House, the legislation may enhance gold’s attractiveness as a hedge against fiscal deterioration, with a larger deficit potentially weakening long-term confidence in US debt markets.

          All Eyes on Labor Data as Fed Rate Cuts Hang in Balance

          Investor attention is also centered on the upcoming June employment report, due Thursday. The report is expected to show a deceleration in job creation and a slight rise in unemployment. These indicators could revive expectations for interest rate cuts by the Federal Reserve, especially if they contrast with the stronger-than-anticipated job openings figure released on Tuesday, which had briefly cooled rate cut hopes.
          Gold, which does not yield interest, tends to benefit in environments of declining interest rates, as the opportunity cost of holding the metal diminishes. The upcoming jobs data thus holds critical implications for the Fed’s trajectory and, by extension, for bullion prices.

          Geopolitical Risks and Central Bank Demand Provide a Supportive Backdrop

          Beyond macroeconomic indicators, gold continues to draw strength from sustained geopolitical risks and strong institutional demand. Since the beginning of 2025, gold has risen more than 25%, driven by concerns over global trade tensions, unpredictable tariff policy from Washington, and ongoing regional conflicts. These factors have underpinned demand for safe-haven assets.
          Additionally, consistent central bank purchases and increasing inflows into gold-backed ETFs have provided a structural base for price support. Despite recent volatility, gold remains just $170 shy of its all-time high set in April, indicating resilient bullish sentiment.

          Market Sentiment Mixed Amid Broader Economic Stability

          Although President Trump has indicated he will not postpone the July 9 deadline for new tariffs, market reactions have been more subdued than in previous trade standoffs. This suggests a shifting investor calculus, where solid macroeconomic fundamentals in the US are beginning to offset fears of sudden policy shocks.
          The Bloomberg Dollar Spot Index rose 0.1% on the day, though it remains down 0.5% for the week. A softer dollar generally supports gold by making it cheaper for overseas buyers. Other precious metals showed limited movement, with silver and platinum remaining flat, while palladium saw modest gains.
          Gold’s performance near $3,330 reflects a cautious optimism as investors await near-term signals from Washington and the labor market. While macro uncertainty continues to support the metal’s long-term case, traders are now positioning for clarity on the Fed’s policy direction and the fiscal implications of the US tax bill. If Thursday’s data aligns with cooling labor trends and fiscal risks escalate, gold could find renewed upward momentum toward retesting its April highs.

          Source: Bloomberg

          To stay updated on all economic events of today, please check out our Economic calendar
          Risk Warnings and Disclaimers
          You understand and acknowledge that there is a high degree of risk involved in trading. Following any strategies or investment methods may lead to potential losses. The content on the site is provided by our contributors and analysts for information purposes only. You are solely responsible for determining whether any trading assets, securities, strategy, or any other product is suitable for investing based on your own investment objectives and financial situation.
          Add to Favorites
          Share

          Renewed Feud Between Musk And Trump Drags Tesla (TSLA) Share Price Lower

          FXOpen

          Economic

          Stocks

          The US Senate yesterday narrowly approved Trump’s so-called “big, beautiful budget bill.”

          Elon Musk, who had previously criticised the bill for potentially adding $3.3 trillion to the national debt, warned that Republican lawmakers who supported it would face political consequences. In a post on X, Musk wrote:“Every member of Congress who campaigned on reducing government spending and then immediately voted for the biggest debt increase in history should hang their head in shame! And they will lose their primary next year if it is the last thing I do on this Earth.”

          He also reiterated his intention to establish a third political force under the name “America Party.”

          In response, President Trump issued sharp threats:

          → to apply federal pressure on Musk’s companies by revisiting existing subsidies and government contracts (estimated by The Washington Post at $38 billion);

          → to deport Musk back to South Africa.

          The market responded immediately to this renewed escalation in the Trump–Musk conflict. Tesla (TSLA) shares fell by over 5% yesterday, forming a significant bearish gap.

          Technical Analysis of TSLA Stock Chart

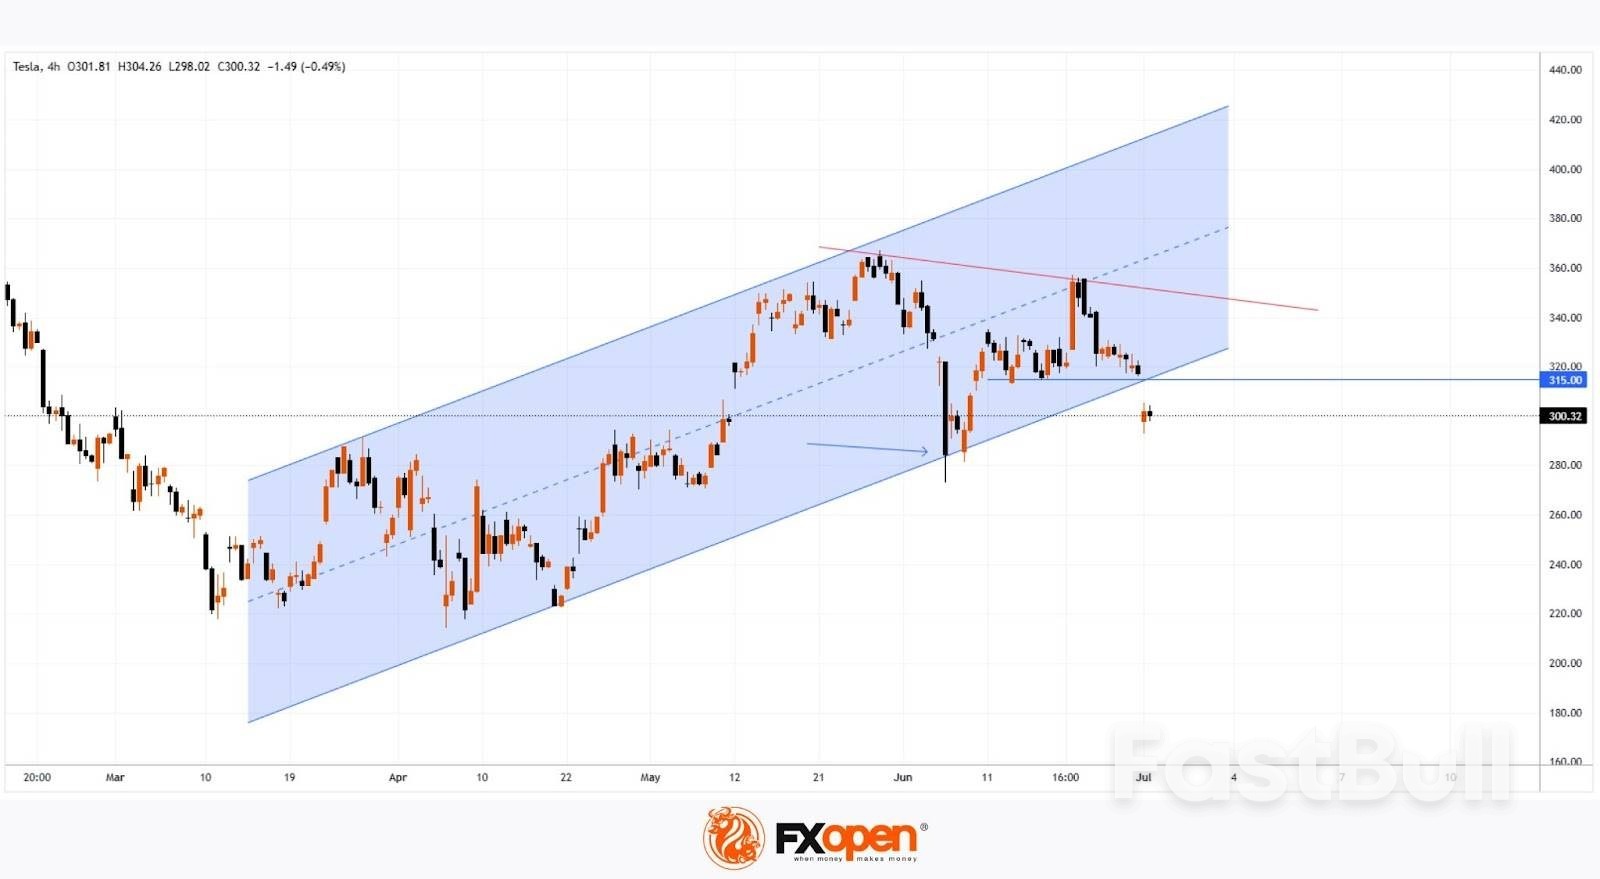
          Eight days ago, we analysed the TSLA price chart, continuing to observe price action within the context of an ascending channel (indicated in blue). At that point:

          → In mid-June, when the initial Musk–Trump tensions surfaced, TSLA managed to hold within the channel. However, as of yesterday, the price broke below the lower boundary, casting doubt on the sustainability of the uptrend that had been in place since March–April;

          → The price breached the lower channel limit near the $315 level — a zone that previously acted as support. This suggests that $315 may now serve as a resistance level.

          As a result, optimism related to the late-June launch of Tesla’s robotaxi initiative has been eclipsed by concerns that the Musk–Trump confrontation may have broader implications.

          If the former allies refrain from further escalation, TSLA may consolidate into a broadening contracting triangle (its upper boundary marked in red) in the near term, ahead of Tesla’s Q2 earnings release scheduled for 29 July.

          Source: FXOpen

          To stay updated on all economic events of today, please check out our Economic calendar
          Risk Warnings and Disclaimers
          You understand and acknowledge that there is a high degree of risk involved in trading. Following any strategies or investment methods may lead to potential losses. The content on the site is provided by our contributors and analysts for information purposes only. You are solely responsible for determining whether any trading assets, securities, strategy, or any other product is suitable for investing based on your own investment objectives and financial situation.
          Add to Favorites
          Share

          Vietnam Activates International Financial Center: A Strategic Inflection Point for Domestic Fintechs

          Gerik

          Economic

          From Financial Hub to Innovation Ecosystem: Redefining the International Financial Center Model

          In the digital era, International Financial Centers (IFSCs) are evolving beyond their traditional role as capital aggregators. They now function as innovation ecosystems tightly interwoven with financial technology (fintech). According to the Bank for International Settlements (BIS), fintech has the potential to revolutionize the delivery of financial services, foster new business models, and promote sustainable financial ecosystems.
          In Asia, countries like Singapore, Hong Kong (China), and Shanghai have already positioned their IFSCs as fintech accelerators. Singapore’s Monetary Authority (MAS), for instance, introduced a FinTech Regulatory Sandbox in 2016—later upgraded to Sandbox Plus—to fast-track regulatory approval and financial support for innovation. Simultaneously, the city-state has invested in open banking, financial data infrastructure, and capital access, placing fintech at the heart of its digital economy strategy.
          Hong Kong, meanwhile, attracted significant foreign investment by licensing digital banks such as WeLab, ZA Bank, and Mox Bank, embedding fintech into its modern financial architecture. Shanghai’s roadmap to becoming an IFSC by 2035 includes leveraging green finance and blockchain technology, aiming to make fintech a direct contributor to national financial objectives.

          Vietnam's Fintech Moment: A Policy Breakthrough with Strategic Ambition

          Vietnam has entered the fintech race with renewed determination. On June 27, 2025, the National Assembly passed a resolution to establish an International Financial Center, effective from September 1, 2025. The resolution outlines preferential policies, including a regulatory sandbox for fintech innovation, designed to test and validate emerging financial services under controlled conditions.
          With a GDP ranked among the world’s top 32, Vietnam’s ambition is not merely to catch up but to assert a position on the regional financial map. The sandbox mechanism will serve as both an incubator and a filter, allowing qualified fintechs to experiment with services such as micro-lending, digital insurance, and asset tokenization before commercial launch.
          Vice Governor of the State Bank of Vietnam, Phạm Tiến Dũng, emphasized that Vietnam’s fintech regulations are gradually maturing. He views the new financial center not only as a magnet for foreign capital but also as a stress test for the local financial ecosystem’s capacity for innovation and resilience.

          Emerging Players and Early Momentum in Vietnam's Fintech Sector

          Companies such as Viettel Money, Timo, and VnPay have already gained strong footholds by offering comprehensive digital financial services and building robust user bases. These firms are expected to be early participants in the sandbox environment after July 1, positioning themselves to refine and scale their products regionally. The shift from legacy systems to agile, tech-driven financial platforms will likely accelerate with regulatory support and investment incentives provided through the new IFSC.
          The potential for these fintechs to lead Vietnam’s digital finance sector lies in their ability to balance innovation with compliance. Data privacy, risk governance, and cross-border regulatory alignment will be critical metrics as they seek to attract funding and form international partnerships.

          Lessons from Asia’s Leading Financial Centers

          Singapore, Hong Kong, and Shanghai demonstrate that fintech success requires more than favorable market conditions. Institutional strength, flexible yet robust policy frameworks, and strategic foresight are equally important. For Vietnam, establishing an IFSC will require coordinated efforts among government agencies, financial regulators, and private-sector stakeholders.
          Access to global capital, exposure to advanced technologies, and the transfer of international financial expertise will offer Vietnamese fintechs a chance to integrate into high-value regional financial networks. However, this also exposes them to increased scrutiny and competition, particularly in areas such as cybersecurity standards, transaction transparency, and capital adequacy.

          Fintech Vietnam at a Strategic Crossroads

          Vietnam’s new IFSC initiative marks a pivotal moment for the country’s fintech sector. It is both a platform for innovation and a testing ground for global integration. While regulatory sandboxes offer a low-risk space for trial, the broader challenge lies in building institutional capabilities that align with international financial norms.
          Success will depend not only on regulatory support but also on the fintech community’s preparedness to scale, comply, and compete. If Vietnamese firms can meet these demands, they will not only help elevate the country’s financial status but also contribute meaningfully to the transformation of Asia’s digital economy. The coming years will determine whether Vietnam can move from ambition to realization and secure its place among the region’s emerging financial powers.
          To stay updated on all economic events of today, please check out our Economic calendar
          Risk Warnings and Disclaimers
          You understand and acknowledge that there is a high degree of risk involved in trading. Following any strategies or investment methods may lead to potential losses. The content on the site is provided by our contributors and analysts for information purposes only. You are solely responsible for determining whether any trading assets, securities, strategy, or any other product is suitable for investing based on your own investment objectives and financial situation.
          Add to Favorites
          Share
          FastBull
          Copyright © 2025 FastBull Ltd

          728 RM B 7/F GEE LOK IND BLDG NO 34 HUNG TO RD KWUN TONG KLN HONG KONG

          TelegramInstagramTwitterfacebooklinkedin
          App Store Google Play Google Play
          Products
          Charts

          Chats

          Q&A with Experts
          Screeners
          Economic Calendar
          Data
          Tools
          Membership
          Features
          Function
          Markets
          Copy Trading
          Latest Signals
          Contests
          News
          Analysis
          24/7
          Columns
          Education
          Company
          Careers
          About Us
          Contact Us
          Advertising
          Help Center
          Feedback
          User Agreement
          Privacy Policy
          Business

          White Label

          Data API

          Web Plug-ins

          Poster Maker

          Affiliate Program

          Risk Disclosure

          The risk of loss in trading financial instruments such as stocks, FX, commodities, futures, bonds, ETFs and crypto can be substantial. You may sustain a total loss of the funds that you deposit with your broker. Therefore, you should carefully consider whether such trading is suitable for you in light of your circumstances and financial resources.

          No decision to invest should be made without thoroughly conducting due diligence by yourself or consulting with your financial advisors. Our web content might not suit you since we don't know your financial conditions and investment needs. Our financial information might have latency or contain inaccuracy, so you should be fully responsible for any of your trading and investment decisions. The company will not be responsible for your capital loss.

          Without getting permission from the website, you are not allowed to copy the website's graphics, texts, or trademarks. Intellectual property rights in the content or data incorporated into this website belong to its providers and exchange merchants.

          Not Logged In

          Log in to access more features

          FastBull Membership

          Not yet

          Purchase

          Become a signal provider
          Help Center
          Customer Service
          Dark Mode
          Price Up/Down Colors

          Log In

          Sign Up

          Position
          Layout
          Fullscreen
          Default to Chart
          The chart page opens by default when you visit fastbull.com