


- XAUUSD
- XAGUSD
- WTI
- USDX


行情
分析
用户
快讯
财经日历
学习
数据
- 名称
- 最新值
- 前值


Ether price is up 11% since plunging below the $3,000 mark on Nov. 22, reclaiming key support levels. Analysts say that increased demand from institutions, coupled with the end of quantitative tightening, could lead to a recovery toward $3,600 next.
Key takeaways:
Ethereum demand is recovering along with ETF inflows.
The end of the Fed’s QT on Dec. 1 will unlock liquidity into crypto markets.
Ether’s V-shaped chart pattern hints at a $3,600 target if key support holds.
Ether’s apparent demand hits a 26-month high
Ethereum’s Apparent Demand has remained positive despite the recent drawdown and has risen to its highest level since September 2024.
Apparent Demand is a metric that gauges Ether’s market demand by measuring the difference between the daily ETH issuance and the change in inventory (supply that has been inactive for over one year. Positive values suggest rising demand.
Capriole Investment’s Bitcoin Apparent Demand metric reveals that demand for Ether has increased sharply to 90,995 ETH on Nov. 26, from 37,990 ETH on Nov. 22.
Related: High percentage of Bitcoin, ETH, SOL held at a loss: Is it a bear market sign?
Increasing ETH demand amid drawdown signals aggressive accumulation on price dips, pointing to an imminent rebound.
The last time demand was this high was in September 2023, when the price was hovering between $1,500 and $1,700 after a 25% drawdown. This was followed by a 165% rally to $4,100 in March 2024.
Meanwhile, spot Ethereum ETF flows have flipped positive, recording inflows for three consecutive days, totaling $230.9 million.
The reversal followed a punishing stretch from Nov. 11–20, when Ethereum funds shed a combined $1.28 billion, one of the longest and deepest red waves since the ETFs launched.
Part of Ether’s ability to sustain a recovery above the $2,800 support comes from expectations that increased demand and ETF inflows will provide tailwinds that will push the ETH price higher.
End of QT: History backs Ether’s price rebound
The US Federal Reserve is expected to end Quantitative Tightening (QT) on Dec. 1, something that has historically preceded parabolic ETH rallies.
When QT ends, liquidity returns to the market, and risk assets typically rebound.
“QT ends on Dec. 1 - it’s a good time to zoom out and look at how crypto behaved the last time this happened,” crypto analysts Front Runners said in their latest post on X.
An accompanying chart reveals that altcoins “actually outperformed $BTC after QT ended” in the previous cycle, the analysts wrote, adding:
The chart above also shows that Bitcoin dominance topped immediately after QT and then continued to trend lower, forming a double top during the COVID-19 period before resuming its decline.
“The difference this time is that BTC is already below the 50W SMA, last cycle it only lost that level well after QT ended,” Front Runners added.
If history repeats, the end of QT will ignite a liquidity rotation that could propel altcoins, led by ETH, to outperform Bitcoin (BTC) in the coming months.
The key cost basis area is around $2,800
According to Ether’s cost basis distribution data, investors acquired approximately 4.95 million ETH at an average cost of between $2,800 and $2,830, creating a potential support zone.
This concentration suggests many investors may defend the price around this level, which could make this a launchpad for a rally.
Analysts say ETH must hold this support at $2,800 for the bulls to regain their footing.
“Ethereum is trading back at its big $2.8K level, which has acted as a strong support and resistance throughout this entire cycle,” said Daan Crypto Trades in a Monday X post, adding:
As Cointelegraph reported, a break and close below $2,800 could signal the start of the next leg of the downmove to $2,400 and then to the $2,100 level.
Ether’s V-shaped chart pattern targets $3,600
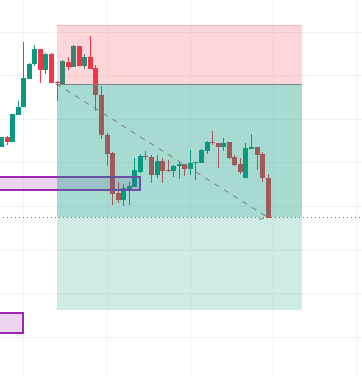
From a technical perspective, Ether’s price action has been forming a potential V-shaped chart pattern on the four-hour chart since early November, as shown below.
ETH now trades below a key supply zone between $3,000 and $3,500, where the 100-period and 200-period simple moving averages (SMAs) sit.
Bulls need to push the price above this area to increase the chances of the price rising to the neckline at $3,650 and completing the V-shaped pattern. Such a move would represent a 26% price increase from the current levels.
On the downside, the 50 SMA provided key support at $2,891, reinforcing the importance of this demand area, as mentioned earlier.
Commenting on the ETH/BTC chart, Michael van de Poppe, founder of MN Capital, said that ETH was preparing for a strong upward move in the coming weeks.
Michaël van de Poppe@CryptoMichNLNov 26, 2025This chart remains super interesting, as I think that we'll see a strong breakout upwards in the coming weeks for $ETH.
I repeat: This cycle is far from over. pic.twitter.com/T1wFgVAN44
This article does not contain investment advice or recommendations. Every investment and trading move involves risk, and readers should conduct their own research when making a decision.
728 RM B 7/F GEE LOK IND BLDG NO 34 HUNG TO RD KWUN TONG KLN HONG KONG


交易股票、货币、商品、期货、债券、基金等金融工具或加密货币属高风险行为,这些风险包括损失您的部分或全部投资金额,所以交易并非适合所有投资者。
做出任何财务决定时,应该进行自己的尽职调查,运用自己的判断力,并咨询合格的顾问。本网站的内容并非直接针对您,我们也未考虑您的财务状况或需求。本网站所含信息不一定是实时提供的,也不一定是准确的。本站提供的价格可能由做市商而非交易所提供。您做出的任何交易或其他财务决定均应完全由您负责,并且您不得依赖通过网站提供的任何信息。我们不对网站中的任何信息提供任何保证,并且对因使用网站中的任何信息而可能造成的任何交易损失不承担任何责任。
未经本站书面许可,禁止使用、存储、复制、展现、修改、传播或分发本网站所含数据。提供本网站所含数据的供应商及交易所保留其所有知识产权。


