

Markets
News
Analysis
User
24/7
Economic Calendar
Education
Data
- Names
- Latest
- Prev


Signal Accounts for Members
All Signal Accounts
All Contests
 U.S. Weekly Total Rig Count
A:--
F: --
P: --
U.S. Weekly Total Oil Rig CountA:--
F: --
P: --
 China, Mainland 5-Year Loan Prime Rate
A:--
F: --
P: --
China, Mainland 1-Year Loan Prime Rate (LPR)A:--
F: --
P: --
 U.K. Current Account (Q3)
A:--
F: --
U.K. GDP Final YoY (Q3)A:--
F: --
P: --
U.K. GDP Final QoQ (Q3)A:--
F: --
 Italy PPI YoY (Nov)
A:--
F: --
P: --
 Mexico Economic Activity Index YoY (Oct)
A:--
F: --
P: --
 Canada National Economic Confidence Index
A:--
F: --
P: --
Canada Industrial Product Price Index YoY (Nov)A:--
F: --
U.S. Chicago Fed National Activity Index (Nov)A:--
F: --
Canada Industrial Product Price Index MoM (Nov)A:--
F: --
U.S. 2-Year Note Auction Avg. YieldA:--
F: --
P: --
 RBA Monetary Policy Meeting Minutes Mexico Trade Balance (Nov)
A:--
F: --
P: --
Canada GDP YoY (Oct)A:--
F: --
P: --
Canada GDP MoM (SA) (Oct)A:--
F: --
P: --
U.S. Core PCE Price Index Prelim YoY (Q3)A:--
F: --
P: --
U.S. PCE Price Index Prelim YoY (Q3)A:--
F: --
P: --
U.S. Annualized Real GDP Prelim (Q3)A:--
F: --
P: --
U.S. Non-Defense Capital Durable Goods Orders MoM (Excl. Aircraft) (Oct)A:--
F: --
U.S. PCE Price Index Prelim QoQ (SA) (Q3)A:--
F: --
P: --
U.S. Core PCE Price Index Annualized QoQ Prelim (SA) (Q3)A:--
F: --
P: --
U.S. GDP Deflator Prelim QoQ (SA) (Q3)A:--
F: --
P: --
U.S. Durable Goods Orders MoM (Excl. Defense) (SA) (Oct)A:--
F: --
P: --
U.S. Durable Goods Orders MoM (Excl.Transport) (Oct)A:--
F: --
U.S. Real Personal Consumption Expenditures Prelim QoQ (Q3)A:--
F: --
P: --
U.S. Real GDP Annualized QoQ Prelim (SA) (Q3)A:--
F: --
P: --
U.S. Durable Goods Orders MoM (Oct)A:--
F: --
U.S. Weekly Redbook Index YoY--
F: --
P: --
U.S. Manufacturing Output MoM (SA) (Nov)--
F: --
P: --
U.S. Manufacturing Capacity Utilization (Nov)--
F: --
P: --
U.S. Industrial Output YoY (Oct)--
F: --
P: --
U.S. Industrial Output MoM (SA) (Nov)--
F: --
P: --
U.S. Capacity Utilization MoM (SA) (Nov)--
F: --
P: --
U.S. Richmond Fed Manufacturing Shipments Index (Dec)--
F: --
P: --
U.S. Richmond Fed Services Revenue Index (Dec)--
F: --
P: --
U.S. Conference Board Consumer Expectations Index (Dec)--
F: --
P: --
U.S. Conference Board Present Situation Index (Dec)--
F: --
P: --
U.S. Richmond Fed Manufacturing Composite Index (Dec)--
F: --
P: --
U.S. Conference Board Consumer Confidence Index (Dec)--
F: --
P: --
U.S. 5-Year Note Auction Avg. Yield--
F: --
P: --
U.S. Weekly Total Oil Rig Count--
F: --
P: --
U.S. Weekly Total Rig Count--
F: --
P: --
U.S. API Weekly Cushing Crude Oil Stocks--
F: --
P: --
U.S. API Weekly Crude Oil Stocks--
F: --
P: --
U.S. API Weekly Refined Oil Stocks--
F: --
P: --
U.S. API Weekly Gasoline Stocks--
F: --
P: --
Mexico Unemployment Rate (Not SA) (Nov)--
F: --
P: --
U.S. MBA Mortgage Application Activity Index WoW--
F: --
P: --
U.S. Weekly Continued Jobless Claims (SA)--
F: --
P: --
U.S. Weekly Initial Jobless Claims (SA)--
F: --
P: --
U.S. Initial Jobless Claims 4-Week Avg. (SA)--
F: --
P: --
U.S. EIA Weekly Crude Oil Imports Changes--
F: --
P: --
U.S. EIA Weekly Heating Oil Stock Changes--
F: --
P: --
Canada Federal Government Budget Balance (Oct)--
F: --
P: --
 Japan Construction Orders YoY (Nov)
--
F: --
P: --
Japan New Housing Starts YoY (Nov)--
F: --
P: --
 Turkey Capacity Utilization (Dec)
--
F: --
P: --


No matching data
Latest Views
Latest Views
Trending Topics
Top Columnists
Latest Update
White Label
Data API
Web Plug-ins
Affiliate Program
View All
No data
Yesterday, Japanese finance ministry officials signaled intervention, causing a sharp pullback in the USDJPY, but the upward trend remains intact.
156.051
Entry Price
160.100
TP
154.300
SL
0.0
Pips
Flat
154.300
SL
Exit Price
156.051
Entry Price
160.100
TP

During Tuesday's Asian session, silver prices printed a record high of 69.90 per ounce and were last quoted around 69.40. Escalating U.S.–Venezuela tensions are channeling safe-haven flows into precious metals, with silver a key beneficiary.
69.535
Entry Price
60.000
TP
75.000
SL
0.0
Pips
Flat
60.000
TP
Exit Price
69.535
Entry Price
75.000
SL


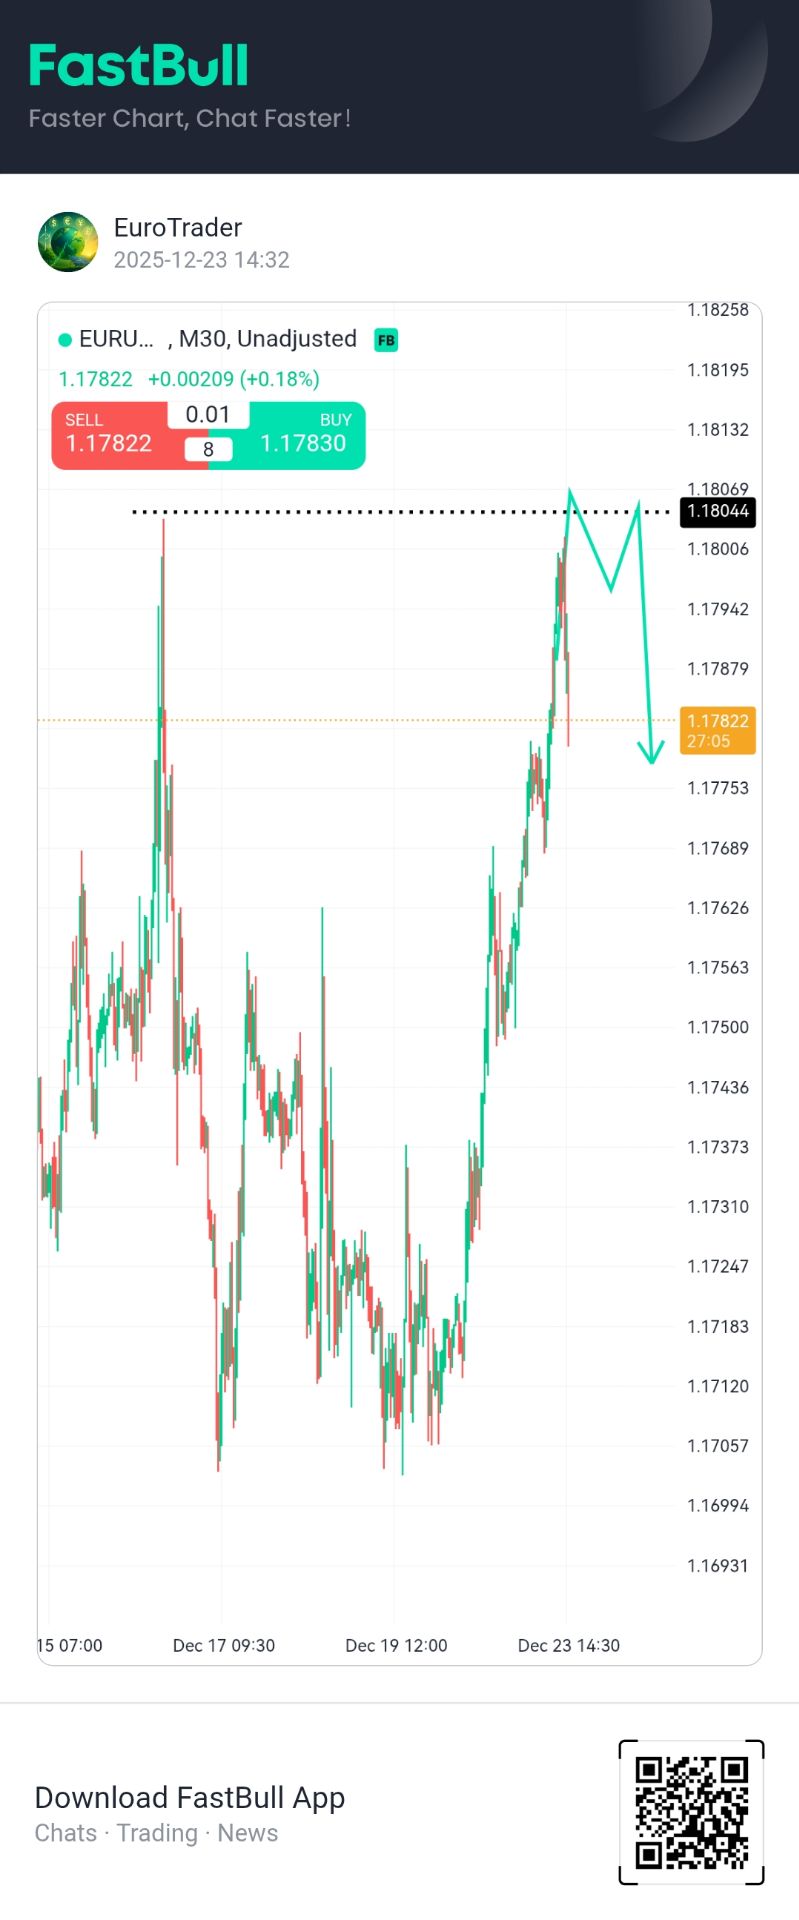
A decisive break below this support level would likely clear the path for a new bearish impulse, with a rapid downside target set at 1.3650.
1.37376
Entry Price
1.36500
TP
1.37850
SL
0.0
Pips
Flat
1.36500
TP
Exit Price
1.37376
Entry Price
1.37850
SL

This area represents a high-tension pivot, as oscillating indicators like the RSI and MACD suggest the bullish momentum may be nearing exhaustion.
0.66700
Entry Price
0.66270
TP
0.66820
SL
12.0
Pips
Loss
0.66270
TP
0.66820
Exit Price
0.66700
Entry Price
0.66820
SL

USDJPY is trading near 157.3–157.8, with the pair pressing toward the upper end of its yearly range as market forces reflect sustained yen weakness and persistent interest rate differentials....
157.100
Entry Price
157.850
TP
152.900
SL
--
Pips
PENDING
152.900
SL
Exit Price
157.100
Entry Price
157.850
TP

BTCUSD has rebounded and is holding around $88,800–$90,000, with buyers stepping in near support after recent consolidation....
89500.0
Entry Price
91400.0
TP
88100.0
SL
1400.0
Pips
Loss
88100.0
SL
88098.8
Exit Price
89500.0
Entry Price
91400.0
TP

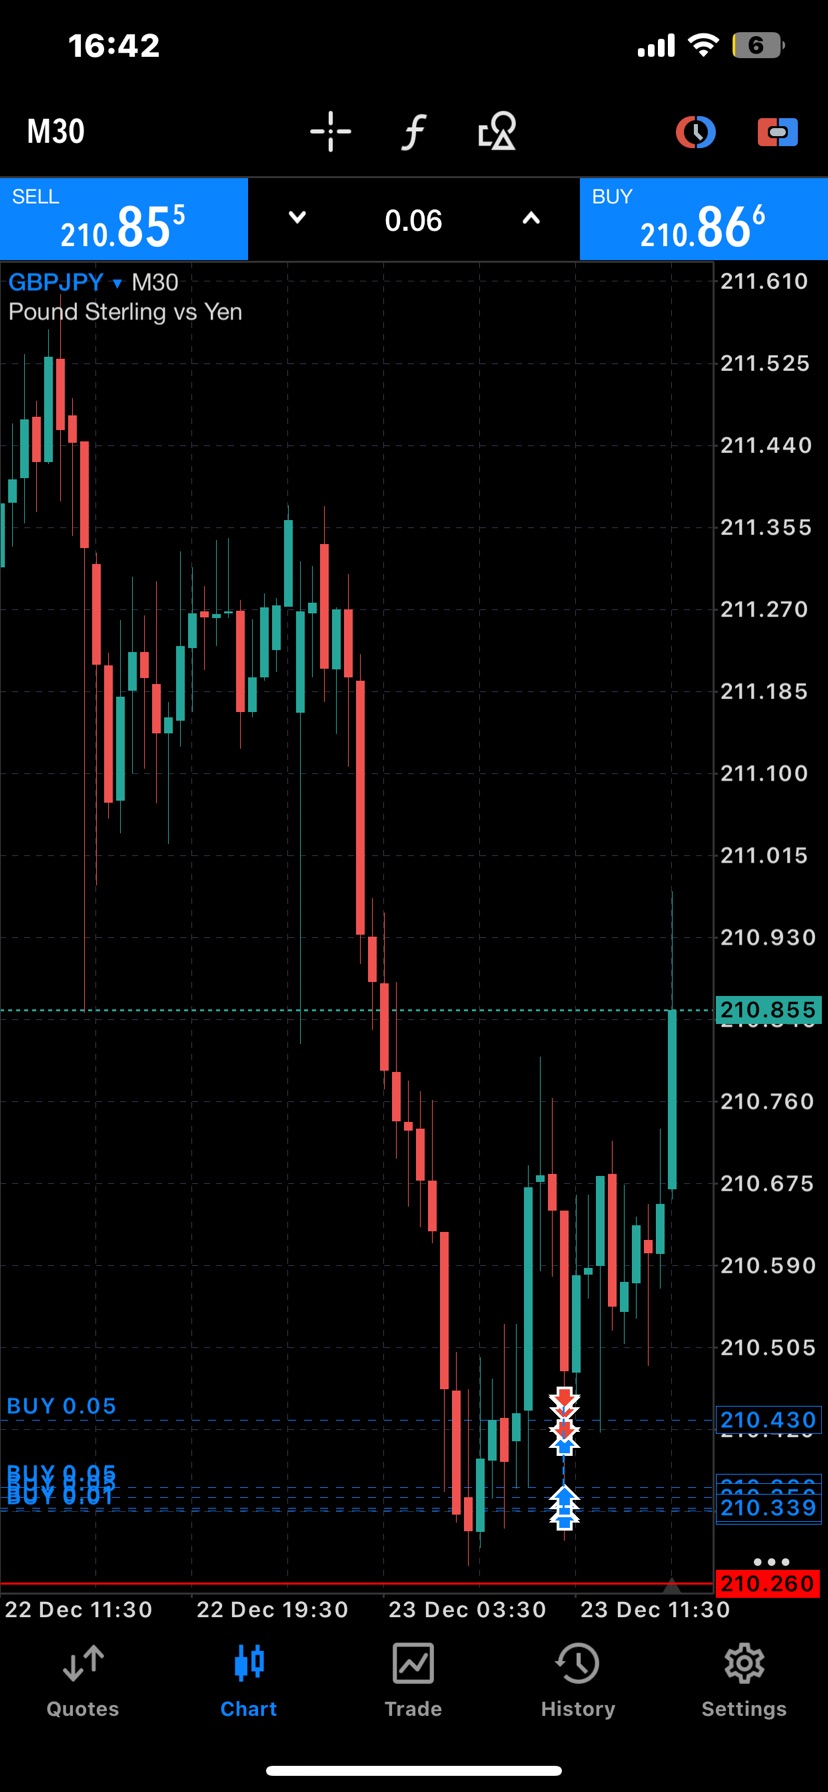
GBP/JPY trades above 211 as resilient UK growth data supports Sterling, while BoJ tightening and intervention risks limit upside, keeping the broader trend bullish but increasingly stretched.
211.401
Entry Price
213.250
TP
209.800
SL
0.0
Pips
Flat
209.800
SL
Exit Price
211.401
Entry Price
213.250
TP

728 RM B 7/F GEE LOK IND BLDG NO 34 HUNG TO RD KWUN TONG KLN HONG KONG


White Label
Data API
Web Plug-ins
Poster Maker
Affiliate Program
The risk of loss in trading financial instruments such as stocks, FX, commodities, futures, bonds, ETFs and crypto can be substantial. You may sustain a total loss of the funds that you deposit with your broker. Therefore, you should carefully consider whether such trading is suitable for you in light of your circumstances and financial resources.
No decision to invest should be made without thoroughly conducting due diligence by yourself or consulting with your financial advisors. Our web content might not suit you since we don't know your financial conditions and investment needs. Our financial information might have latency or contain inaccuracy, so you should be fully responsible for any of your trading and investment decisions. The company will not be responsible for your capital loss.
Without getting permission from the website, you are not allowed to copy the website's graphics, texts, or trademarks. Intellectual property rights in the content or data incorporated into this website belong to its providers and exchange merchants.
Not Logged In
Log in to access more features

FastBull Membership
Not yet
Purchase


Log In
Sign Up


