• Trade
  • Markets
  • Copy
  • Contests
  • News
  • 24/7
  • Calendar
  • Q&A
  • Chats
Screeners
SYMBOL
LAST
ASK
BID
HIGH
LOW
NET CHG.
%CHG.
SPREAD
SPX
S&P 500 Index
6978.59
6978.59
6978.59
6988.81
6958.82
+28.36
+ 0.41%
--
DJI
Dow Jones Industrial Average
49003.40
49003.40
49003.40
49157.80
48862.52
-408.99
-0.83%
--
IXIC
NASDAQ Composite Index
23817.11
23817.11
23817.11
23865.26
23694.38
+215.76
+ 0.91%
--
USDX
US Dollar Index
95.860
95.940
95.860
96.020
95.770
+0.320
+ 0.33%
--
EURUSD
Euro / US Dollar
1.19984
1.19991
1.19984
1.20439
1.19746
-0.00408
-0.34%
--
GBPUSD
Pound Sterling / US Dollar
1.38097
1.38108
1.38097
1.38466
1.37885
-0.00372
-0.27%
--
XAUUSD
Gold / US Dollar
5262.03
5262.46
5262.03
5266.29
5157.13
+83.45
+ 1.61%
--
WTI
Light Sweet Crude Oil
62.724
62.754
62.724
62.842
62.192
+0.287
+ 0.46%
--

Community Accounts

Signal Accounts
--
Profit Accounts
--
Loss Accounts
--
View More

Become a signal provider

Sell trading signals to earn additional income

View More

Guide to Copy Trading

Get started with ease and confidence

View More

Signal Accounts for Members

All Signal Accounts

Best Return
  • Best Return
  • Best P/L
  • Best MDD
Past 1W
  • Past 1W
  • Past 1M
  • Past 1Y

All Contests

  • All
  • Trump Updates
  • Recommend
  • Stocks
  • Cryptocurrencies
  • Central Banks
  • Featured News
Top News Only
Share

U.S. Natural Gas Futures Fell 3.00% On The Day, Currently Trading At $3.705 Per Million British Thermal Units

Share

Kazakhstan's Energy Minister: Kazakhstan Has Lost Roughly 3.8 Million Tons Of Oil Exports Due To Attacks On CPC

Share

Standard Chartered On Copper: "USD Softness And Sharp Moves Higher In Gold And Silver Have Supported Copper Prices"

Share

Standard Chartered On Copper: "We Forecast Average H1 Prices At $12950/T Compared With $11475/T In H2"

Share

Standard Chartered: "We Expect Base Metals Prices To Remain Elevated This Year, Particularly In H1 2026, Driven By Both Macro And Micro Factors"

Share

Yield On 5-Year Japanese Government Bond Falls 5.0 Basis Points To 1.660%

Share

Petronet LNG CEO Says Anything Around $6-7 Per Mmbtu LNG Prices Will Be A Comfortable Range To Improve Consumption In India

Share

TotalEnergies Gas And Power Executives: Security Of Supply Is Coming At Top Of Agenda Due To Geopolitical Challenges

Share

Exxonmobil LNG Executives: Bullish About Demand For LNG For The Coming Decade

Share

Spot Silver Rose More Than 3.00% On The Day, Currently Trading At $115.73 Per Ounce

Share

Spot Gold Continued Its Strong Upward Trend, Rising Above $5,250 Per Ounce, Up More Than $70 On The Day, Or Over 1%

Share

IMF On Sri Lanka: IMF Staff Concludes Visit To Sri Lanka

Share

ECB Governing Council Member Koch Said: If The Euro Continues To Appreciate, The ECB Will Need To Take Action

Share

Tanzania Deputy Energy Minister Says Hopes To Reverse Decline In Oil, Gas Output In Coming Years

Share

Kazakhstan's Energy Minister: Operations At Tengiz Oilfield Resumed Two Days Ago, Output Is Increasing

Share

New Zealand Dollar Falls 0.52% To $0.6014

Share

New York Silver Futures Surged 9.00% Intraday, Currently Trading At $115.50 Per Ounce

Share

India's Nifty Bank Futures Up 0.42% In Pre-Open Trade

Share

Citi Raises Silver Price Forecast For Next 3 Months To Usd150/ Ounce

Share

India 10-Year Benchmark Government Bond Yield At 6.7055%, Previous Close 6.7194%

TIME
ACT
FCST
PREV
U.S. Dallas Fed New Orders Index (Jan)

A:--

F: --

P: --

U.S. 2-Year Note Auction Avg. Yield

A:--

F: --

P: --

U.K. BRC Shop Price Index YoY (Jan)

A:--

F: --

P: --

China, Mainland Industrial Profit YoY (YTD) (Dec)

A:--

F: --

P: --

Germany 2-Year Schatz Auction Avg. Yield

A:--

F: --

P: --

Mexico Trade Balance (Dec)

A:--

F: --

P: --

U.S. Weekly Redbook Index YoY

A:--

F: --

P: --

U.S. S&P/CS 20-City Home Price Index YoY (Not SA) (Nov)

A:--

F: --

P: --

U.S. S&P/CS 20-City Home Price Index MoM (SA) (Nov)

A:--

F: --

P: --
U.S. FHFA House Price Index MoM (Nov)

A:--

F: --

P: --

U.S. FHFA House Price Index (Nov)

A:--

F: --

P: --

U.S. FHFA House Price Index YoY (Nov)

A:--

F: --

P: --
U.S. S&P/CS 10-City Home Price Index YoY (Nov)

A:--

F: --

P: --

U.S. S&P/CS 10-City Home Price Index MoM (Not SA) (Nov)

A:--

F: --

P: --

U.S. S&P/CS 20-City Home Price Index (Not SA) (Nov)

A:--

F: --

P: --

U.S. S&P/CS 20-City Home Price Index MoM (Not SA) (Nov)

A:--

F: --

P: --

U.S. Richmond Fed Manufacturing Composite Index (Jan)

A:--

F: --

P: --

U.S. Conference Board Present Situation Index (Jan)

A:--

F: --

P: --

U.S. Conference Board Consumer Expectations Index (Jan)

A:--

F: --

P: --

U.S. Richmond Fed Manufacturing Shipments Index (Jan)

A:--

F: --

P: --

U.S. Richmond Fed Services Revenue Index (Jan)

A:--

F: --

P: --

U.S. Conference Board Consumer Confidence Index (Jan)

A:--

F: --

P: --
U.S. 5-Year Note Auction Avg. Yield

A:--

F: --

P: --

U.S. API Weekly Refined Oil Stocks

A:--

F: --

P: --

U.S. API Weekly Crude Oil Stocks

A:--

F: --

P: --

U.S. API Weekly Gasoline Stocks

A:--

F: --

P: --

U.S. API Weekly Cushing Crude Oil Stocks

A:--

F: --

P: --

Australia RBA Trimmed Mean CPI YoY (Q4)

A:--

F: --

P: --

Australia CPI YoY (Q4)

A:--

F: --

P: --

Australia CPI QoQ (Q4)

A:--

F: --

P: --

Germany GfK Consumer Confidence Index (SA) (Feb)

--

F: --

P: --

Germany 10-Year Bund Auction Avg. Yield

--

F: --

P: --

India Industrial Production Index YoY (Dec)

--

F: --

P: --

India Manufacturing Output MoM (Dec)

--

F: --

P: --

U.S. MBA Mortgage Application Activity Index WoW

--

F: --

P: --

Canada Overnight Target Rate

--

F: --

P: --

BOC Monetary Policy Report
U.S. EIA Weekly Crude Stocks Change

--

F: --

P: --

U.S. EIA Weekly Cushing, Oklahoma Crude Oil Stocks Change

--

F: --

P: --

U.S. EIA Weekly Crude Demand Projected by Production

--

F: --

P: --

U.S. EIA Weekly Crude Oil Imports Changes

--

F: --

P: --

U.S. EIA Weekly Heating Oil Stock Changes

--

F: --

P: --

U.S. EIA Weekly Gasoline Stocks Change

--

F: --

P: --

BOC Press Conference
Russia PPI MoM (Dec)

--

F: --

P: --

Russia PPI YoY (Dec)

--

F: --

P: --

U.S. Target Federal Funds Rate Lower Limit (Overnight Reverse Repo Rate)

--

F: --

P: --

U.S. Interest Rate On Reserve Balances

--

F: --

P: --

U.S. Federal Funds Rate Target

--

F: --

P: --

U.S. Target Federal Funds Rate Upper Limit (Excess Reserves Ratio)

--

F: --

P: --

FOMC Statement
FOMC Press Conference
Brazil Selic Interest Rate

--

F: --

P: --

Australia Import Price Index YoY (Q4)

--

F: --

P: --

Japan Household Consumer Confidence Index (Jan)

--

F: --

P: --

Turkey Economic Sentiment Indicator (Jan)

--

F: --

P: --

Euro Zone M3 Money Supply (SA) (Dec)

--

F: --

P: --

Euro Zone Private Sector Credit YoY (Dec)

--

F: --

P: --

Euro Zone M3 Money Supply YoY (Dec)

--

F: --

P: --

Euro Zone 3-Month M3 Money Supply YoY (Dec)

--

F: --

P: --

South Africa PPI YoY (Dec)

--

F: --

P: --

Q&A with Experts
    • All
    • Chatrooms
    • Groups
    • Friends
    SlowBear ⛅ flag
    SlowBear ⛅ flag
    SlowBear ⛅
    As it goes now, just buy every 500dip and target the next 2k rally or 10k rally
    Size flag
    Khawatir_
    @Khawatir_Just need to manage it properly.
    Khawatir_ flag
    Size
    @Sizeyeah, but last night was an exciting fight huh
    Khawatir_ flag
    Size flag
    Khawatir_
    @Khawatir_lots of opportunities if you stayed patient.
    3466556 flag
    Great place is to be here
    Khawatir_ flag
    3466556
    Great place is to be here
    @3466556You can discuss global events, economics, geopolitics, technicals, entry decision making, risks and more.
    Size flag
    3466556
    Great place is to be here
    @Visitor3466556Absolutely. Plenty of learning and trading opportunities here.
    SlowBear ⛅ flag
    3466556
    Great place is to be here
    @3466556 Yes this is the only place you seboth sellers and buyers of the same assets making peace and laughing together
    john flag
    3466556
    Great place is to be here
    @Visitor3466556what are you trading this morning
    SlowBear ⛅ flag
    3466556
    Great place is to be here
    @3466556Welcome to the room, how are you foing today? why not register cna fully join the zanga!
    Khawatir_ flag
    SlowBear ⛅
    @SlowBear ⛅what is zanga! ?
    SlowBear ⛅ flag
    Khawatir_
    @Khawatir_ It the language of the gods bro - do not worry about it!
    Khawatir_ flag
    SlowBear ⛅
    @SlowBear ⛅I want to have dual citizenship.
    Khawatir_ flag
    @SlowBear ⛅oh yeah damn, BRENT left me he's gone away.
    SlowBear ⛅ flag
    Khawatir_
    @Khawatir_ That is a good one - I think you should pursue it bro
    SlowBear ⛅ flag
    Khawatir_
    @SlowBear ⛅oh yeah damn, BRENT left me he's gone away.
    @Khawatir_ Oh no, you did not join the BUY? please share the analysis again if you can!
    Khawatir_ flag
    SlowBear ⛅
    @SlowBear ⛅yesterday you saw BRENT on my MT5, right?
    SlowBear ⛅ flag
    Khawatir_
    @Khawatir_No i id not, not sure i saw much of your analysis yesterday
    Type here...
    Add Symbol or Code

      No matching data

      All
      Trump Updates
      Recommend
      Stocks
      Cryptocurrencies
      Central Banks
      Featured News
      • All
      • Russia-Ukraine Conflict
      • Middle East Flashpoint
      • All
      • Russia-Ukraine Conflict
      • Middle East Flashpoint

      Search
      Products

      Charts Free Forever

      Chats Q&A with Experts
      Screeners Economic Calendar Data Tools
      Membership Features
      Data Warehouse Market Trends Institutional Data Policy Rates Macro

      Market Trends

      Market Sentiment Order Book Forex Correlations

      Top Indicators

      Charts Free Forever
      Markets

      News

      News Analysis 24/7 Columns Education
      From Institutions From Analysts
      Topics Columnists

      Latest Views

      Latest Views

      Trending Topics

      Top Columnists

      Latest Update

      Signals

      Copy Rankings Latest Signals Become a signal provider AI Rating
      Contests
      Brokers

      Overview Brokers Assessment Rankings Regulators News Claims
      Broker listing Forex Brokers Comparison Tool Live Spread Comparison Scam
      Q&A Complaint Scam Alert Videos Tips to Detect Scam
      More

      Business
      Events
      Careers About Us Advertising Help Center

      White Label

      Data API

      Web Plug-ins

      Affiliate Program

      Awards Institution Evaluation IB Seminar Salon Event Exhibition
      Vietnam Thailand Singapore Dubai
      Fans Party Investment Sharing Session
      FastBull Summit BrokersView Expo
      Recent Searches
        Top Searches
          Markets
          News
          Analysis
          User
          24/7
          Economic Calendar
          Education
          Data
          • Names
          • Latest
          • Prev

          View All

          No data

          Scan to Download

          Faster Charts, Chat Faster!

          Download App
          English
          • English
          • Español
          • العربية
          • Bahasa Indonesia
          • Bahasa Melayu
          • Tiếng Việt
          • ภาษาไทย
          • Français
          • Italiano
          • Türkçe
          • Русский язык
          • 简中
          • 繁中
          Open Account
          Search
          Products
          Charts Free Forever
          Markets
          News
          Signals

          Copy Rankings Latest Signals Become a signal provider AI Rating
          Contests
          Brokers

          Overview Brokers Assessment Rankings Regulators News Claims
          Broker listing Forex Brokers Comparison Tool Live Spread Comparison Scam
          Q&A Complaint Scam Alert Videos Tips to Detect Scam
          More

          Business
          Events
          Careers About Us Advertising Help Center

          White Label

          Data API

          Web Plug-ins

          Affiliate Program

          Awards Institution Evaluation IB Seminar Salon Event Exhibition
          Vietnam Thailand Singapore Dubai
          Fans Party Investment Sharing Session
          FastBull Summit BrokersView Expo

          Canada's Consumption Momentum Overdrawn; December Forecast Downturn Limits CAD Rebound Potential

          Eva Chen

          Forex

          Summary:

          Canada's retail sales rose 1.3% month-over-month in November, but growth slowed in December.

          BUY USDCAD
          EXP
          TRADING

          1.35987

          Entry Price

          1.40000

          TP

          1.34100

          SL

          1.35818 +0.00071 +0.05%

          0.0

          Pips

          Flat

          1.34100

          SL

          Exit Price

          1.35987

          Entry Price

          1.40000

          TP

          Fundamentals

          The USDCAD extended its overnight rebound from the 1.3670 level on Tuesday, gaining upward momentum for a second consecutive trading session. Spot prices maintained modest intraday gains during European trading hours, currently trading around the 1.3700 range with a daily increase exceeding 0.18%.
          Data released last week showed Canada's retail sales rebounded strongly in November, rising 1.3% month-over-month to CAD 70.4 billion, slightly exceeding the prior forecast of 1.2%. Growth was widespread across sectors, with sales increasing in eight out of nine sub-sectors. Spending at food and beverage retailers saw the most significant rise, indicating robust consumer demand persisted through the year-end period.
          Underlying growth momentum remains robust. Core retail sales excluding gasoline and automobiles rose 1.6% month-over-month, indicating that strong household spending extends beyond volatile categories and reflects steady demand for discretionary goods.
          However, the outlook is not optimistic. Preliminary estimates from Statistics Canada indicate that retail sales in December may have declined by 0.5% month-over-month, suggesting that the strong growth momentum seen in November may not have been sustained.
          Market Watch: Canada's economy staged a welcome rebound in November, though it delivered little in the way of exciting growth. Part of the increase reflected market volatility tied to labor disputes rather than a substantive improvement in underlying demand. This rebound followed a weak and downwardly revised October, and growth momentum has already begun to slow in December. Setting aside monthly fluctuations, the underlying trend in actual sales remains negative. Weak consumer confidence may be a key factor. The Bank of Canada's latest consumer survey indicates growing household pessimism about their financial situation, which is influencing spending decisions.
          Our outlook for actual consumption growth in the fourth quarter remains subdued, with quarter-on-quarter growth projected to approach 0.9% (annualized). There exists some upside risk in the services sector, as its growth momentum is expected to gradually strengthen toward year-end. However, we believe the pace of services sector growth will be insufficient to lift overall consumption growth significantly above its trend level.
          Canada's Consumption Momentum Overdrawn; December Forecast Downturn Limits CAD Rebound Potential_1

          Technical Analysis

          The USDCAD has shifted from its earlier sharp decline to a neutral intraday trend, with prices currently rebounding. Some consolidation is expected above the temporary low at 1.3670. An upward momentum will persist as long as the pair breaks above the 4H 55 SMA (currently at 1.3788).
          On the other hand, this level also warrants attention. Currently, the exchange rate remains below this level, with upward resistance still intact. A break below 1.3670 would trigger a retest of the 1.3641 support level. Should this support level be decisively breached, the downtrend originating from 1.4139 would resume, potentially leading to another test of the 1.3538 low.

          Trading Recommendations

          Trading Direction: Buy
          Entry Price: 1.3600
          Target Price: 1.4000
          Stop Loss: 1.3410
          Valid Until: February 22, 2026 23:55:00
          Support: 1.3670, 1.3642, 1.3575
          Resistance: 1.3739, 1.3801, 1.3929
          Risk Warnings and Disclaimers
          You understand and acknowledge that there is a high degree of risk involved in trading. Following any strategies or investment methods may lead to potential losses. The content on the site is provided by our contributors and analysts for information purposes only. You are solely responsible for determining whether any trading assets, securities, strategy, or any other product is suitable for investing based on your own investment objectives and financial situation.
          Add to Favorites
          Share

          NZD/USD Surges to Four-Month Peak as Dollar Buckles Ahead of Fed Verdict

          Warren Takunda

          Traders' Opinions

          Summary:

          NZD/USD is undergoing bullish consolidation within an established uptrend. Unless price decisively breaks below 0.5950, the setup favors an upside continuation toward 0.6030 and potentially 0.6070 in the near term.

          BUY NZDUSD
          EXP
          PENDING

          0.59850

          Entry Price

          0.60700

          TP

          0.59100

          SL

          0.60280 -0.00169 -0.28%

          --

          Pips

          PENDING

          0.59100

          SL

          Exit Price

          0.59850

          Entry Price

          0.60700

          TP

          The New Zealand Dollar is staging a remarkable and sustained assault on the US currency, a move that speaks less about explosive Kiwi strength and more about a foundational crisis of confidence in the world’s reserve currency. As of this writing, NZD/USD trades robustly around 0.5990, marking a 0.75% gain on the session and carving out a fresh four-month high just a whisker above the 0.6000 psychological milestone. This isn’t a flash in the pan; it’s the seventh consecutive day of gains, a relentless grind higher that has shifted the technical and narrative landscape for the pair.
          The primary engine of this move is unequivocally the US Dollar’s broad-based infirmity. The Greenback is underperforming against every major currency at the week’s open, a stark universal retreat that has pushed the US Dollar Index (DXY) to languish near multi-month lows. The weakness is pervasive, and in my analysis, it stems from a toxic confluence of political and monetary anxieties that are prompting a global portfolio reassessment.
          Let’s be blunt: Washington is becoming a millstone around the Dollar’s neck. The market is grappling with a trifecta of corrosive uncertainties. First, the escalating global trade tensions, with the US at the epicenter, threaten to disrupt supply chains and dampen the very global growth that the US economy relies upon for exports. Second, the looming and increasingly contentious fiscal budget debates threaten another cycle of government shutdown brinkmanship, underscoring governance dysfunction. Most critically, there is a whispered but growing discourse in financial circles questioning the independence of the Federal Reserve from political pressure. This last point strikes at the heart of the Dollar’s credibility. A central bank perceived as potentially malleable to political whims loses its inflation-fighting anchor, and investors are starting to price in that long-term risk.
          This political malaise sets the stage for this week’s main event: the Federal Reserve’s policy decision on Wednesday. The consensus is for rates to remain on hold, a pause following the cumulative cuts delivered last year. But in this environment, a simple “hold” is not enough to stanch the Dollar’s bleed. The market will dissect every syllable of the policy statement and hang on every nuance from Chair Jerome Powell’s subsequent press conference. Investors are desperate for clarity on the terminal point of this easing cycle. Any hint of dovishness—suggesting openness to further cuts should data soften, or expressing heightened concern over global headwinds—could be the catalyst for a decisive DXY breakdown, sending currencies like the Kiwi soaring even higher.
          While the Dollar’s story is one of weakness, the New Zealand Dollar’s side of the ledger is shifting toward one of latent strength. Recent domestic data has fundamentally altered the interest rate narrative for the Antipodes. Last week’s fourth-quarter Consumer Price Index (CPI) report was a game-changer. Inflation didn’t just hold steady; it accelerated, printing firmly above market expectations. This data pulse has sent a jolt through rate expectations.
          Suddenly, the chatter in dealing rooms has shifted. The discussion is no longer about when the Reserve Bank of New Zealand (RBNZ) might consider its next easing move. Instead, there is revived and serious speculation that the RBNZ may need to consider hiking interest rates in the medium term, or at the very least, maintain a significantly more restrictive and hawkish policy bias than its peers, notably the Fed. In a world where every basis point of yield is being scrutinized, this potential pivot provides a powerful fundamental magnet for capital flows.

          Technical AnalysisNZD/USD Surges to Four-Month Peak as Dollar Buckles Ahead of Fed Verdict_1

          From a technical perspective, NZD/USD remains positioned within a broader bullish structure, with price action continuing to respect a well-defined rising trend line that has guided the advance since mid-month. On the 30-minute chart, the pair is trading just below the 0.6000 psychological barrier, consolidating after a strong impulsive leg higher. This pause appears corrective rather than distributive, suggesting the market is digesting gains before a potential continuation move.
          Price is currently compressing within a small symmetrical triangle/flag formation that has developed directly above the ascending trend line support. This structure typically reflects temporary equilibrium between buyers and sellers before trend resumption. Importantly, each dip within this consolidation has produced higher lows, reinforcing underlying demand and confirming that bulls continue to defend pullbacks.
          Dynamic support is visible along the rising trend line intersecting near 0.5950–0.5960, which aligns closely with the base of the consolidation pattern. A sustained break below this zone would be the first technical signal that bullish momentum is fading. Beneath that, the next meaningful support sits around 0.5910–0.5920, a prior breakout area and minor structure shelf. A move below this region would shift the short-term outlook toward a deeper correction, potentially exposing 0.5870, where the broader trend leg accelerated earlier.
          However, as long as price remains above the ascending trend support, the path of least resistance remains to the upside. The measured move projection from the consolidation pattern points toward an initial upside objective near 0.6030, followed by 0.6070, which marks a prior swing extension zone and aligns with the projected arrow on the chart. A decisive breakout above 0.6000 would likely trigger momentum buying and stop-driven flows, accelerating gains toward those higher resistance levels.
          Momentum characteristics support the bullish continuation thesis. Although we don’t see visible oscillators on the chart, the price behavior itself shows healthy momentum rotation: sharp impulsive pushes followed by shallow, orderly pullbacks. This type of structure typically occurs in trending environments rather than topping phases. The recent pullback also helped relieve short-term overbought pressure without breaking structure — a constructive sign for trend sustainability.
          Volume behavior (as inferred from candle expansion and contraction) also suggests accumulation during dips, not aggressive distribution. The inability of sellers to force a breakdown despite multiple attempts near trend support highlights persistent underlying demand.

          TRADE RECOMMENDATION

          BUY NZD/USD

          ENTRY PRICE: 0.5985
          STOP LOSS: 0.5910
          TAKE PROFIT: 0.6070
          Risk Warnings and Disclaimers
          You understand and acknowledge that there is a high degree of risk involved in trading. Following any strategies or investment methods may lead to potential losses. The content on the site is provided by our contributors and analysts for information purposes only. You are solely responsible for determining whether any trading assets, securities, strategy, or any other product is suitable for investing based on your own investment objectives and financial situation.
          Add to Favorites
          Share

          Gold Holds Near Record High as Fed Meeting, Geopolitical Tumult Underpin Safe-Haven Bid

          Warren Takunda

          Traders' Opinions

          Summary:

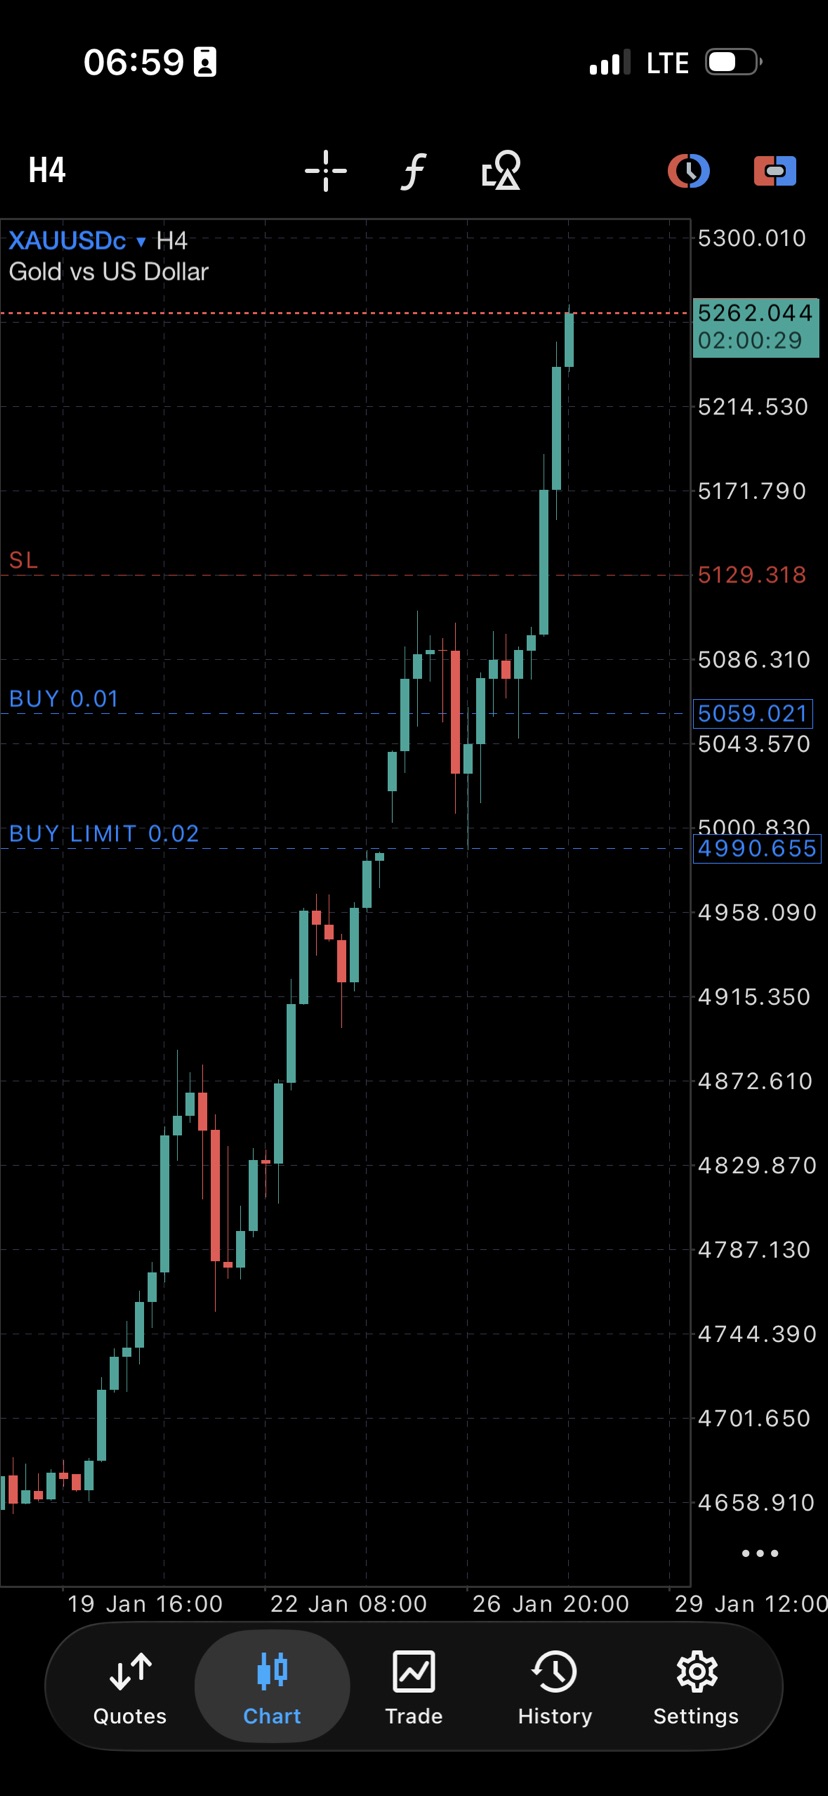
          Gold prices consolidate just below all-time peaks as markets await the Federal Reserve's policy decision.

          BUY XAUUSD
          Close Time
          CLOSED

          5101.80

          Entry Price

          5200.00

          TP

          5050.00

          SL

          5262.03 +83.45 +1.61%

          751.4

          Pips

          Profit

          5050.00

          SL

          5176.94

          Exit Price

          5101.80

          Entry Price

          5200.00

          TP

          The lustrous haven of gold continues to glimmer at historic elevations, with spot prices (XAU/USD) etching a seventh consecutive session of gains on Tuesday. Yet, in a testament to the market's palpable tension, the bullion finds itself in a holding pattern—unable to decisively shatter the $5,100 per ounce ceiling and retreating modestly from its record zenith during European trade. This pause is not a sign of weakness, but rather the deep breath taken by global traders as they brace for the seismic tremors expected from the Federal Reserve's impending policy verdict.
          The narrative driving gold is a powerful confluence of structural demand and acute macroeconomic anxiety. While the immediate spotlight is fixed on the Fed's two-day meeting commencing today, the fundamental scaffold supporting gold has been constructed over months. It is a story of de-dollarization in slow motion, of sovereign portfolios seeking anchor in an era of political volatility, and of a retail investing public hedging against a fraying consensus on global stability.
          "Gold's resilience here is extraordinary," remarked Lydia Martin, head of commodity strategy at Veritas Global in London. "We are seeing a classic push-pull between tactical caution ahead of the FOMC and a strategic, almost inexorable, bid from official and private sectors alike. The path of least resistance remains firmly higher."
          The official sector's hunger for bullion is a relentless engine. Data reveals the People's Bank of China extended its publicized buying spree for a fourteenth straight month in December. Meanwhile, the National Bank of Poland, the Reserve Bank of India, and the Central Bank of Brazil have emerged as aggressive buyers in late 2025 and early 2026, signaling a broad-based shift among emerging market central banks towards diversification. This institutional demand creates a formidable floor for prices.
          Simultaneously, the investment conduit of exchange-traded funds (ETFs) is flooding with capital. Preliminary 2025 figures indicate a staggering 25% annual increase in global gold-backed ETF holdings, ballooning to 4,025.4 tonnes from 3,224.2 tonnes in 2024. Total assets under management now approach $559 billion. This isn't speculative froth; it's a deliberate, large-scale reallocation into a non-correlated, non-yielding asset—a direct challenge to the dominance of yield-bearing Treasuries and equities.
          The geopolitical and trade policy landscape provides the urgent catalyst for these flows. Over the weekend, the specter of disruptive US trade policy re-emerged as former President Donald Trump threatened to impose a 100% tariff on Canada should it proceed with a trade deal with China. This followed the now-retracted threat against Greenland, creating a whiplash-inducing environment for global supply chains and currency markets. These pronouncements have tangibly "tarnished the US Dollar's reputation," as one G10 forex head told me, driving a search for alternatives.
          Further east, the war in Ukraine grinds on with no off-ramp in sight. The collapse of US-brokered talks in Abu Dhabi over the weekend, following Russia's demand for Ukraine to cede the entire Donbas region—swiftly rejected by Kyiv—only reinforces the market's view that protracted conflict is the base case. This constant hum of geopolitical risk feeds a steady drip of safe-haven demand.
          Paradoxically, gold's ascent occurs even as the US Dollar attempts a hesitant recovery from a four-month low touched on Monday. The greenback's minor bounce is attributed to repositioning ahead of the Fed, but its broader trajectory has been undermined by market conviction that the central bank will execute two more rate cuts this year. Monday's robust Durable Goods Orders data for November—soaring 5.3% against a 0.5% forecast—did little to alter this dovish pricing, highlighting the market's focus on the future path over backward-looking strength.
          This brings us to the immediate crucible: the Federal Open Market Committee. While no rate change is anticipated today, every syllable of Chair Jerome Powell's post-meeting press conference will be dissected for clues on the timing and depth of the anticipated 2026 easing cycle. The core question for gold traders is whether the Fed will validate the market's aggressively dovish stance. A reaffirmation of cutting bias would likely weaken the dollar and catapult gold past its current resistance. Any hint of pushback against market pricing could temporarily bolster the dollar and cap gold's rally.
          The underlying thesis for gold has transcended the short-term Fed policy cycle. It is now fueled by a profound reassessment of global risk, the visible and sustained diversification away from dollar-centric reserves, and a deep-seated distrust in the stability of the international political order. The metal is no longer just an inflation hedge or a rate play; it has reasserted its ancient role as the ultimate monetary insulator.
          As the clocks count down to the Fed's decision, the quiet bid beneath gold speaks volumes. It tells of a market that is preparing not for a single event, but for a more fractured and uncertain world. The record highs are not a destination, but likely a waypoint.

          Technical AnalysisGold Holds Near Record High as Fed Meeting, Geopolitical Tumult Underpin Safe-Haven Bid_1

          From a technical perspective, Gold (XAU/USD) is consolidating at historic highs following a powerful seven-session advance, reflecting a tactical pause ahead of a major macroeconomic catalyst. On the 30-minute chart, prices are compressing within a narrow range, with the current session trading between a high of 5,088.24 and a low of 5,082.82, and closing marginally lower at 5,086.06 (-0.02%). This low-volatility coiling action represents a moment of equilibrium as the market awaits the Federal Reserve's policy decision, which is expected to trigger the next significant directional move.
          The broader structure remains profoundly bullish, underpinned by sustained institutional and ETF demand as detailed in the fundamental narrative. The immediate price action is testing the lower bound of its recent micro-range. The key near-term support is now established at today’s low of 5,082.82. A decisive break below this level could trigger a short-term, news-driven pullback toward the more significant support zone between 5,065.00 and 5,075.00, an area that aligns with the breakout level from the previous consolidation and would represent a healthy retest. A sustained move below 5,065.00 would be required to signal a deeper corrective phase, initially targeting 5,035.00.
          On the upside, the immediate resistance and gateway for the next bullish leg is clearly defined at today's high of 5,088.24. However, the true breakout level that would signal a resumption of the powerful uptrend is the psychological and recent record high barrier at 5,100.00. A sustained push and close above this level would likely unleash a wave of momentum buying, fueled by the fundamental drivers of de-dollarization and safe-haven demand, swiftly shifting focus toward the 5,150.00 and then 5,200.00 psychological milestones.
          Momentum indicators are neutral within this compressed pre-Fed range. The minor negative close on negligible volume indicates a balance between bulls booking profits and strategic buyers awaiting confirmation. This coiled momentum is characteristic of a market primed for a volatility expansion. The underlying bullish structure, supported by relentless fundamental inflows, suggests the path of least resistance remains higher, and any dip prompted by a hawkish-leaning Fed is likely to be met with strong institutional demand.
          TRADE RECOMMENDATION
          BUY GOLD (XAU/USD)
          ENTRY PRICE: 5,101.50
          STOP LOSS: 5,050.00
          TAKE PROFIT: 5,200.00
          Risk Warnings and Disclaimers
          You understand and acknowledge that there is a high degree of risk involved in trading. Following any strategies or investment methods may lead to potential losses. The content on the site is provided by our contributors and analysts for information purposes only. You are solely responsible for determining whether any trading assets, securities, strategy, or any other product is suitable for investing based on your own investment objectives and financial situation.
          Add to Favorites
          Share

          EURJPY - Trendline Break: What's Next?

          Warren Takunda

          Traders' Opinions

          Summary:

          The Euro-Yen cross (EUR/JPY) has clawed back from six-week lows, stabilizing near 183.00 as the market's panic over a potential joint Federal Reserve-Bank of Japan intervention subsides.

          SELL EURJPY
          EXP
          PENDING

          182.550

          Entry Price

          179.000

          TP

          185.000

          SL

          183.094 -0.135 -0.07%

          --

          Pips

          PENDING

          179.000

          TP

          Exit Price

          182.550

          Entry Price

          185.000

          SL

          A fragile calm has descended upon the Japanese Yen markets, but it’s the uneasy quiet of a storm that has merely shifted course, not dissipated. The Euro, trading just shy of the 183.00 handle against the Yen after a rebound from last week’s six-week trough near 182.00, embodies this tension. Its failed attempt to breach resistance around 183.65 earlier today tells the story: a market tentatively covering short-Yen positions but lacking the conviction to mount a full-scale reversal.
          The immediate trigger for this pause in the Yen’s relentless slide is the fading specter of a coordinated central bank intervention. Last Friday’s revelation that both the Bank of Japan and the U.S. Federal Reserve were querying major banks for USD/JPY rate quotes sent a shockwave of pure, unadulterated fear through the speculative community. It was a classic "open mouth, open vault" operation—a direct and credible warning shot across the bows of carry traders that the 160.00 USD/JPY line is, indeed, a "line in the sand" for Tokyo and, critically, for Washington. The Yen exploded higher in response, a Pavlovian reaction to the memory of past, costly interventions.
          Yet, by Tuesday, that conviction began to leach away. With USD/JPY retreating to the 156.00-157.00 zone and EUR/JPY failing to break down, the panic bid has evaporated. Traders are reasoning, for now, that the mere act of asking for prices achieved its goal: it bought time and instilled a measure of fear. The result is a Yen that is "trimming recent gains," as you note, but one that remains dramatically stronger than its 34-year lows of just days ago. The market is breathing, but it’s watching the exits.
          However, to focus solely on intervention dynamics is to miss the profound undercurrent that has been re-awakened and now threatens to exert a more sustained gravitational pull on the currency: Japan’s fiscal sustainability. The catalyst here is unequivocally political. Prime Minister Sanae Takaichi’s decision to dissolve the lower house and call a snap election for February 8 was not met with applause in the bond and currency markets. It was met with a shudder.
          Investors are decoding a clear and present risk: a strengthened electoral mandate for Takaichi translates directly into a turbocharging of her platform of "big spending and lower taxes." In any major economy, this combination amidst already record debt-to-GDP ratios would ring alarm bells. For Japan, where the Bank of Japan’s yield curve control has long blurred the lines between monetary and fiscal policy, it threatens to unravel a precarious equilibrium. The sell-off in the Yen across the board following the election announcement was a rational, if brutal, assessment of this risk. It’s a bet that Japan’s path may lead towards a fiscal stress that ultimately debases the currency, regardless of short-term rate differentials.
          So, we arrive at the market’s current schizophrenic stance. On one shoulder sits the wary official, the BOJ’s stealthy rate checks, promising punitive action for excessive weakness. On the other whispers the fundamental analyst, charting a future of unchecked debt issuance and a potential loss of market confidence. This tug-of-war is producing the choppy, indecisive price action we see now.
          Elsewhere, the European backdrop offers little directional impetus. A disappointing German IFO Business Climate reading on Monday served as a reminder of the Eurozone’s stagnant economic reality, capping the Euro’s rally potential. Later today, a speech by European Central Bank President Christine Lagarde is anticipated to be a non-event for markets—a reiteration of the data-dependent, June-cut script that is now fully priced. The primary drama remains squarely in the Pacific.

          Technical AnalysisEURJPY - Trendline Break: What's Next?_1

          From a technical perspective, EURJPY has experienced a notable shift in its near-term structure following a decisive break of the primary bullish trendline that supported the rally from the December 2025 lows. On the 4-hour chart, prices have rejected the former trendline, which now acts as new resistance near 183.500, and are consolidating in a lower range. This break has invalidated the immediate bullish impulse and suggests a period of correction or consolidation is underway.
          The 182.500 level, marked by today's low of 182.522, now serves as immediate and critical support. A sustained break and close below this level would confirm the bearish momentum from the trendline break and likely trigger a deeper corrective move toward the next significant support zone between 181.000 and 181.500. This area represents a previous consolidation platform from late January and a key psychological level. A decisive breakdown beneath 181.000 would signal a more pronounced corrective phase, potentially exposing the 179.000 handle.
          Momentum indicators reflect this transition. The failure to hold the trendline and the subsequent lower close indicate a shift from bullish momentum to a corrective phase. This price action suggests the market is digesting the prior strong gains and seeking a new equilibrium before the next significant directional move.
          TRADE RECOMMENDATION
          SELL EURJPY
          ENTRY PRICE: 182.550
          STOP LOSS: 185.000
          TAKE PROFIT: 179.000
          Risk Warnings and Disclaimers
          You understand and acknowledge that there is a high degree of risk involved in trading. Following any strategies or investment methods may lead to potential losses. The content on the site is provided by our contributors and analysts for information purposes only. You are solely responsible for determining whether any trading assets, securities, strategy, or any other product is suitable for investing based on your own investment objectives and financial situation.
          Add to Favorites
          Share

          Stay Bullish but Avoid Chasing Rallies; Wait for Pullbacks

          Alan

          Commodity

          Summary:

          Recently, gold has surged past the US$5,000 mark driven by multiple factors, further expanding its bullish outlook.

          BUY XAUUSD
          EXP
          PENDING

          5025.00

          Entry Price

          5320.00

          TP

          4940.00

          SL

          5262.03 +83.45 +1.61%

          --

          Pips

          PENDING

          4940.00

          SL

          Exit Price

          5025.00

          Entry Price

          5320.00

          TP

          Fundamentals

          Recent market patterns indicate that gold prices are experiencing rapid appreciation amidst intensified global risk aversion and a weakening U.S. dollar, accompanied by increased trading volume. Although short-term profit-taking is evident, the bullish momentum remains dominant.
          From a fundamental perspective, the current surge in gold prices is driven by multiple synergistic factors. First, heightened geopolitical tensions and geopolitical risks, along with trade policy uncertainties, have significantly heightened demand for safe-haven assets: recent international developments and trade disputes have prompted capital inflows into both physical and financial gold, directly boosting demand. Second, the weakening dollar and declining U.S. Treasury yields have provided rate and currency support for bullion prices—declining nominal yields and dollar underperformance reduce opportunity costs for holding non-yielding gold, thereby attracting investor allocation. Additionally, continuous purchase activities by global central banks and institutional investors, together with robust inflows into ETFs and physical markets, form a structural demand foundation, enabling quick absorption of retracements and reinforcing market consensus on future upside potential.
          Overall, the fundamental landscape features a "risk aversion + dollar softness + physical and central bank demand" triangle, constituting the core rationale for gold's ascent to historical highs.

          Technical Analysis

          Stay Bullish but Avoid Chasing Rallies; Wait for Pullbacks_1
          In the 1D timeframe, as gold price breaks through Fibonacci extension levels 1.0 at 4,960 and 5,000 psychological thresholds, the bullish momentum toward Fibonacci extension 1.618 at 5,620 is effectively unlocked.
          Yesterday, gold experienced a sharp decline after surpassing the 5,100 level, indicating significant selling pressure in the 5,100-5,110 range. If the price sustains an above-average trading volume and stabilizes above this range, it will confirm a bullish technical breakout, suggesting an ongoing upward trend. Conversely, a retracement from these highs may lead to testing the 4,960 support level.

          Trading Recommendations

          Trading Direction: Buy
          Entry Price: 5070.00
          Target Price: 5320.00
          Stop Loss: 4970.00
          Valid Until: February 10, 2026 23:00:00
          Support: 4990.00, 4960.00
          Resistance: 5110.00, 5350.00
          Risk Warnings and Disclaimers
          You understand and acknowledge that there is a high degree of risk involved in trading. Following any strategies or investment methods may lead to potential losses. The content on the site is provided by our contributors and analysts for information purposes only. You are solely responsible for determining whether any trading assets, securities, strategy, or any other product is suitable for investing based on your own investment objectives and financial situation.
          Add to Favorites
          Share

          Interest Rates Unchanged! USDCAD Extends Downtrend

          Tank

          Forex

          Technical Analysis

          Summary:

          Amid uncertainty over Fed policy and fears of a renewed U.S. government shutdown, USDCAD may face selling pressure with limited upside potential. The interest rate decisions by the Fed and the Bank of Canada (BoC) will be the key focus later on Wednesday.

          SELL USDCAD
          Close Time
          CLOSED

          1.37372

          Entry Price

          1.35300

          TP

          1.39300

          SL

          1.35818 +0.00071 +0.05%

          129.2

          Pips

          Profit

          1.35300

          TP

          1.36080

          Exit Price

          1.37372

          Entry Price

          1.39300

          SL

          Fundamentals
          Uncertainty surrounding Fed policy and concerns about a potential U.S. government shutdown are likely to exert selling pressure on USDCAD, capping its upside. The rate decisions from the Fed and the BoC
          will take center stage later Wednesday. Markets widely expect the BoC to keep its benchmark rate unchanged at 2.25% at its January meeting, as inflation remains within the target range.
          TD Bank analysts note that current economic data is insufficient to prompt the central bank to shift its policy stance. The underlying economy remains weak and faces significant uncertainties, despite easing inflationary pressures. Analysts point out that the BoC would only be forced to act if economic growth falls significantly short of expectations or the labor market deteriorates markedly. While the market consensus is for no rate adjustment this week, the prospect of further rate hikes has not been completely ruled out. Some institutions anticipate the BoC may raise rates again later this year, with a total hike of up to 50 bps.
          It is also believed that the central bank will signal its future policy direction through its statement at this meeting, but the overall tone will remain balanced, without a clear dovish or hawkish tilt. Against the backdrop of persistently rising living costs and food price inflation nearly double the overall inflation rate, Canadian Prime Minister Justin Trudeau announced that the federal government will provide more direct fiscal support to residents by increasing the existing GST rebate. The rebate will be renamed the Canada Food and Necessities Benefit, with a 25% increase starting in July this year for a five-year period, alongside a one-time additional payment equivalent to 50% of the annual benefit level.
          The Fed is also expected to hold interest rates steady, though it faces distinct challenges, including U.S. President Donald Trump's attempts to undermine the central bank's independence and the uncertainty over who will succeed Jerome Powell as Fed Chair when his term ends in May. Trump stated last week that he will soon announce his nominee for the next Fed Chair. Speculation over the successor is likely to weigh on the U.S. dollar, as markets expect the new Fed chief to lean toward accelerating the pace of rate cuts.
          The U.S. government is facing the risk of a partial shutdown, as Senate Democratic Leader Chuck Schumer vowed to oppose a funding bill that includes appropriations for the Department of Homeland Security. Congress must pass government funding by January 30, or a partial shutdown will occur, which could drag the USDCAD exchange rate lower.
          On the other hand, Trump's renewed tariff threats may limit the Canadian dollar's upside. Trump threatened on Saturday to impose a 100% tariff on Canadian goods if Canada strikes a trade deal with China, sparking fears of a resurgence of trade tensions.
          Technical Analysis
          From a weekly perspective, USDCAD has broken below the Bollinger Middle Band once again, and the MACD line and signal line have formed a death cross near the zero axis, indicating the continuation of the bearish trend. If prices continue to trade below the Bollinger Middle Band, the pair is highly likely to drop to around the EMA200 at 1.364 and the previous low at 1.353. The RSI stands at 42, entering the bearish territory, with lower highs forming consecutively.
          On the 15-minute timeframe, the Bollinger Bands have contracted and narrowed, MAs have flattened, and bullish momentum has weakened significantly. Prices faced strong resistance after rebounding to the EMA200, signaling the late stage of a corrective bounce. Immediate support levels are seen at the psychological level of 1.37 and the previous low around 1.367. The RSI is at 54, reflecting neutral market sentiment with investors on the sidelines.
          Therefore, it is recommended to adopt a sell-on-rallies approach as the primary strategy.
          Interest Rates Unchanged! USDCAD Extends Downtrend_1Interest Rates Unchanged! USDCAD Extends Downtrend_2
          Trade Recommendations
          Trade Direction: Sell
          Entry Price: 1.376
          Target Price: 1.353
          Stop Loss: 1.393
          Support: 1.36/1.357/1.35
          Resistance Levels: 1.4/1.441/1.42
          Risk Warnings and Disclaimers
          You understand and acknowledge that there is a high degree of risk involved in trading. Following any strategies or investment methods may lead to potential losses. The content on the site is provided by our contributors and analysts for information purposes only. You are solely responsible for determining whether any trading assets, securities, strategy, or any other product is suitable for investing based on your own investment objectives and financial situation.
          Add to Favorites
          Share

          BTCUSD Losing Momentum Around $88K

          Gerik

          Cryptocurrency

          Summary:

          Bitcoin (BTC/USD) is trading near the $88,000 area, showing hesitation to reclaim key upside levels above ~$90K amid ongoing consolidation and weaker risk appetite...

          SELL BTC-USDT
          EXP
          TRADING

          88200.0

          Entry Price

          85500.0

          TP

          89700.0

          SL

          89259.1 +9.1 +0.01%

          0.0

          Pips

          Flat

          85500.0

          TP

          Exit Price

          88200.0

          Entry Price

          89700.0

          SL

          Market Overview

          Bitcoin’s price has been ranging around the $88,000–$89,000 area after a notable decline from its peak near $126,000 in late 2025. The market’s failure to sustain levels above ~$90K highlights resistance and a lack of clear bullish conviction. Macroeconomic uncertainties, including cautious investor positioning ahead of key central bank meetings, have contributed to Bitcoin’s consolidation and risk-off sentiment among traders. Cryptocurrencies like BTC continue to be treated more as risk assets rather than safe havens, which has pressured prices when broader financial markets exhibit volatility.

          Market Sentiment

          Sentiment in the short term is tilted toward caution and mild bearishness. With Bitcoin trading below resistance zones and lacking strong follow-through buying pressure, the market exhibits a wait-and-see attitude. Recent news suggests institutional flows have retreated while safe-haven assets like gold attract capital, underscoring risk aversion that weighs on BTC. This dynamic supports a short-term sell setup on strength rather than chasing potential breakouts that lack momentum.

          Technical Analysis

          BTCUSD Losing Momentum Around $88K_1
          On the M15 timeframe, the price remains below significant resistance clustered near the previous ~$90K threshold, failing to capitalize on intraday rallies. Recent technical summaries highlight a prevalence of sell signals and bearish moving average alignments across multiple timeframes, indicating downside bias. With Bitcoin’s RSI and MACD showing subdued momentum, there is a higher probability for pullbacks or continued range compression rather than immediate upside. This environment offers a favorable condition for short trades on signs of strength being rejected near local resistance.
          Trade Recommendation
          Entry: 88200
          Take Profit: 85500
          Stop Loss: 89700
          Risk Warnings and Disclaimers
          You understand and acknowledge that there is a high degree of risk involved in trading. Following any strategies or investment methods may lead to potential losses. The content on the site is provided by our contributors and analysts for information purposes only. You are solely responsible for determining whether any trading assets, securities, strategy, or any other product is suitable for investing based on your own investment objectives and financial situation.
          Add to Favorites
          Share
          FastBull
          Copyright © 2026 FastBull Ltd

          728 RM B 7/F GEE LOK IND BLDG NO 34 HUNG TO RD KWUN TONG KLN HONG KONG

          TelegramInstagramTwitterfacebooklinkedin
          App Store Google Play Google Play
          Products
          Charts

          Chats

          Q&A with Experts
          Screeners
          Economic Calendar
          Data
          Tools
          Membership
          Features
          Function
          Markets
          Copy Trading
          Latest Signals
          Contests
          News
          Analysis
          24/7
          Columns
          Education
          Company
          Careers
          About Us
          Contact Us
          Advertising
          Help Center
          Feedback
          User Agreement
          Privacy Policy
          Personal Information Protection Statement
          Business

          White Label

          Data API

          Web Plug-ins

          Poster Maker

          Affiliate Program

          Risk Disclosure

          The risk of loss in trading financial instruments such as stocks, FX, commodities, futures, bonds, ETFs and crypto can be substantial. You may sustain a total loss of the funds that you deposit with your broker. Therefore, you should carefully consider whether such trading is suitable for you in light of your circumstances and financial resources.

          No decision to invest should be made without thoroughly conducting due diligence by yourself or consulting with your financial advisors. Our web content might not suit you since we don't know your financial conditions and investment needs. Our financial information might have latency or contain inaccuracy, so you should be fully responsible for any of your trading and investment decisions. The company will not be responsible for your capital loss.

          Without getting permission from the website, you are not allowed to copy the website's graphics, texts, or trademarks. Intellectual property rights in the content or data incorporated into this website belong to its providers and exchange merchants.

          Not Logged In

          Log in to access more features

          Connect Broker
          Become a signal provider
          Help Center
          Customer Service
          Dark Mode
          Price Up/Down Colors

          Log In

          Sign Up

          Position
          Layout
          Fullscreen
          Default to Chart
          The chart page opens by default when you visit fastbull.com