

Markets
News
Analysis
User
24/7
Economic Calendar
Education
Data
- Names
- Latest
- Prev


Signal Accounts for Members
All Signal Accounts
All Contests
 France HICP Final MoM (Nov)
A:--
F: --
P: --
 China, Mainland Outstanding Loans Growth YoY (Nov)
A:--
F: --
P: --
China, Mainland M2 Money Supply YoY (Nov)A:--
F: --
P: --
China, Mainland M0 Money Supply YoY (Nov)A:--
F: --
P: --
China, Mainland M1 Money Supply YoY (Nov)A:--
F: --
P: --
 India CPI YoY (Nov)
A:--
F: --
P: --
India Deposit Gowth YoYA:--
F: --
P: --
 Brazil Services Growth YoY (Oct)
A:--
F: --
P: --
 Mexico Industrial Output YoY (Oct)
A:--
F: --
P: --
 Russia Trade Balance (Oct)
A:--
F: --
P: --
 Philadelphia Fed President Henry Paulson delivers a speech
 Canada Building Permits MoM (SA) (Oct)
A:--
F: --
P: --
Canada Wholesale Sales YoY (Oct)A:--
F: --
P: --
Canada Wholesale Inventory MoM (Oct)A:--
F: --
P: --
Canada Wholesale Inventory YoY (Oct)A:--
F: --
P: --
Canada Wholesale Sales MoM (SA) (Oct)A:--
F: --
P: --
 Germany Current Account (Not SA) (Oct)
A:--
F: --
P: --
U.S. Weekly Total Rig CountA:--
F: --
P: --
U.S. Weekly Total Oil Rig CountA:--
F: --
P: --
 Japan Tankan Small Manufacturing Outlook Index (Q4)
A:--
F: --
P: --
Japan Tankan Large Non-Manufacturing Diffusion Index (Q4)A:--
F: --
P: --
Japan Tankan Large Non-Manufacturing Outlook Index (Q4)A:--
F: --
P: --
Japan Tankan Large Manufacturing Outlook Index (Q4)A:--
F: --
P: --
Japan Tankan Small Manufacturing Diffusion Index (Q4)A:--
F: --
P: --
Japan Tankan Large Manufacturing Diffusion Index (Q4)A:--
F: --
P: --
Japan Tankan Large-Enterprise Capital Expenditure YoY (Q4)A:--
F: --
P: --
 U.K. Rightmove House Price Index YoY (Dec)
A:--
F: --
P: --
China, Mainland Industrial Output YoY (YTD) (Nov)A:--
F: --
P: --
China, Mainland Urban Area Unemployment Rate (Nov)A:--
F: --
P: --
 Saudi Arabia CPI YoY (Nov)
A:--
F: --
P: --
 Euro Zone Industrial Output YoY (Oct)
--
F: --
P: --
Euro Zone Industrial Output MoM (Oct)--
F: --
P: --
Canada Existing Home Sales MoM (Nov)--
F: --
P: --
Euro Zone Total Reserve Assets (Nov)--
F: --
P: --
U.K. Inflation Rate Expectations--
F: --
P: --
Canada National Economic Confidence Index--
F: --
P: --
Canada New Housing Starts (Nov)--
F: --
P: --
U.S. NY Fed Manufacturing Employment Index (Dec)--
F: --
P: --
U.S. NY Fed Manufacturing Index (Dec)--
F: --
P: --
Canada Core CPI YoY (Nov)--
F: --
P: --
Canada Manufacturing Unfilled Orders MoM (Oct)--
F: --
P: --
U.S. NY Fed Manufacturing Prices Received Index (Dec)--
F: --
P: --
U.S. NY Fed Manufacturing New Orders Index (Dec)--
F: --
P: --
Canada Manufacturing New Orders MoM (Oct)--
F: --
P: --
Canada Core CPI MoM (Nov)--
F: --
P: --
Canada Trimmed CPI YoY (SA) (Nov)--
F: --
P: --
Canada Manufacturing Inventory MoM (Oct)--
F: --
P: --
Canada CPI YoY (Nov)--
F: --
P: --
Canada CPI MoM (Nov)--
F: --
P: --
Canada CPI YoY (SA) (Nov)--
F: --
P: --
Canada Core CPI MoM (SA) (Nov)--
F: --
P: --
Canada CPI MoM (SA) (Nov)--
F: --
P: --
Federal Reserve Board Governor Milan delivered a speech U.S. NAHB Housing Market Index (Dec)--
F: --
P: --
 Australia Composite PMI Prelim (Dec)
--
F: --
P: --
Australia Services PMI Prelim (Dec)--
F: --
P: --
Australia Manufacturing PMI Prelim (Dec)--
F: --
P: --
Japan Manufacturing PMI Prelim (SA) (Dec)--
F: --
P: --
U.K. Unemployment Claimant Count (Nov)--
F: --
P: --
U.K. Unemployment Rate (Nov)--
F: --
P: --
U.K. 3-Month ILO Unemployment Rate (Oct)--
F: --
P: --

No matching data
Latest Views
Latest Views
Trending Topics
Top Columnists
Latest Update
White Label
Data API
Web Plug-ins
Affiliate Program
View All
No data
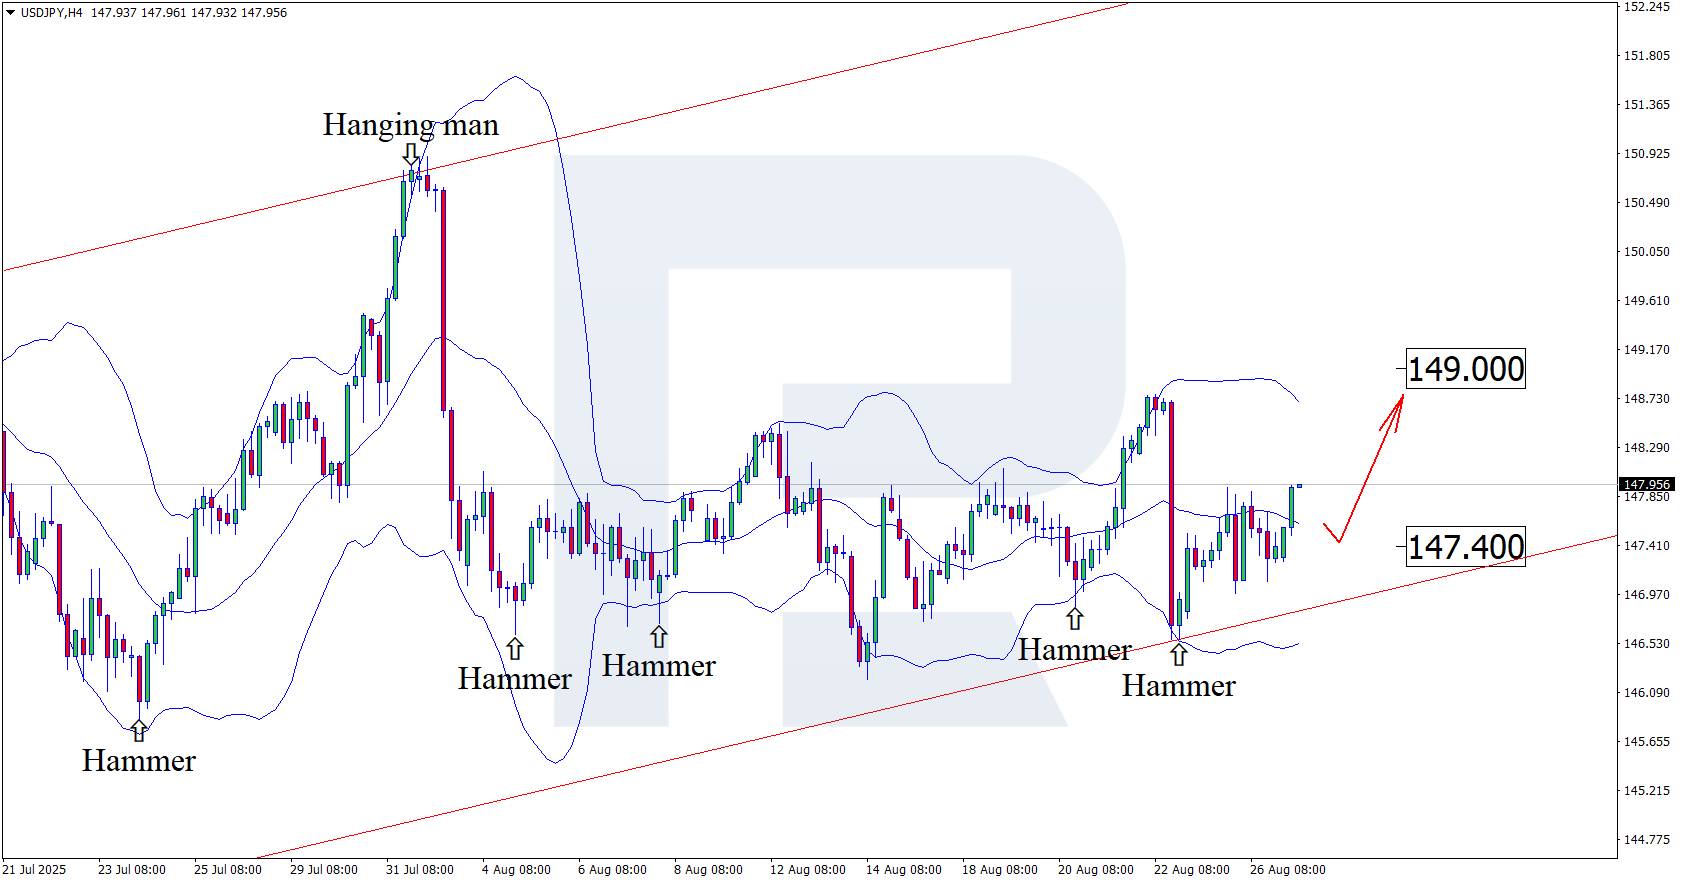
Amid uncertainty surrounding the Fed scandal and potential BoJ monetary tightening, the USDJPY pair may rise towards 149.00. Find out more in our analysis for 27 August 2025.
Despite statements from Donald Trump and BoJ Governor Kazuo Ueda, USDJPY technical analysis suggests growth towards the 149.00 level.
Amid uncertainty surrounding the Fed scandal and potential BoJ monetary tightening, the USDJPY pair may rise towards 149.00. Find out more in our analysis for 27 August 2025.
The forecast for 27 August 2025 shows USDJPY continuing to rise while still trading sideways around 147.90.
The US President announced the dismissal of Fed Governor Lisa Cook. This raised concerns about the independence of the US central bank and increased pressure on the dollar. As a result, the USD could face another wave of instability ahead of the September rate decision.
Investors and analysts expect a 25-basis-point rate cut, but in light of recent events, predictability from the Fed is no longer assured. There is a possibility the Fed could shift towards the R-Star concept and move to cut rates by more than 25 basis points soon.
Today’s USDJPY forecast also takes into account comments from Bank of Japan Governor Kazuo Ueda, who highlighted steady wage growth and a strong labour market, with both factors raising the likelihood of monetary tightening. This could give the yen additional support in the near term.
On the H4 chart, the USDJPY pair tested the lower Bollinger Band and formed a Hammer reversal pattern around 147.90. At this stage, the pair may continue an upward wave in line with the pattern’s signal. The USDJPY rate remains within an ascending channel, suggesting strong chances of a move towards the 149.00 resistance level.
At the same time, the USDJPY forecast also considers an alternative scenario, where the price declines towards 147.40 before resuming upward movement.
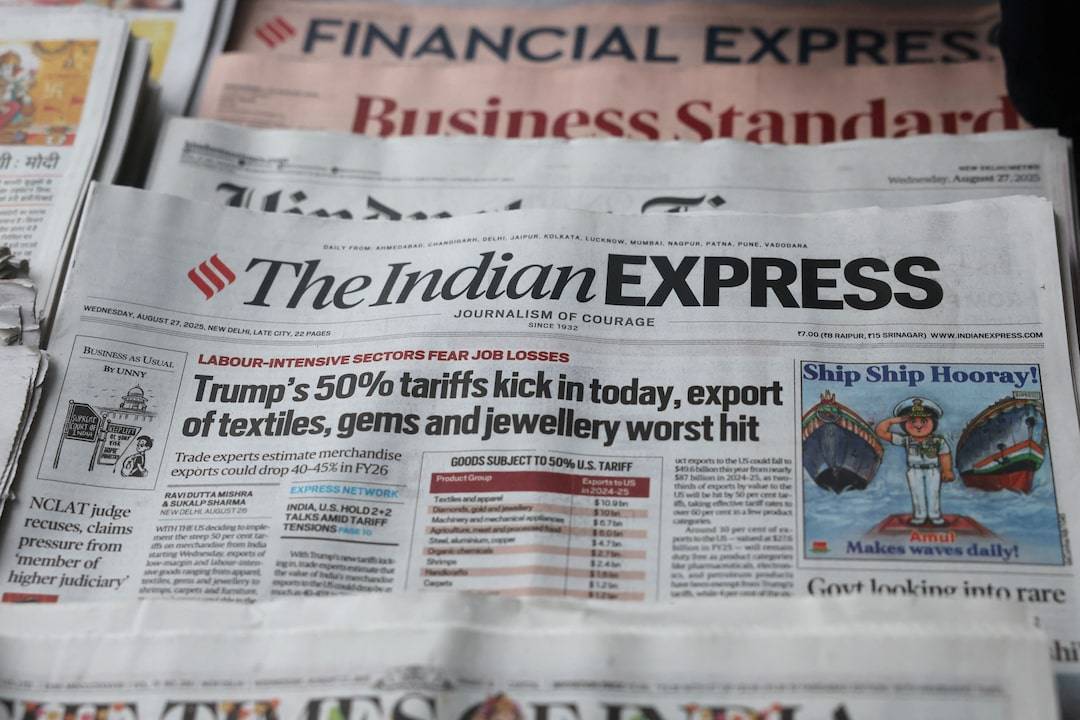
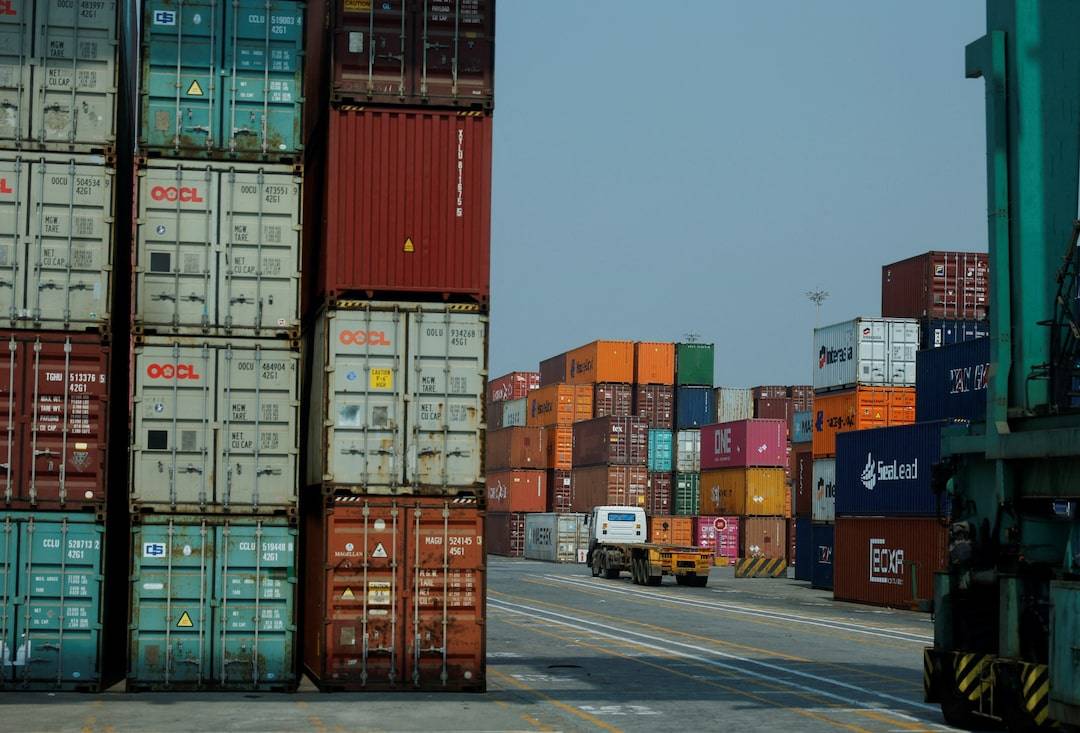
U.S. President Donald Trump's doubling of tariffs on goods from India to as much as 50% took effect as scheduled on Wednesday, escalating tensions between the world's two largest democracies and strategic partners.
A punitive 25% tariff imposed due to India's purchases of Russian oil adds to Trump's prior 25% tariff on many products from India. It takes total duties to as high as 50% for goods such as garments, gems and jewellery, footwear, sporting goods, furniture and chemicals - among the highest imposed by the U.S. and on par with Brazil and China.
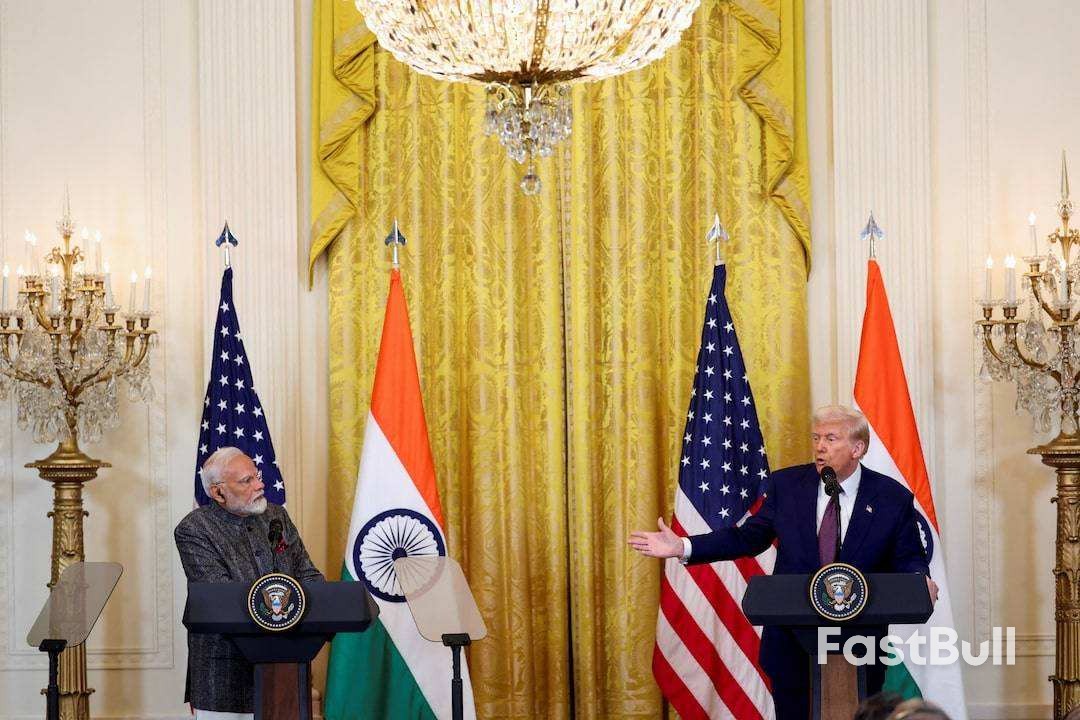
The new tariffs threaten thousands of small exporters and jobs, including in Prime Minister Narendra Modi's home state of Gujarat.
An Indian Commerce Ministry official said on condition of anonymity that exporters hit by tariffs would receive financial assistance and be encouraged to diversify to markets such as China, Latin America and the Middle East.
A U.S. Customs and Border Protection notice to shippers, opens new tab provides a three-week exemption for Indian goods that were loaded onto a vessel and in transit to the U.S. before the midnight deadline. These goods can still enter the U.S. at prior lower tariff rates before 12:01 a.m. EDT (0401 GMT) on September 17.
Also exempted are steel, aluminum and derivative products, passenger vehicles, copper and other goods subject to separate tariffs of up to 50% under the Section 232 national security trade law.
India trade ministry officials say the average tariff on U.S. imports is around 7.5%, while the U.S. Trade Representative's office has highlighted rates of up to 100% on autos and an average applied tariff rate of 39% on U.S. farm goods.
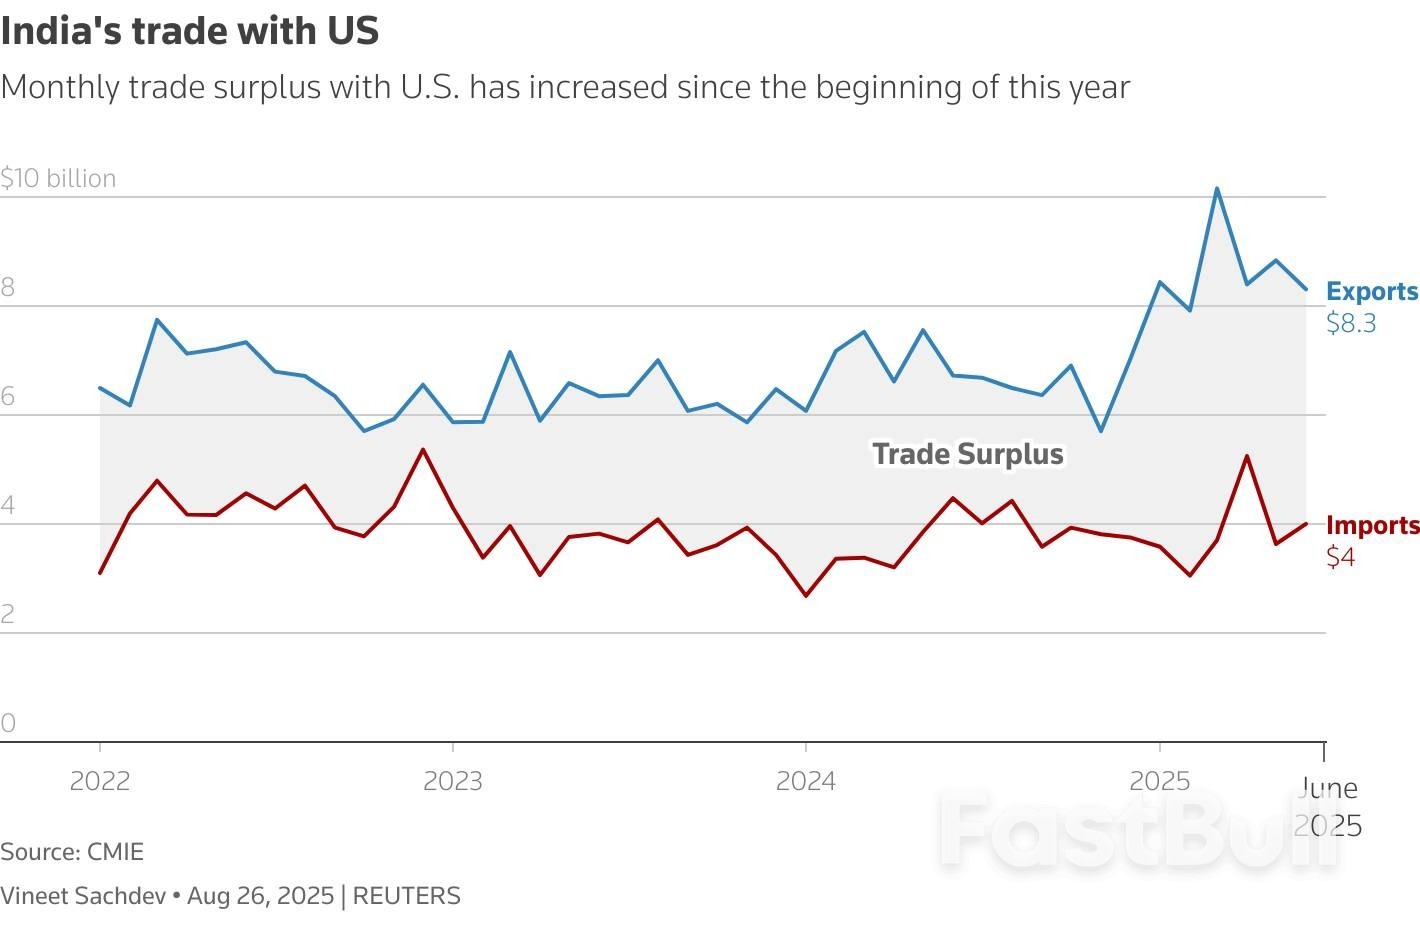
The chart shows India's monthly imports and export to U.S.
As the midnight activation deadline approached, U.S. officials offered no hope for India to avert the tariffs.
"Yeah," said White House trade adviser Peter Navarro when asked if the increased tariffs on India's U.S.-bound exports would go into effect as previously announced on Wednesday. He offered no further details.
Wednesday's tariff move follows five rounds of failed talks, during which Indian officials had signalled optimism that U.S. tariffs could be capped at 15%, the rate granted to goods from some other major U.S. trade partners including Japan, South Korea and the European Union.
Officials on both sides blamed political misjudgment and missed signals for the breakdown in talks between the world's biggest and fifth-largest economies. Their two-way goods trade totaled $129 billion in 2024, with a $45.8 billion U.S. trade deficit, according to U.S. Census Bureau data.
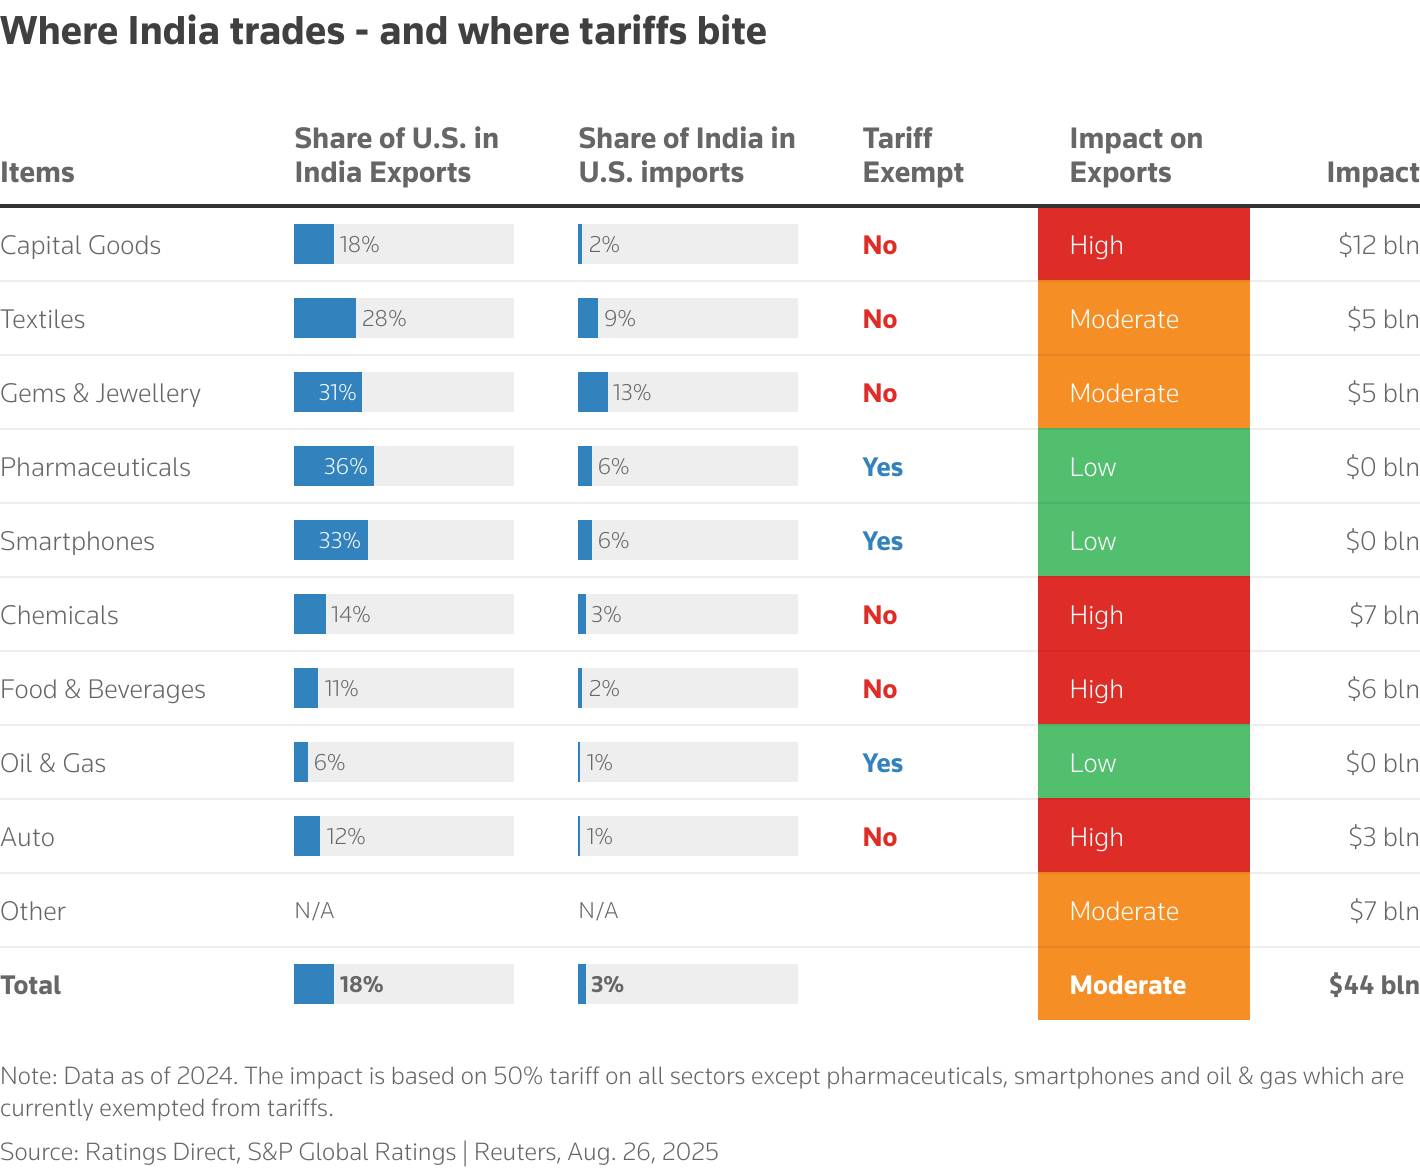
The table shows the sectors that get affected mainly from US tariffs on India and the total potential impact on trade numbers.
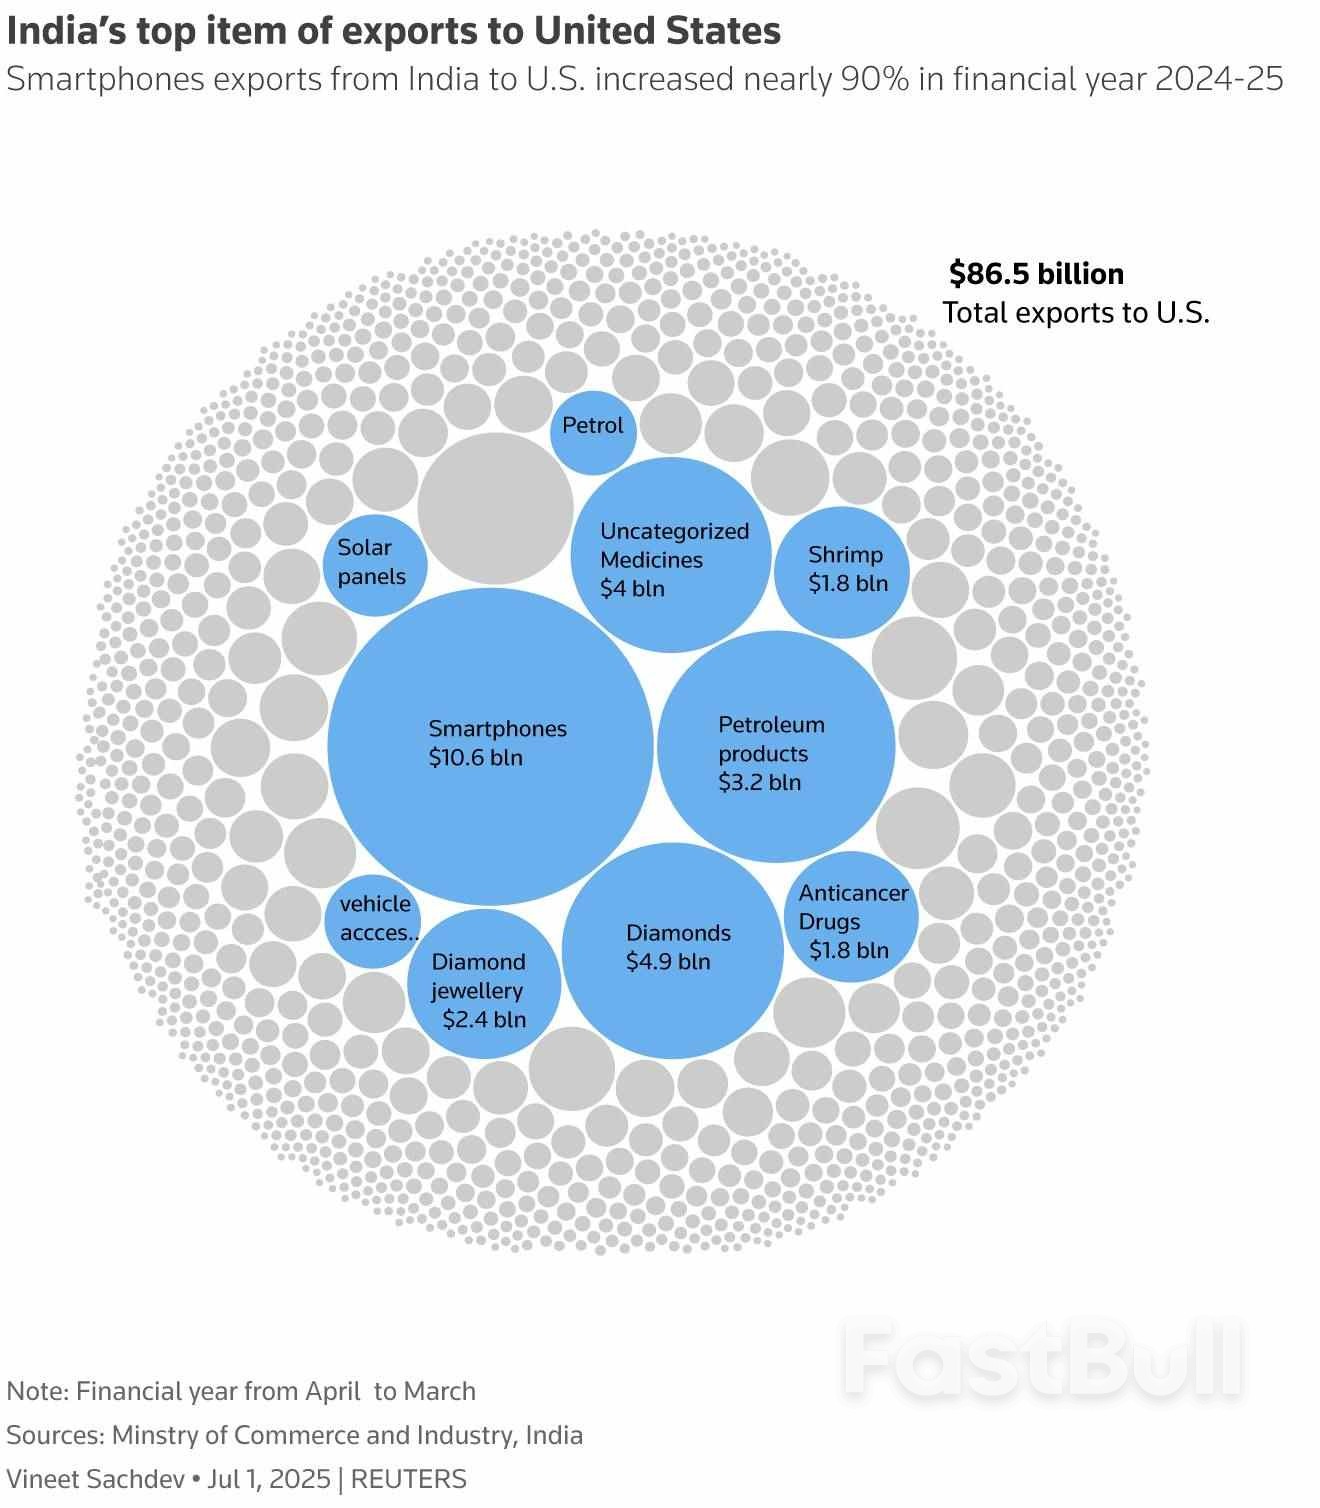
Exporter groups estimate hikes could affect nearly 55% of India's $87 billion in merchandise exports to the U.S., while benefiting competitors such as Vietnam, Bangladesh and China.
Sustained tariffs at this rate could dent India's growing appeal as an alternative manufacturing hub to China for goods such as smartphones and electronics.
The U.S.-India standoff has raised questions about the broader relationship between India and the U.S., important security partners who share concerns about China.
However, on Tuesday the U.S. State Department and India's Ministry of External Affairs issued identical statements saying senior officials of the ministries and defense departments met virtually on Monday and expressed "eagerness to continue enhancing the breadth and depth of the bilateral relationship."
Both sides also reaffirmed their commitment to the Quad, a partnership that brings together the U.S. and India with Australia and Japan.
728 RM B 7/F GEE LOK IND BLDG NO 34 HUNG TO RD KWUN TONG KLN HONG KONG


White Label
Data API
Web Plug-ins
Poster Maker
Affiliate Program
The risk of loss in trading financial instruments such as stocks, FX, commodities, futures, bonds, ETFs and crypto can be substantial. You may sustain a total loss of the funds that you deposit with your broker. Therefore, you should carefully consider whether such trading is suitable for you in light of your circumstances and financial resources.
No decision to invest should be made without thoroughly conducting due diligence by yourself or consulting with your financial advisors. Our web content might not suit you since we don't know your financial conditions and investment needs. Our financial information might have latency or contain inaccuracy, so you should be fully responsible for any of your trading and investment decisions. The company will not be responsible for your capital loss.
Without getting permission from the website, you are not allowed to copy the website's graphics, texts, or trademarks. Intellectual property rights in the content or data incorporated into this website belong to its providers and exchange merchants.
Not Logged In
Log in to access more features

FastBull Membership
Not yet
Purchase


Log In
Sign Up


