• Trade
  • Markets
  • Copy
  • Contests
  • News
  • 24/7
  • Calendar
  • Q&A
  • Chats
Trending
Screeners
SYMBOL
LAST
BID
ASK
HIGH
LOW
NET CHG.
%CHG.
SPREAD
SPX
S&P 500 Index
6870.39
6870.39
6870.39
6895.79
6858.28
+13.27
+ 0.19%
--
DJI
Dow Jones Industrial Average
47954.98
47954.98
47954.98
48133.54
47871.51
+104.05
+ 0.22%
--
IXIC
NASDAQ Composite Index
23578.12
23578.12
23578.12
23680.03
23506.00
+72.99
+ 0.31%
--
USDX
US Dollar Index
98.920
99.000
98.920
98.960
98.730
-0.030
-0.03%
--
EURUSD
Euro / US Dollar
1.16500
1.16507
1.16500
1.16717
1.16341
+0.00074
+ 0.06%
--
GBPUSD
Pound Sterling / US Dollar
1.33164
1.33173
1.33164
1.33462
1.33136
-0.00148
-0.11%
--
XAUUSD
Gold / US Dollar
4211.32
4211.75
4211.32
4218.85
4190.61
+13.41
+ 0.32%
--
WTI
Light Sweet Crude Oil
59.192
59.222
59.192
60.084
59.160
-0.617
-1.03%
--

Community Accounts

Signal Accounts
--
Profit Accounts
--
Loss Accounts
--
View More

Become a signal provider

Sell trading signals to earn additional income

View More

Guide to Copy Trading

Get started with ease and confidence

View More

Signal Accounts for Members

All Signal Accounts

Best Return
  • Best Return
  • Best P/L
  • Best MDD
Past 1W
  • Past 1W
  • Past 1M
  • Past 1Y

All Contests

  • All
  • Trump Updates
  • Recommend
  • Stocks
  • Cryptocurrencies
  • Central Banks
  • Featured News
Top News Only
Share

India Foreign Ministry: Advise Indian Nationals To Exercise Caution While Travelling To Or Transiting Through China

Share

Christian Association Of Nigeria: Nigerian Government Rescues 100 Schoolchildren Kidnapped From Catholic School Last Month

Share

Mother Of Last Gaza Hostage Says Israel Won't Heal Until He's Back

Share

Agrural - Brazil's 2025/26 Total Corn Output Seen At 135.3 Million Tonnes Versus 141.1 Million Tonnes In Previous Season

Share

Agrural - Brazil's 2025/26 Soybean Planting Hits 94% Of Expected Area As Of Last Thursday

Share

S.Africa's Eskom Says Regulator Nersa Is Processing An Application For An Interim Tariff Adjustment For The Smelters, While Government Is Working On A Complementary Mechanism To Support A More Competitive Pricing Path For The Sector

Share

SEBI: Modalities For Migration To Ai Only Schemes And Relaxations To Large Value Funds For Accredited Investors

Share

All 6 Bank Of Israel Monetary Policy Committee Members Voted To Lower Benchmark Interest Rate 25 Bps To 4.25% On Nov 24

Share

India Government: Cancellations Are On Account Of Developer Delays And Not Due To Transmission Side Delays

Share

Fitch: We See Moderation Of Export Performance In China In 2026

Share

India Government: Revokes Grid Access Permissions For Renewable Energy Projects

Share

Stats Office - Tanzania Inflation At 3.4% Year-On-Year In November

Share

Temasek CEO Dilhan Pillay: We Are Taking A Conservative Stance On Allocating Capital

Share

Brazil Economists See Brazilian Real At 5.40 Per Dollar By Year-End 2025 Versus 5.40 In Previous Estimate - Central Bank Poll

Share

Brazil Economists See Year-End 2026 Interest Rate Selic At 12.25% Versus 12.00% In Previous Estimate - Central Bank Poll

Share

Brazil Economists See Year-End 2025 Interest Rate Selic At 15.00% Versus 15.00% In Previous Estimate - Central Bank Poll

Share

EU Commission Says Meta Has Committed To Give EU Users Choice On Personalised Ads

Share

Sources Revealed That The Bank Of England Has Invited Employees To Voluntarily Apply For Layoffs

Share

The Bank Of England Plans To Cut Staff Due To Budget Pressures

Share

Traders Believe There Is Less Than A 10% Chance That The European Central Bank Will Cut Interest Rates By 25 Basis Points In 2026

TIME
ACT
FCST
PREV
France Industrial Output MoM (SA) (Oct)

A:--

F: --

P: --
France Trade Balance (SA) (Oct)

A:--

F: --

P: --
Euro Zone Employment YoY (SA) (Q3)

A:--

F: --

P: --
Canada Part-Time Employment (SA) (Nov)

A:--

F: --

P: --

Canada Unemployment Rate (SA) (Nov)

A:--

F: --

P: --

Canada Full-time Employment (SA) (Nov)

A:--

F: --

P: --

Canada Labor Force Participation Rate (SA) (Nov)

A:--

F: --

P: --

Canada Employment (SA) (Nov)

A:--

F: --

P: --

U.S. PCE Price Index MoM (Sept)

A:--

F: --

P: --

U.S. Personal Income MoM (Sept)

A:--

F: --

P: --

U.S. Core PCE Price Index MoM (Sept)

A:--

F: --

P: --

U.S. PCE Price Index YoY (SA) (Sept)

A:--

F: --

P: --

U.S. Core PCE Price Index YoY (Sept)

A:--

F: --

P: --

U.S. Personal Outlays MoM (SA) (Sept)

A:--

F: --

P: --
U.S. 5-10 Year-Ahead Inflation Expectations (Dec)

A:--

F: --

P: --

U.S. Real Personal Consumption Expenditures MoM (Sept)

A:--

F: --

P: --
U.S. Weekly Total Rig Count

A:--

F: --

P: --

U.S. Weekly Total Oil Rig Count

A:--

F: --

P: --

U.S. Consumer Credit (SA) (Oct)

A:--

F: --

P: --
China, Mainland Foreign Exchange Reserves (Nov)

A:--

F: --

P: --

Japan Trade Balance (Oct)

A:--

F: --

P: --

Japan Nominal GDP Revised QoQ (Q3)

A:--

F: --

P: --

China, Mainland Imports YoY (CNH) (Nov)

A:--

F: --

P: --

China, Mainland Exports (Nov)

A:--

F: --

P: --

China, Mainland Imports (CNH) (Nov)

A:--

F: --

P: --

China, Mainland Trade Balance (CNH) (Nov)

A:--

F: --

P: --

China, Mainland Exports YoY (USD) (Nov)

A:--

F: --

P: --

China, Mainland Imports YoY (USD) (Nov)

A:--

F: --

P: --

Germany Industrial Output MoM (SA) (Oct)

A:--

F: --

P: --
Euro Zone Sentix Investor Confidence Index (Dec)

A:--

F: --

P: --

Canada National Economic Confidence Index

--

F: --

P: --

U.K. BRC Like-For-Like Retail Sales YoY (Nov)

--

F: --

P: --

U.K. BRC Overall Retail Sales YoY (Nov)

--

F: --

P: --

Australia Overnight (Borrowing) Key Rate

--

F: --

P: --

RBA Rate Statement
RBA Press Conference
Germany Exports MoM (SA) (Oct)

--

F: --

P: --

U.S. NFIB Small Business Optimism Index (SA) (Nov)

--

F: --

P: --

Mexico 12-Month Inflation (CPI) (Nov)

--

F: --

P: --

Mexico Core CPI YoY (Nov)

--

F: --

P: --

Mexico PPI YoY (Nov)

--

F: --

P: --

U.S. Weekly Redbook Index YoY

--

F: --

P: --

U.S. JOLTS Job Openings (SA) (Oct)

--

F: --

P: --

China, Mainland M1 Money Supply YoY (Nov)

--

F: --

P: --

China, Mainland M0 Money Supply YoY (Nov)

--

F: --

P: --

China, Mainland M2 Money Supply YoY (Nov)

--

F: --

P: --

U.S. EIA Short-Term Crude Production Forecast For The Year (Dec)

--

F: --

P: --

U.S. EIA Natural Gas Production Forecast For The Next Year (Dec)

--

F: --

P: --

U.S. EIA Short-Term Crude Production Forecast For The Next Year (Dec)

--

F: --

P: --

EIA Monthly Short-Term Energy Outlook
U.S. API Weekly Gasoline Stocks

--

F: --

P: --

U.S. API Weekly Cushing Crude Oil Stocks

--

F: --

P: --

U.S. API Weekly Crude Oil Stocks

--

F: --

P: --

U.S. API Weekly Refined Oil Stocks

--

F: --

P: --

South Korea Unemployment Rate (SA) (Nov)

--

F: --

P: --

Japan Reuters Tankan Non-Manufacturers Index (Dec)

--

F: --

P: --

Japan Reuters Tankan Manufacturers Index (Dec)

--

F: --

P: --

Japan Domestic Enterprise Commodity Price Index MoM (Nov)

--

F: --

P: --

Japan Domestic Enterprise Commodity Price Index YoY (Nov)

--

F: --

P: --

China, Mainland PPI YoY (Nov)

--

F: --

P: --

China, Mainland CPI MoM (Nov)

--

F: --

P: --

Q&A with Experts
    • All
    • Chatrooms
    • Groups
    • Friends
    Connecting
    .
    .
    .
    Type here...
    Add Symbol or Code

      No matching data

      All
      Trump Updates
      Recommend
      Stocks
      Cryptocurrencies
      Central Banks
      Featured News
      • All
      • Russia-Ukraine Conflict
      • Middle East Flashpoint
      • All
      • Russia-Ukraine Conflict
      • Middle East Flashpoint
      Search
      Products

      Charts Free Forever

      Chats Q&A with Experts
      Screeners Economic Calendar Data Tools
      Membership Features
      Data Warehouse Market Trends Institutional Data Policy Rates Macro

      Market Trends

      Market Sentiment Order Book Forex Correlations

      Top Indicators

      Charts Free Forever
      Markets

      News

      News Analysis 24/7 Columns Education
      From Institutions From Analysts
      Topics Columnists

      Latest Views

      Latest Views

      Trending Topics

      Top Columnists

      Latest Update

      Signals

      Copy Rankings Latest Signals Become a signal provider AI Rating
      Contests
      Brokers

      Overview Brokers Assessment Rankings Regulators News Claims
      Broker listing Forex Brokers Comparison Tool Live Spread Comparison Scam
      Q&A Complaint Scam Alert Videos Tips to Detect Scam
      More

      Business
      Events
      Careers About Us Advertising Help Center

      White Label

      Data API

      Web Plug-ins

      Affiliate Program

      Awards Institution Evaluation IB Seminar Salon Event Exhibition
      Vietnam Thailand Singapore Dubai
      Fans Party Investment Sharing Session
      FastBull Summit BrokersView Expo
      Recent Searches
        Top Searches
          Markets
          News
          Analysis
          User
          24/7
          Economic Calendar
          Education
          Data
          • Names
          • Latest
          • Prev

          View All

          No data

          Scan to Download

          Faster Charts, Chat Faster!

          Download App
          English
          • English
          • Español
          • العربية
          • Bahasa Indonesia
          • Bahasa Melayu
          • Tiếng Việt
          • ภาษาไทย
          • Français
          • Italiano
          • Türkçe
          • Русский язык
          • 简中
          • 繁中
          Open Account
          Search
          Products
          Charts Free Forever
          Markets
          News
          Signals

          Copy Rankings Latest Signals Become a signal provider AI Rating
          Contests
          Brokers

          Overview Brokers Assessment Rankings Regulators News Claims
          Broker listing Forex Brokers Comparison Tool Live Spread Comparison Scam
          Q&A Complaint Scam Alert Videos Tips to Detect Scam
          More

          Business
          Events
          Careers About Us Advertising Help Center

          White Label

          Data API

          Web Plug-ins

          Affiliate Program

          Awards Institution Evaluation IB Seminar Salon Event Exhibition
          Vietnam Thailand Singapore Dubai
          Fans Party Investment Sharing Session
          FastBull Summit BrokersView Expo

          USDCHF: Diverging Policies From The Fed And Snb – What to Expect?

          Blue River

          Technical Analysis

          Summary:

          The USDCHF has been at the centre of attention following the monetary policy decisions of the Federal Reserve (Fed) and the Swiss National Bank (SNB). What can we expect now?

          USDCHF: What Do the Fed and the SNB Say?

          The USDCHF has been at the centre of attention following the monetary policy decisions of the Federal Reserve (Fed) and the Swiss National Bank (SNB). What can we expect now?

          The Fed Holds Rates, but the Dot Plot Gives Clues…

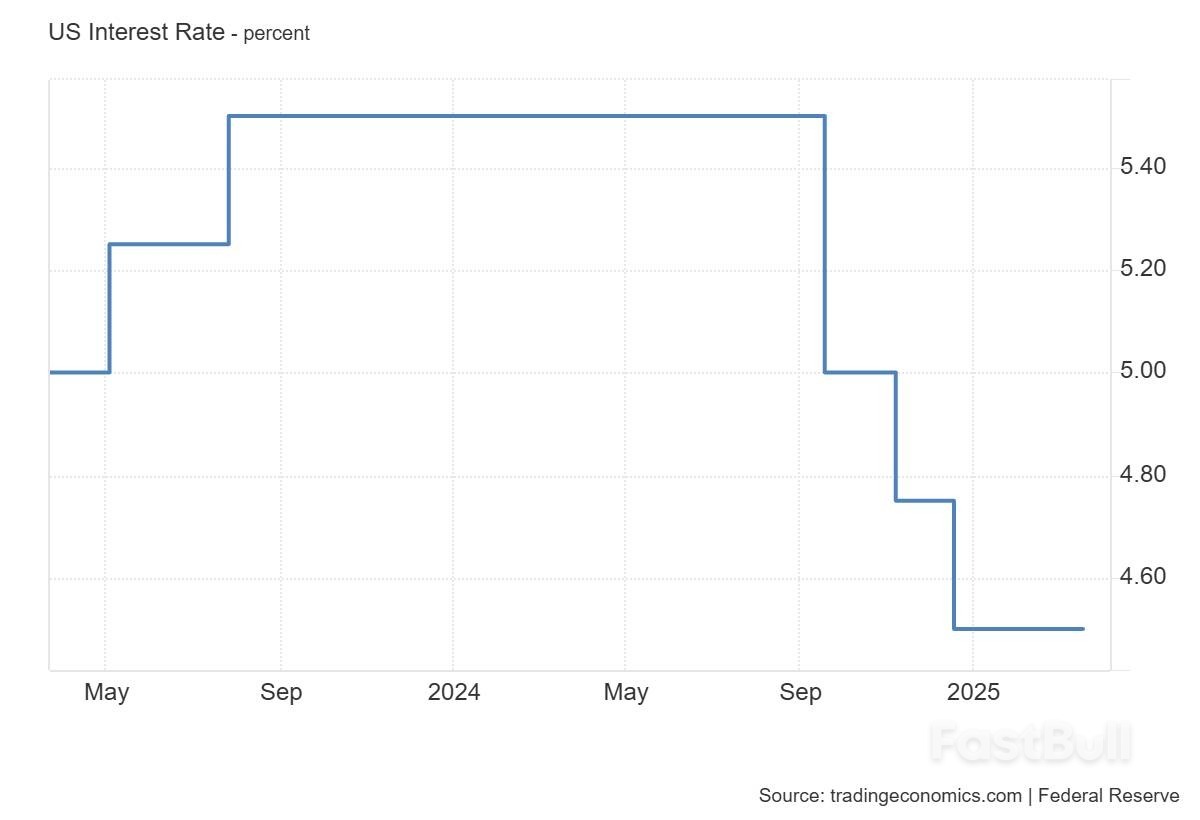
          Yesterday, the Fed kept rates unchanged at 4.25%-4.5%, citing economic uncertainty and inflation risks. Powell mentioned concerns about tariffs and immigration restrictions.

          The Dot Plot showed that most FOMC members expect only two rate cuts in 2025. This suggests that the Fed intends to maintain control over inflation and avoid loosening too quickly.

          The SNB Cuts Rates… and Could Keep Going

          Meanwhile, the SNB surprised the market by reducing its interest rate by 25 basis points, bringing it to 0.25%, its lowest level since 2022. This is the fifth rate cut since 2024, signalling concerns over low inflation and economic risks.

          Additionally, the SNB clarified that it is still ready to intervene in the forex market if necessary.

          What Happens Next with USDCHF?

          The divergence is clear: the Fed remains cautious with rate cuts, while the SNB continues to loosen its monetary policy. This could support USDCHF in the short term, although volatility will depend on upcoming macroeconomic data and market sentiment.

          Will the dollar rebound, or will the Swiss franc resist? Stay tuned for the next moves!

          Technical Analysis – USDCHF, H4

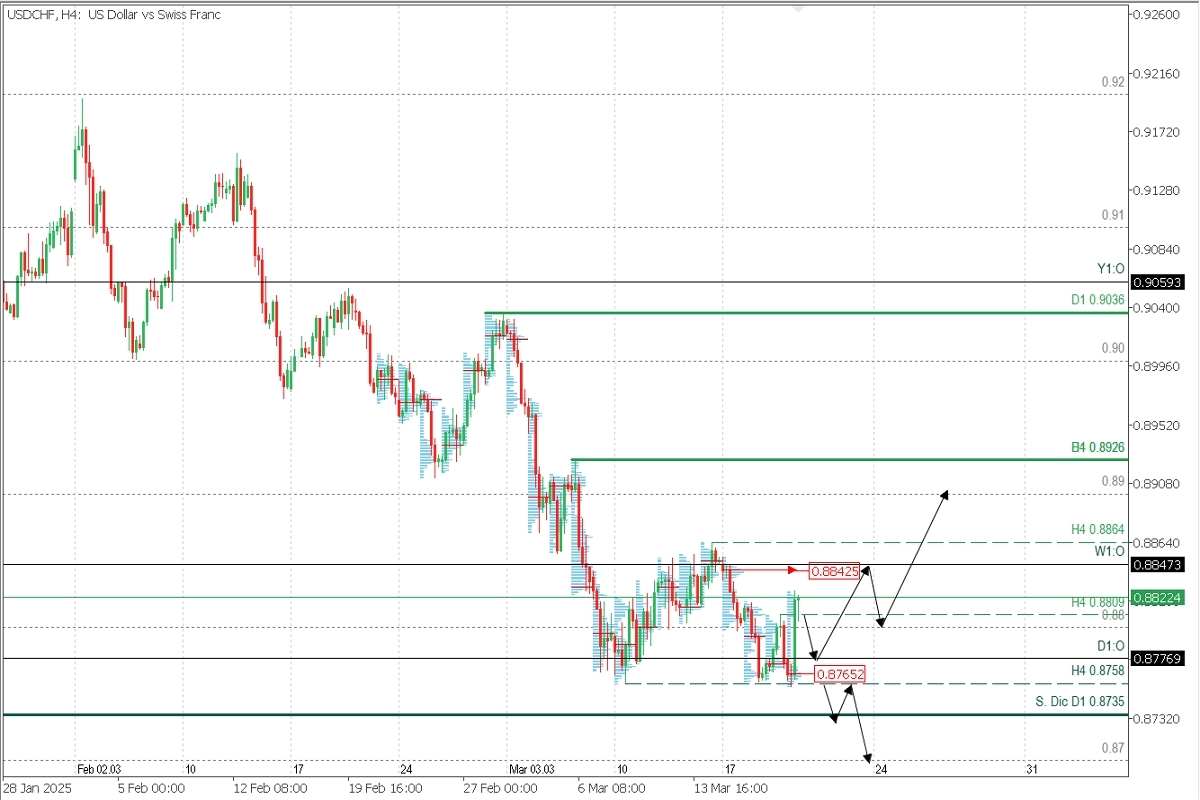
          Supply Zones (Sell): 0.8842 // 0.89
          Demand Zones (Buy): 0.8765

          The recent SNB rate cut was the main driver of the price rally during the European morning, causing a breakout of the key H4 resistance at 0.8809, leaving a wide-range bullish candle with inefficiency (volume void) that the market typically corrects.

          In this context, a pullback is expected to cover that area, seeking liquidity at the daily open (D1:O) 0.8776 and the Asian POC at 0.8765, demand zones (buy) that will likely be defended by bulls to trigger a new price rally towards the next supply zone at 0.8842, confirming the intraday bullish reversal. Only after breaking this level can we consider extending buys towards 0.89 and the next daily key resistance at 0.8926.

          On the other hand, if the demand zone between 0.8776 and 0.8765 is decisively broken, the bullish trend will continue, as an increase in sell orders will likely lead to a break below December’s support at 0.8735, extending the decline towards the psychological level at 0.87.

          Technical Summary

          • Bearish Scenario: Sell below 0.8809 with targets at 0.8777 and 0.8765, where we could return to buy if an intraday bullish reversal pattern forms on M5. If this doesn’t occur, sales will continue towards 0.8735 and 0.87 in extension.
          • Bullish Scenario: Buy above 0.870 (waiting to form and confirm a reversal pattern on M5) with targets at 0.8842, 0.8864, and 0.89 in extension.

          Source: ACTIONFOREX

          Risk Warnings and Disclaimers
          You understand and acknowledge that there is a high degree of risk involved in trading. Following any strategies or investment methods may lead to potential losses. The content on the site is provided by our contributors and analysts for information purposes only. You are solely responsible for determining whether any trading assets, securities, strategy, or any other product is suitable for investing based on your own investment objectives and financial situation.
          Add to Favorites
          Share

          Crypto Market Surges As Fomc Holds Rates Steady, Will A Breakout Follow?

          Glendon

          Cryptocurrency

          According to Santiment, the Federal Open Market Committee (FOMC) has left interest rates unchanged, sparking positive sentiment in cryptocurrency and equity markets. Jerome Powell confirmed expectations of two rate cuts later this year.

          However, economic growth projections have dropped from 2.1% to 1.7%, reflecting ongoing inflationary pressures. Additionally, Powell stated that tariffs could delay inflation reduction efforts. While the Fed acknowledged a slightly higher recession probability, investors have responded with renewed confidence.

          Source: Santiment

          Market Momentum Builds After Key Announcement

          Following Powell’s statements, the cryptocurrency market, excluding Bitcoin and Ethereum, showed signs of strength. A recent TradingView analysis highlights a descending channel pattern. The market has consistently formed lower highs and lower lows, reflecting an extended downtrend. However, a bounce from the lower trendline suggests increasing buying pressure.

          The total market cap stands at $823.7 billion, steadily approaching upper resistance. A breakout above this level could signal a bullish trend reversal. Analysts project a potential 41.05% gain, adding $349.9 billion in market value.

          Technical Indicators Suggest Possible Breakout

          Analyst Captain Faibik illustrates a clear descending channel, with parallel trendlines guiding price action. The market has respected both resistance and support levels throughout this cycle. Moreover, multiple breakout attempts indicate mounting buying momentum. If the market surpasses resistance, bullish investors may push prices higher. The projected price target falls within the green zone on the chart, reinforcing optimism.

          Source: Captain Faibik

          Santiment highlights the increasing correlation between cryptocurrencies and traditional equities. Powell’s comments reinforce this trend, suggesting crypto markets may mirror stock market movements. However, individual altcoins remain highly volatile, driven by independent market factors.

          Source: CryptoSlate

          Risk Warnings and Disclaimers
          You understand and acknowledge that there is a high degree of risk involved in trading. Following any strategies or investment methods may lead to potential losses. The content on the site is provided by our contributors and analysts for information purposes only. You are solely responsible for determining whether any trading assets, securities, strategy, or any other product is suitable for investing based on your own investment objectives and financial situation.
          Add to Favorites
          Share

          Trump Says Fed Would Be 'Much Better Off' Lowering Rates As Tariffs Start

          Glendon

          Economic

          Forex

          President Donald Trump waves after announcing Federal Reserve board member Jerome Powell as his nominee for chair of the Federal Reserve in 2017. (Photo by Jabin Botsford/The Washington Post via Getty Images) · The Washington Post via Getty Images

          President Trump once again turned up the pressure on the Federal Reserve, saying Wednesday evening on social media that the central bank would "be much better off" lowering interest rates as tariffs go into effect.

          The comments on Truth Social came after the Fed held interest rates steady Wednesday for the second meeting in a row and maintained a prior prediction for two rate cuts at some point this year.

          What the central bank did change, however, was its outlook on inflation (higher) and economic growth (lower), with Fed Chair Jerome Powell saying that a driving reason for the change was uncertainty stemming from Trump's plans for an aggressive slate of new tariffs on top of new duties already imposed on China, Canada, and Mexico.

          The president has promised to unveil "reciprocal" tariffs on many countries April 2, which he has taken to calling "liberation day."

          "The Fed would be MUCH better off CUTTING RATES as U.S.Tariffs start to transition (ease!) their way into the economy," Trump said in his post on Truth Social. "Do the right thing. April 2nd is Liberation Day in America!!!"

          President Donald Trump waves after announcing Federal Reserve board member Jerome Powell as his nominee for chair of the Federal Reserve in 2017. (Photo by Jabin Botsford/The Washington Post via Getty Images) · The Washington Post via Getty Images

          Powell did not shy away from the impact of Trump’s tariffs during a highly anticipated press conference Wednesday.

          The Fed chairman said in no uncertain terms that Trump's trade agenda would be likely to drive up prices, even amid considerable uncertainty about exactly how much — and whether the price changes would be "transitory."

          In just one example Wednesday afternoon during a question about price stability, Powell said that inflation had previously neared the Fed's key goal but now "I do think with the arrival of the tariff inflation, further progress may be delayed."

          Some analysts raised questions about the Fed's unchanged overall prediction of two cuts this year even as Trump's trade policy has roiled markets and cut back projections of economic growth for the remainder of the year.

          "We continue to think that Fed officials are underestimating the extent to which tariffs are likely to push up inflation," Capitol Economics said in a note immediately after Wednesday's decision but before the press conference.

          At other points in his press conference Wednesday, Powell also said that the exact effects of tariffs on prices were uncertain, may never be exactly known, and could even be temporary.

          He called the price effects of tariffs potentially "transitory" — reusing a much-scrutinized word that was deployed by the Fed and other economic officials in 2021 as prices started to rise during Joe Biden's presidency.

          Powell then called a transitory effect on prices "kind of the base case but we really can't know that" as he maintained the Fed's long-held wait-and-see approach to actually responding to Trump's still unfolding economic agenda.
          It was a term that many — especially Trump allies — criticized for years after it was used only to see rising prices last longer than expected.
          Trump's team has begun to use similar language to say any price effects from tariffs will be temporary and that the economy is in a "transition."
          "Tariffs are a one-time price adjustment," Treasury Secretary Scott Bessent said in another recent example.
          Trump’s pointed comments on rates follow a period when Trump has softened his criticisms of the Fed's monetary policy decisions and even made it clear he doesn’t intend to fire Powell, someone he criticized repeatedly during his first term.
          Bessent and other Trump aides have repeated said that the president is not focused on the Fed and is instead trying to bring down 10-year Treasury yields.
          "Notice that he has stopped calling for the Fed to cut rates," Bessent said during a speech earlier this month, referring to the president.
          But it's clear the White House does want a closer relationship with the central bank — and other independent agencies — after issuing a new executive order last week that gives Trump's appointees more power over such agencies.
          The new order makes clear that monetary policy — the direction of interest rates — will remain under the Fed's full control, but that the Fed's oversight of the country's biggest banks will now have a closer connection to the policies and priorities of the White House.
          Powell was asked at his press conference Wednesday if Trump’s recent firings of board members at the FTC, another independent agency, loomed as a threat to the Fed’s independence as well.
          “I did answer that question” he said, referring to comments made last November that any removal of Powell is “not permitted by law.”
          “I have no desire to change that answer and have nothing new on that for you today.”

          Source: Yahoo Finance

          To stay updated on all economic events of today, please check out our Economic calendar
          Risk Warnings and Disclaimers
          You understand and acknowledge that there is a high degree of risk involved in trading. Following any strategies or investment methods may lead to potential losses. The content on the site is provided by our contributors and analysts for information purposes only. You are solely responsible for determining whether any trading assets, securities, strategy, or any other product is suitable for investing based on your own investment objectives and financial situation.
          Add to Favorites
          Share

          Ethereum (eth) Make-or-Break Moment: These Key Levels Signal Its Next Big Move

          Michelle

          Cryptocurrency

          Ethereum (ETH) is currently trading at $2014, having successfully broken through the $1950 resistance level, which has now turned into a key support zone. The $2000 level is crucial in determining whether ETH continues its upward trajectory or faces a pullback. If this support holds, buyers may gain momentum to push the price higher. However, failure to maintain this level could trigger a deeper retracement.

          Key Support and Resistance Levels

          • Support Levels: $2000, $1950, $1800
          • Resistance Levels: $2150, $2225

          Bullish Outlook: Targeting $2225 and Beyond

          If Ethereum (ETH) remains above the $2000 support, bullish momentum may build, driving the price toward $2150, a critical resistance point. A decisive break above $2150 could spark a further rally, sending ETH toward the $2225 resistance level.

          At $2225, some traders may take profits, leading to a temporary pullback. However, if buyers sustain their pressure, Ethereum (ETH) could maintain its bullish momentum, setting the stage for a long-term uptrend.

          Bearish Outlook: Potential Drop to $1800

          If ETH fails to hold $2000, increased selling pressure could drive it back to the $1950 support zone. A break below this level may result in further downside movement, with ETH potentially sliding to $1800, a crucial support area.

          Should bearish momentum persist, Ethereum (ETH) could experience a more extended decline, testing even lower levels before stabilizing.

          However, Ethereum’s (ETH) next move largely depends on how it reacts to the $2000 support level. A strong rebound from this zone could fuel a rally toward $2150 and $2225, while a breakdown might trigger a decline to $1800. Traders should monitor these levels closely as ETH prepares for its next significant move.

          Source: CryptoSlate

          Risk Warnings and Disclaimers
          You understand and acknowledge that there is a high degree of risk involved in trading. Following any strategies or investment methods may lead to potential losses. The content on the site is provided by our contributors and analysts for information purposes only. You are solely responsible for determining whether any trading assets, securities, strategy, or any other product is suitable for investing based on your own investment objectives and financial situation.
          Add to Favorites
          Share

          Oil Erases Gains As Traders Assess Fed Stance, Trump’s Rate Push

          Glendon

          Commodity

          (Bloomberg) -- Oil erased gains as global markets were buffeted by mixed signals from the Federal Reserve and Donald Trump.

          Brent traded below $71 a barrel, with US equity futures also reversing an earlier increase. Fed Chair Jerome Powell acknowledged the high degree of uncertainty from the US president’s policies, but said the central bank is in no hurry to cut rates.

          Trump, meanwhile, said the Fed should reduce borrowing costs, splitting with policymakers weighing the economic cost of his tariff push. New Fed projections showed lower growth forecasts but higher inflation estimates. The Treasury market boosted its bets on lower rates.

          Crude remains markedly below its mid-January peak, as a confluence of bearish factors pressures prices. While the escalating trade war threatens to hit energy demand as tariffs and counter levies are imposed, OPEC and its allies are set to raise output from April, contributing to weaker global balances.

          “US tariff news is likely to keep oil prices volatile,” said Giovanni Staunovo, a commodity analyst at UBS Group AG. “That said, we retain our moderately constructive outlook for crude prices.”

          US inventories of gasoline, meanwhile, fell last week to the lowest since the start of the year, while distillates — a category that includes diesel — also sank, allaying concerns about consumption. Crude stockpiles rose less than flagged in an industry report, while levels dropped at the Cushing, Oklahoma, hub.

          Source: Yahoo Finance

          Risk Warnings and Disclaimers
          You understand and acknowledge that there is a high degree of risk involved in trading. Following any strategies or investment methods may lead to potential losses. The content on the site is provided by our contributors and analysts for information purposes only. You are solely responsible for determining whether any trading assets, securities, strategy, or any other product is suitable for investing based on your own investment objectives and financial situation.
          Add to Favorites
          Share

          Why Is Bitcoin Price Up Today?

          Warren Takunda

          Cryptocurrency

          Bitcoin price has jumped by 4% in the last 24 hours to reach over $86,000 on March 20. At its intraday high, the cryptocurrency was trading for $87,470, signaling modest profit-taking among traders.Why Is Bitcoin Price Up Today?_1

          BTC/USD four-hour price chart. Source: TradingView

          Top catalysts that have driven Bitcoin prices higher today include:
          Gains across risk assets after the Federal Reserve’s dovish signals.
          Rising BTC supply among long-term holders’ addresses.

          Bitcoin rises after Fed calms trade war bears

          Bitcoin rose as the Federal Reserve signaled it still expects to cut interest rates twice later this year, easing investor concerns over prolonged monetary tightening.
          Key takeaways from the Federal Open Market Committee’s meeting on March 19:
          The Fed kept its benchmark rate on hold while acknowledging that tariff-driven inflation pressures may be “transitory.”
          Chair Jerome Powell’s measured tone on recession risk, stating it was "not high," reassured risk-on investors.
          The Fed trimmed its growth forecast, fueling a bond rally and reinforcing expectations of lower borrowing costs in the future.Why Is Bitcoin Price Up Today?_2

          US 2-year and 10-year Treasury note yields daily chart. Source: TradingView

          Lower interest rates make risk assets like Bitcoin more attractive, as they reduce the opportunity cost of holding non-yielding investments.
          US President Donald Trump’s renewed pressure on the Fed to cut rates added to speculation that monetary policy may loosen further, benefiting Bitcoin.

          Long-term Bitcoin holders turn to accumulation

          Bitcoin’s ongoing price rise coincides with signs of accumulation among its long-term holders: entities holding BTC for more than 155 days.
          Key points:
          Long-term holder (LTH) spending pressure is waning, as indicated by a slowdown in the Binary Spending Indicator and a rise in LTH supply.
          A greater willingness to hold rather than sell suggests a shift away from sell-side distribution.Why Is Bitcoin Price Up Today?_3

          Bitcoin long-term holder spending Binary Indicator. Source: Glassnode

          A brief but sharp spike in LTH distribution (the red bars in the chart below) occurred when Bitcoin dropped to four-month lows, as some investors took profits.
          Bull markets typically see sell-side pressure from LTHs balanced by new demand, and this cycle has absorbed a similar volume of LTH profits as previous ones.Why Is Bitcoin Price Up Today?_4

          Bitcoin long-term holder balance sent to exchanges. Source: Glassnode

          “This perhaps alludes to a degree of saturation being reached among Long-term holders, where they have completed a majority of their sell-side activity within the current price range,” wrote Glassnode analysts in their latest weekly report.

          Bitcoin bounces from technical support

          Bitcoin price rise today comes after testing the lower trendline of its prevailing ascending channel pattern.
          What to note:
          Bitcoin has been trending higher inside the ascending channel since March 9.
          The cryptocurrency has since tested the channel’s lower boundary thrice, the latest being on March 18.Why Is Bitcoin Price Up Today?_5

          BTC/USD four-hour price chart. Source: TradingView

          The first two scenarios led to 7.50% and 6.60% bounce — while the current one preceded 7.60% gains.
          As of March 20, BTC/USD was facing stiff resistance around the channel’s upper boundary, aligning with the 200-4H EMA (the blue wave) near $87,830.
          A decisive pullback may lead the pair initially toward the 50-4H EMA at around $83,900.
          A further correction could have it test the channel’s lower boundary as support, aligning with $82,400, which served as support between March 16 and March 17.

          Source: Cointelegraph

          Risk Warnings and Disclaimers
          You understand and acknowledge that there is a high degree of risk involved in trading. Following any strategies or investment methods may lead to potential losses. The content on the site is provided by our contributors and analysts for information purposes only. You are solely responsible for determining whether any trading assets, securities, strategy, or any other product is suitable for investing based on your own investment objectives and financial situation.
          Add to Favorites
          Share

          Bitcoin’s Reaction to Fed Rate Changes: Key Insights for Traders

          Michelle

          Cryptocurrency

          After the recent Federal Open Market Committee meeting, the US Federal Reserve, yesterday, announced its plan to keep its federal funds rate unchanged at 4.25%-4.5%. Every FOMC meeting influences Bitcoin prices, sometimes causing major swings. In the last 24 hours, the price of BTC has seen a rise of 3.1%. This report looks at past rate hikes, how Bitcoin reacted and what traders can expect going forward. Ready? Dive in!

          How the Fed’s Rate Hike Shook Bitcoin: An Overview

          In April 2022, the Fed funds interest rate was as low as 0.5%. It was in May 2022 that the US Fed decided to revisit its interest rate policy. The primary reason was that the inflation rate had reached as high as 8.6% in May 2022. In June, the inflation rate touched a peak of 9.1% - the highest in a decade.

          Between May 2022 and July 2023, the US Fed consistently pushed the interest rate upwards. By July 2023, it had reached as high as 5.5%. The level remained unchanged until August 2024.

          In August 2024, the inflation rate fell to 2.5%. In fact, between June 2022 and June 2023, the rate declined consistently.

          It was in September 2024 that the US Fed reversed its stance on the interest rate policy. In September, the interest rate was reduced from 5.5% to 5%. In November, it was lowered to 4.75%. In December, for the third time in 2024, it was brought down to 4.5%.

          Bitcoin’s Response to Recent FOMC Meetings

          In the March 2024 FOMC meeting, the US Fed decided to keep the interest rate unchanged at 5.5%. Initially, the Bitcoin market reacted positively, pushing the price to a new ATH. In April 2024, the market moved sideways, trading within a range of $71K and $61K.

          In the May 2024 FOMC meeting, the Fed showed no interest in making any changes. The BTC market showed small signs of recovery.

          In the June 2024 FOMC meeting, even though the Fed acknowledged the moderation in inflation, they decided to keep the interest rate unchanged. At one point in June 2024, the BTC price dropped as low as $58,360.67.

          In the July 2024 FOMC meeting also, the Fed refrained from making changes. The BTC market plummeted sharply after the meeting. At one point on August 5, it dropped to a low of $48,919.60.

          In the September 2024 meeting, the Fed reversed its interest rate policy. It reduced the rate by 25 basis points to 5%. Within ten days of the meeting, the Bitcoin price climbed by 10%. This marked the beginning of a new bull run in the market.

          In the November 2024 meeting, the Fed implemented another 25 basis point reduction. November 2024 was a fantastic month for BTC. A favourable macroeconomic and political environment, fueled by Donald Trump’s victory in the US presidential election, contributed to Bitcoin’s steep growth.

          In the December 2024 meeting, the Fed reduced the interest rate to 4.5%. It was the third and final reduction implemented by the Fed in 2024. In December, the BTC price touched a new ATH of 108K.

          In the January 2025 FOMC meeting, the Fed returned to its “wait and watch” policy. It kept the interest rate unchanged at 4.5%. By January 2025, the Bitcoin market lost the bullish momentum, which had helped the asset reach its ATH of $109K.

          Source: CryptoSlate

          Risk Warnings and Disclaimers
          You understand and acknowledge that there is a high degree of risk involved in trading. Following any strategies or investment methods may lead to potential losses. The content on the site is provided by our contributors and analysts for information purposes only. You are solely responsible for determining whether any trading assets, securities, strategy, or any other product is suitable for investing based on your own investment objectives and financial situation.
          Add to Favorites
          Share
          FastBull
          Copyright © 2025 FastBull Ltd

          728 RM B 7/F GEE LOK IND BLDG NO 34 HUNG TO RD KWUN TONG KLN HONG KONG

          TelegramInstagramTwitterfacebooklinkedin
          App Store Google Play Google Play
          Products
          Charts

          Chats

          Q&A with Experts
          Screeners
          Economic Calendar
          Data
          Tools
          Membership
          Features
          Function
          Markets
          Copy Trading
          Latest Signals
          Contests
          News
          Analysis
          24/7
          Columns
          Education
          Company
          Careers
          About Us
          Contact Us
          Advertising
          Help Center
          Feedback
          User Agreement
          Privacy Policy
          Business

          White Label

          Data API

          Web Plug-ins

          Poster Maker

          Affiliate Program

          Risk Disclosure

          The risk of loss in trading financial instruments such as stocks, FX, commodities, futures, bonds, ETFs and crypto can be substantial. You may sustain a total loss of the funds that you deposit with your broker. Therefore, you should carefully consider whether such trading is suitable for you in light of your circumstances and financial resources.

          No decision to invest should be made without thoroughly conducting due diligence by yourself or consulting with your financial advisors. Our web content might not suit you since we don't know your financial conditions and investment needs. Our financial information might have latency or contain inaccuracy, so you should be fully responsible for any of your trading and investment decisions. The company will not be responsible for your capital loss.

          Without getting permission from the website, you are not allowed to copy the website's graphics, texts, or trademarks. Intellectual property rights in the content or data incorporated into this website belong to its providers and exchange merchants.

          Not Logged In

          Log in to access more features

          FastBull Membership

          Not yet

          Purchase

          Become a signal provider
          Help Center
          Customer Service
          Dark Mode
          Price Up/Down Colors

          Log In

          Sign Up

          Position
          Layout
          Fullscreen
          Default to Chart
          The chart page opens by default when you visit fastbull.com