


Markets
News
Analysis
User
24/7
Economic Calendar
Education
Data
- Names
- Latest
- Prev


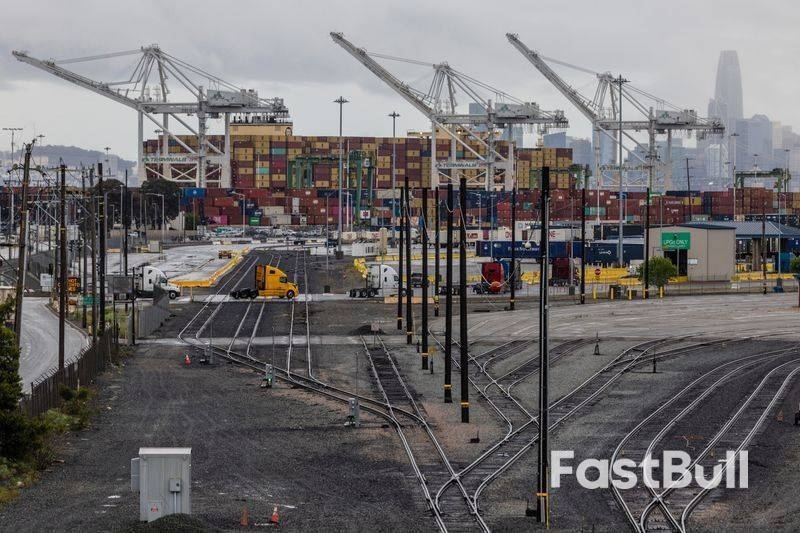
The U.S. trade deficit narrowed sharply in April, with imports decreasing by the most on record as the front-running of goods ahead of tariffs ebbed, which could provide a lift to economic growth this quarter.
The U.S. trade deficit narrowed sharply in April, with imports decreasing by the most on record as the front-running of goods ahead of tariffs ebbed, which could provide a lift to economic growth this quarter.
The trade gap contracted by a record 55.5% to $61.6 billion, the lowest level since September 2023, the Commerce Department's Bureau of Economic Analysis said on Thursday. Data for March was revised to show the trade deficit having widened to an all-time high of $138.3 billion rather than the previously reported $140.5 billion.
Economists polled by Reuters forecast the deficit narrowing to $70.0 billion. The goods trade deficit eased by a record 46.2% to $87.4 billion, the lowest level since October 2023.
A rush to beat import duties helped to widen the trade deficit in the first quarter, which accounted for a large part of the 0.2% annualized rate of decline in gross domestic product last quarter. The contraction in the deficit, at face value, suggests that trade could significantly add to GDP this quarter, but much would depend on the state of inventories.
Imports decreased by a record 16.3% to $351.0 billion in April. Goods imports slumped by a record 19.9% to $277.9 billion. They were held down by a $33.0 billion decline in imports of consumer goods, mostly pharmaceutical preparations from Ireland. Imports of cellphones and other household goods fell $3.5 billion.
Imports of industrial supplies and materials declined $23.3 billion, reflecting decreases in finished metal shapes and other precious metals.
Motor vehicle, parts and engines imports fell $8.3 billion with passenger cars accounting for much of the decline. The front-loading of imports is probably not over. Higher duties for most countries have been postponed until July, while those for Chinese goods have been delayed until mid-August.
President Donald Trump's administration had given U.S. trade partners until Wednesday to make their "best offers" to avoid other punishing import levies from taking effect in early July.
Imports from Canada were the lowest since May 2021, while those from China were the lowest since March 2020. But imports from Vietnam and Taiwan were the highest on record.
Exports rose 3.0% to $289.4 billion, an all-time high. Goods exports increased 3.4% to a record $190.5 billion. They were boosted by a $10.4 billion jump in industrial supplies and materials, mostly finished metal shapes, nonmonetary gold and crude oil.
Capital goods exports advanced $1.0 billion, lifted by computers. But exports of motor vehicles, parts and engines fell $3.3 billion, held down by passenger cars as well as trucks, buses and special purpose vehicles.
728 RM B 7/F GEE LOK IND BLDG NO 34 HUNG TO RD KWUN TONG KLN HONG KONG


The risk of loss in trading financial instruments such as stocks, FX, commodities, futures, bonds, ETFs and crypto can be substantial. You may sustain a total loss of the funds that you deposit with your broker. Therefore, you should carefully consider whether such trading is suitable for you in light of your circumstances and financial resources.
No decision to invest should be made without thoroughly conducting due diligence by yourself or consulting with your financial advisors. Our web content might not suit you since we don't know your financial conditions and investment needs. Our financial information might have latency or contain inaccuracy, so you should be fully responsible for any of your trading and investment decisions. The company will not be responsible for your capital loss.
Without getting permission from the website, you are not allowed to copy the website's graphics, texts, or trademarks. Intellectual property rights in the content or data incorporated into this website belong to its providers and exchange merchants.
Not Logged In
Log in to access more features

FastBull Membership
Not yet
Purchase


Log In
Sign Up


