• Trade
  • Markets
  • Copy
  • Contests
  • News
  • 24/7
  • Calendar
  • Q&A
  • Chats
Trending
Screeners
SYMBOL
LAST
BID
ASK
HIGH
LOW
NET CHG.
%CHG.
SPREAD
SPX
S&P 500 Index
6857.13
6857.13
6857.13
6865.94
6827.13
+7.41
+ 0.11%
--
DJI
Dow Jones Industrial Average
47850.93
47850.93
47850.93
48049.72
47692.96
-31.96
-0.07%
--
IXIC
NASDAQ Composite Index
23505.13
23505.13
23505.13
23528.53
23372.33
+51.04
+ 0.22%
--
USDX
US Dollar Index
98.760
98.840
98.760
98.980
98.750
-0.220
-0.22%
--
EURUSD
Euro / US Dollar
1.16682
1.16690
1.16682
1.16692
1.16408
+0.00237
+ 0.20%
--
GBPUSD
Pound Sterling / US Dollar
1.33588
1.33597
1.33588
1.33601
1.33165
+0.00317
+ 0.24%
--
XAUUSD
Gold / US Dollar
4226.51
4226.85
4226.51
4230.62
4194.54
+19.34
+ 0.46%
--
WTI
Light Sweet Crude Oil
59.391
59.428
59.391
59.469
59.187
+0.008
+ 0.01%
--

Community Accounts

Signal Accounts
--
Profit Accounts
--
Loss Accounts
--
View More

Become a signal provider

Sell trading signals to earn additional income

View More

Guide to Copy Trading

Get started with ease and confidence

View More

Signal Accounts for Members

All Signal Accounts

Best Return
  • Best Return
  • Best P/L
  • Best MDD
Past 1W
  • Past 1W
  • Past 1M
  • Past 1Y

All Contests

  • All
  • Trump Updates
  • Recommend
  • Stocks
  • Cryptocurrencies
  • Central Banks
  • Featured News
Top News Only
Share

Equinor: Preliminary Estimates Indicate Reservoirs May Contain Between 5 -18 Million Standard Cubic Meters Of Recoverable Oil Equivalents

Share

Japan Chief Cabinet Secretary Kihara: Government To Take Appropriate Steps On Excessive And Disorderly Moves In Foreign Exchange Market, If Necessary

Share

[Report: Amazon Pays €180 Million To Italy To End Tax And Labor Investigations] Amazon Has Paid A Settlement And Dismantled Its Monitoring System For Delivery Drivers In Italy, Ending An Investigation Into Alleged Tax Fraud And Illegal Labor Practices. In July 2024, The Group's Logistics Services Division Was Accused Of Circumventing Labor And Tax Laws By Relying On Cooperatives Or Limited Liability Companies To Supply Workers, Evading VAT, And Reducing Social Security Payments. Sources Say The Group Has Now Paid Approximately €180 Million To Italian Tax Authorities As Part Of A €1 Billion Settlement Involving 33 Companies

Share

Airbus - Booked 797 Gross Aircraft Orders In January-November

Share

[Market Update] Spot Gold Broke Through $4,230 Per Ounce, Up 0.51% On The Day

Share

Reserve Bank Of India Chief Malhotra: There Will Be Ample Liquidity As Long As We Are In An Easing Cycle

Share

Reserve Bank Of India Chief Malhotra: Quantum Of System Liquidity Will Be Managed To Ensure Monetary Transmission Is Happening

Share

China's Foreign Ministry: World Bank, IMF, WTO Top Officials To Join

Share

China's Foreign Ministry: China To Hold 1+1 Dialogue With International Economic Orgs On Dec 9

Share

Reserve Bank Of India Chief Malhotra: 5% Of Inr Depreciation Leads To 35 Bps Of Inflation

Share

Eurostoxx 50 Futures Up 0.14%, DAX Futures Up 0.12%, CAC 40 Futures Up 0.26%, FTSE Futures Up 0.03%

Share

Getlink - Over 1 Million Trucks Crossed Channel Since January 2025

Share

Malaysia International Reserves At $124.1 Billion On November 28 Versus$124.1 Billion On November 14 - Central Bank

Share

Reserve Bank Of India Chief Malhotra: Conscious Effort On Diversifying Gold Reserves

Share

Russian President Putin Thanks Indian Prime Minister Modi For Attention To Ukraine Peace Efforts

Share

Russian President Putin: India-Russia Relations Should Grow And Touch New Heights

Share

Russian President Putin: India Is Not Neutral, India Is On The Side Of Peace

Share

Russian President Putin: We Support Every Effort Towards Peace

Share

Russian President Putin: The World Should Return To Peace

Share

India Prime Minister Modi: We Should All Pursue Peace Together

TIME
ACT
FCST
PREV
Euro Zone IHS Markit Construction PMI (Nov)

A:--

F: --

P: --

Italy IHS Markit Construction PMI (Nov)

A:--

F: --

P: --

U.K. Markit/CIPS Construction PMI (Nov)

A:--

F: --

P: --

France 10-Year OAT Auction Avg. Yield

A:--

F: --

P: --

Euro Zone Retail Sales MoM (Oct)

A:--

F: --

P: --

Euro Zone Retail Sales YoY (Oct)

A:--

F: --

P: --

Brazil GDP YoY (Q3)

A:--

F: --

P: --

U.S. Challenger Job Cuts (Nov)

A:--

F: --

P: --

U.S. Challenger Job Cuts MoM (Nov)

A:--

F: --

P: --

U.S. Challenger Job Cuts YoY (Nov)

A:--

F: --

P: --

U.S. Initial Jobless Claims 4-Week Avg. (SA)

A:--

F: --

P: --

U.S. Weekly Initial Jobless Claims (SA)

A:--

F: --

P: --

U.S. Weekly Continued Jobless Claims (SA)

A:--

F: --

P: --

Canada Ivey PMI (SA) (Nov)

A:--

F: --

P: --

Canada Ivey PMI (Not SA) (Nov)

A:--

F: --

P: --

U.S. Non-Defense Capital Durable Goods Orders Revised MoM (Excl. Aircraft) (SA) (Sept)

A:--

F: --

P: --
U.S. Factory Orders MoM (Excl. Transport) (Sept)

A:--

F: --

P: --

U.S. Factory Orders MoM (Sept)

A:--

F: --

P: --

U.S. Factory Orders MoM (Excl. Defense) (Sept)

A:--

F: --

P: --

U.S. EIA Weekly Natural Gas Stocks Change

A:--

F: --

P: --

Saudi Arabia Crude Oil Production

A:--

F: --

P: --

U.S. Weekly Treasuries Held by Foreign Central Banks

A:--

F: --

P: --

Japan Foreign Exchange Reserves (Nov)

A:--

F: --

P: --

India Repo Rate

A:--

F: --

P: --

India Benchmark Interest Rate

A:--

F: --

P: --

India Reverse Repo Rate

A:--

F: --

P: --

India Cash Reserve Ratio

A:--

F: --

P: --

Japan Leading Indicators Prelim (Oct)

A:--

F: --

P: --

U.K. Halifax House Price Index YoY (SA) (Nov)

A:--

F: --

P: --

U.K. Halifax House Price Index MoM (SA) (Nov)

A:--

F: --

P: --

France Current Account (Not SA) (Oct)

--

F: --

P: --

France Trade Balance (SA) (Oct)

--

F: --

P: --

France Industrial Output MoM (SA) (Oct)

--

F: --

P: --

Italy Retail Sales MoM (SA) (Oct)

--

F: --

P: --

Euro Zone Employment YoY (SA) (Q3)

--

F: --

P: --

Euro Zone GDP Final YoY (Q3)

--

F: --

P: --

Euro Zone GDP Final QoQ (Q3)

--

F: --

P: --

Euro Zone Employment Final QoQ (SA) (Q3)

--

F: --

P: --

Euro Zone Employment Final (SA) (Q3)

--

F: --

P: --
Brazil PPI MoM (Oct)

--

F: --

P: --

Mexico Consumer Confidence Index (Nov)

--

F: --

P: --

Canada Unemployment Rate (SA) (Nov)

--

F: --

P: --

Canada Labor Force Participation Rate (SA) (Nov)

--

F: --

P: --

Canada Employment (SA) (Nov)

--

F: --

P: --

Canada Part-Time Employment (SA) (Nov)

--

F: --

P: --

Canada Full-time Employment (SA) (Nov)

--

F: --

P: --

U.S. Personal Income MoM (Sept)

--

F: --

P: --

U.S. Dallas Fed PCE Price Index YoY (Sept)

--

F: --

P: --

U.S. PCE Price Index YoY (SA) (Sept)

--

F: --

P: --

U.S. PCE Price Index MoM (Sept)

--

F: --

P: --

U.S. Personal Outlays MoM (SA) (Sept)

--

F: --

P: --

U.S. Core PCE Price Index MoM (Sept)

--

F: --

P: --

U.S. UMich 5-Year-Ahead Inflation Expectations Prelim YoY (Dec)

--

F: --

P: --

U.S. Core PCE Price Index YoY (Sept)

--

F: --

P: --

U.S. Real Personal Consumption Expenditures MoM (Sept)

--

F: --

P: --

U.S. 5-10 Year-Ahead Inflation Expectations (Dec)

--

F: --

P: --

U.S. UMich Current Economic Conditions Index Prelim (Dec)

--

F: --

P: --

U.S. UMich Consumer Sentiment Index Prelim (Dec)

--

F: --

P: --

U.S. UMich 1-Year-Ahead Inflation Expectations Prelim (Dec)

--

F: --

P: --

U.S. UMich Consumer Expectations Index Prelim (Dec)

--

F: --

P: --

Q&A with Experts
    • All
    • Chatrooms
    • Groups
    • Friends
    Connecting
    .
    .
    .
    Type here...
    Add Symbol or Code

      No matching data

      All
      Trump Updates
      Recommend
      Stocks
      Cryptocurrencies
      Central Banks
      Featured News
      • All
      • Russia-Ukraine Conflict
      • Middle East Flashpoint
      • All
      • Russia-Ukraine Conflict
      • Middle East Flashpoint
      Search
      Products

      Charts Free Forever

      Chats Q&A with Experts
      Screeners Economic Calendar Data Tools
      Membership Features
      Data Warehouse Market Trends Institutional Data Policy Rates Macro

      Market Trends

      Market Sentiment Order Book Forex Correlations

      Top Indicators

      Charts Free Forever
      Markets

      News

      News Analysis 24/7 Columns Education
      From Institutions From Analysts
      Topics Columnists

      Latest Views

      Latest Views

      Trending Topics

      Top Columnists

      Latest Update

      Signals

      Copy Rankings Latest Signals Become a signal provider AI Rating
      Contests
      Brokers

      Overview Brokers Assessment Rankings Regulators News Claims
      Broker listing Forex Brokers Comparison Tool Live Spread Comparison Scam
      Q&A Complaint Scam Alert Videos Tips to Detect Scam
      More

      Business
      Events
      Careers About Us Advertising Help Center

      White Label

      Data API

      Web Plug-ins

      Affiliate Program

      Awards Institution Evaluation IB Seminar Salon Event Exhibition
      Vietnam Thailand Singapore Dubai
      Fans Party Investment Sharing Session
      FastBull Summit BrokersView Expo
      Recent Searches
        Top Searches
          Markets
          News
          Analysis
          User
          24/7
          Economic Calendar
          Education
          Data
          • Names
          • Latest
          • Prev

          View All

          No data

          Scan to Download

          Faster Charts, Chat Faster!

          Download App
          English
          • English
          • Español
          • العربية
          • Bahasa Indonesia
          • Bahasa Melayu
          • Tiếng Việt
          • ภาษาไทย
          • Français
          • Italiano
          • Türkçe
          • Русский язык
          • 简中
          • 繁中
          Open Account
          Search
          Products
          Charts Free Forever
          Markets
          News
          Signals

          Copy Rankings Latest Signals Become a signal provider AI Rating
          Contests
          Brokers

          Overview Brokers Assessment Rankings Regulators News Claims
          Broker listing Forex Brokers Comparison Tool Live Spread Comparison Scam
          Q&A Complaint Scam Alert Videos Tips to Detect Scam
          More

          Business
          Events
          Careers About Us Advertising Help Center

          White Label

          Data API

          Web Plug-ins

          Affiliate Program

          Awards Institution Evaluation IB Seminar Salon Event Exhibition
          Vietnam Thailand Singapore Dubai
          Fans Party Investment Sharing Session
          FastBull Summit BrokersView Expo

          The USD Teeters At The Brink Ahead Of August CPI

          SAXO

          Forex

          Economic

          Summary:

          The US dollar trades at its weakest levels since late July ahead of Thursday’s CPI data. US treasury yields have already done some heavy lifting for USD bears, but apparently more needed to take the greenback to new cycle lows.

          US dollar at the brink – but shouldn’t it already be lower still?The US dollar has weakened since last Thursday, with Friday’s weak August US jobs report sparking most of the move, as expectations for a 25-basis point cut at next week’s FOMC meeting firmed up and the odds of a 50-basis point cut, if still low, are rising. Thursday’s US August CPI print is the next event risk of note ahead of the FOMC meeting next Wednesday. The combination of lower treasury yields all along the US yield curve and at least stable risk sentiment should be the sweet spot for a weaker US dollar. But the recent focus on the very long end of global yield curves and whether further stress would prompt a policy response – seen needed first in Japan and the UK and even in France, has likely kept some residual safe haven bid in the US dollar that is offsetting much of the negative pressure on the currency. That’s a working theory, at least. For now, while the US bears are in control and the US dollar looks on the technical brink, visibility is poor unless we get a significant bid into global long bonds outside of the US – a bit more color on USDJPY in the look at the chart below.

          The French Prime Minister Bayrou lost yesterday’s confidence vote in the National Assembly by a resounding margin, as widely expected, and President Macron looks set to appoint the fifth prime minister in two years, as he is seemingly running short of appropriate candidates for the unthankful position. Germany-France 10-year yield spreads have blown wider in early trading today to absorb the news, but are only a few basis points beyond the recent highs, currently at 82 basis points as of this writing, only about a single basis point higher than the highest daily close of the cycle from late August. France’s debt mountain remains a structural issue, but does it fade to a slow burn rather than sparking any imminent further uncertainty?

          Chart: USDJPYTraditionally, the recent collapse in US 10-year yields would have driven a sharp sell-off in USDJPY, but the recent stress in bond yields at the longest end of the Japanese yield curve (the benchmark 30-year JGB hit all-time highs within the last week and is still only a few basis points below those highs, contrasting with the benchmark US 30-year yield, which has tumbled over 30 basis points from recent highs in the last few trading sessions). That tension of the divergence in well tamed US yields versus Japan’s long yields still suggesting uncomfortable pressure on the longest JGBs (in part also on political turmoil in Japan as the PM is resigning and the opposition is clamoring for more welfare spending) keeps the “normal” signals of lower US yields from driving the USD lower here. Technically, we are none the wiser here in either direction until we close south of perhaps 146.20 or above 149.15.
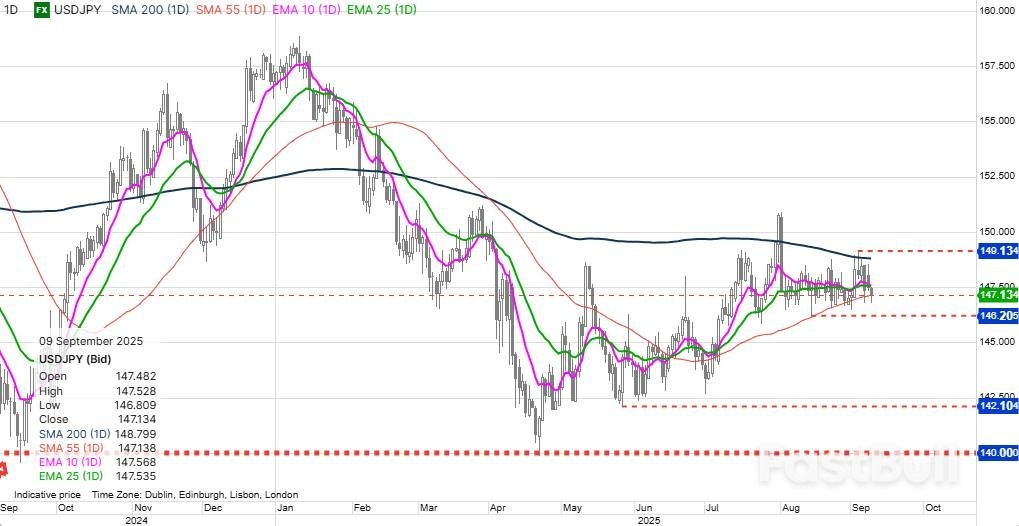
          Source: Saxo

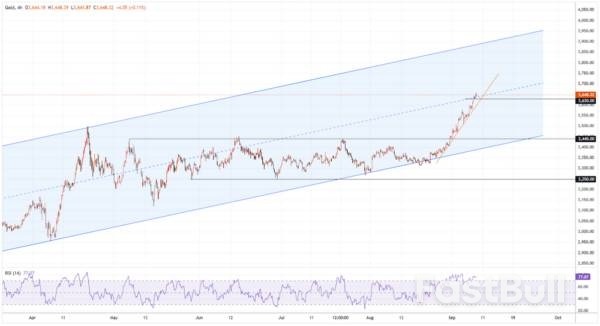
          Looking aheadAgain, we have the US August CPI data up tomorrow, with a benign figure likely to raise expectations for a 50-basis point rate cut next week from the FOMC. The technical situation for the US dollar looks pivotal here and possibly ready for a breakdown, with the only reservation that we have already seen so much that could have already driven the US dollar weaker still. AUDUSD is one of the closest USD pairs to a breakout – trading as high as 0.6615 today versus the high for the year at 0.6625 from back in July.

          FX Board of G10 and CNH trend evolution and strength.Note: If unfamiliar with the FX board, please see a video tutorial for understanding and using the FX Board.

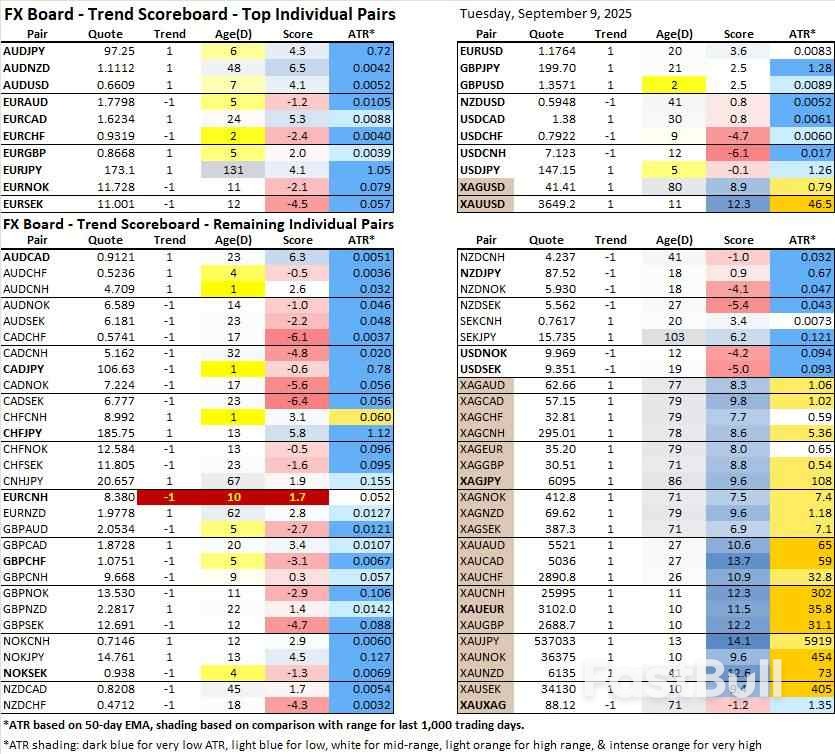
          Both the US dollar and Japanese yen are weak if for different reasons – the US on collapsing yieds and anticipation of Fed cutting, the yen on concern that the bond market is destabilizing and political uncertainty. CAD is in a world of hurt as it follows the US dollar lower on an economy nosediving, in part on tariff-driven woes. On the positive side, the Swedish krona sticks out, possibly on its pristine balance sheet, something that the Swiss can also relate to, while gold and silver are blistering hot with incredibly strong bull trend readings.

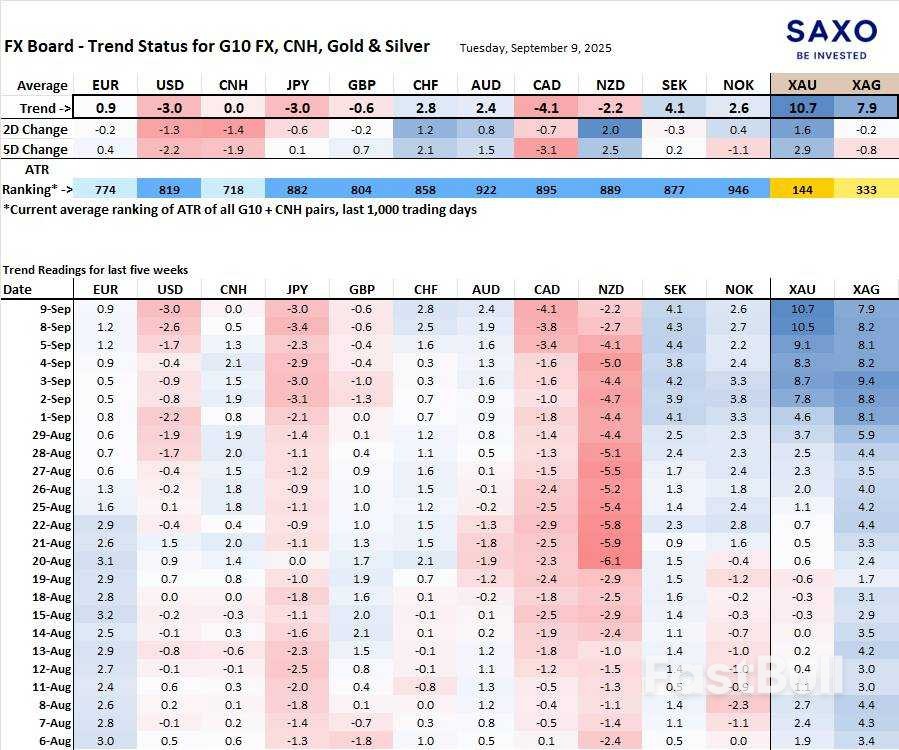
          Table: NEW FX Board Trend Scoreboard for individual pairs.Fresh USD bearish trend signals in recent days in GBPUSD and humorously enough in USDJPY (the trend signal is useless when currency pairs are caught in a trading range as the moving averages meander back in forth within the range). Note the French concerns have also weighed on the euro in some crosses like EURAUD and EURGBP of late.

          Source: SAXO

          To stay updated on all economic events of today, please check out our Economic calendar
          Risk Warnings and Disclaimers
          You understand and acknowledge that there is a high degree of risk involved in trading. Following any strategies or investment methods may lead to potential losses. The content on the site is provided by our contributors and analysts for information purposes only. You are solely responsible for determining whether any trading assets, securities, strategy, or any other product is suitable for investing based on your own investment objectives and financial situation.
          Add to Favorites
          Share

          India and EU Push for Trade Deal Amidst Sticking Points and Global Tensions

          Gerik

          Economic

          Negotiations Under Pressure for Year-End Deadline

          India and the European Union are working to resolve outstanding issues in their trade talks, with the goal of finalizing a deal by the end of 2025. The negotiations, which have gained momentum since being relaunched in 2022, are critical for both sides. India, seeking to deepen global partnerships, faces increased pressure after U.S. President Donald Trump imposed high tariffs on Indian goods, particularly textiles, leather, and chemicals, over India’s Russian oil purchases.
          The EU, likewise, has been accelerating its trade talks, having recently finalized agreements with Mexico and the South American Mercosur countries, and now focusing on securing a pact with India. This agreement could not only strengthen India’s ties with Europe but also balance its geopolitical positioning, especially after concerns over Prime Minister Modi’s recent visit to China, where he met with Russian President Vladimir Putin.

          Key Issues in the Negotiations

          Although 11 of the 23 chapters in the negotiations have been finalized, significant sticking points remain. India has firmly rejected concessions on agriculture and dairy, citing the protection of farmers' livelihoods. On the other hand, the EU seeks greater market access for its automobile and alcoholic beverage industries. Additionally, differences persist on rules of origin, food safety standards, labor, and environmental obligations, as well as what the EU views as non-tariff barriers posed by India’s restrictive quality control measures.
          Another major issue is India’s stance on discounted Russian oil purchases, which EU officials claim undermine sanctions against Moscow. While this issue may not dominate the discussions, it could still cause tension within the European Parliament, potentially delaying the approval of any trade agreement.

          Carbon Border Tax and Trade Barriers

          One of the most contentious issues in the negotiations is the EU’s proposed carbon border tax, which would target carbon-intensive imports such as steel and aluminum from 2026. Indian officials have called it a disguised trade barrier, while the EU argues that it is essential for its climate policy. The EU is reportedly willing to offer some flexibility on the implementation of the tax to address the concerns of small and medium-sized businesses in India.
          The ongoing trade talks between India and the EU are crucial for both economies, with the outcome impacting India’s global trade relations and its political positioning in the face of shifting alliances. While significant progress has been made, unresolved issues like agricultural access, oil purchases, and climate policies still threaten to derail the deal. As both sides continue to push for an agreement by the year-end deadline, the resolution of these issues will be key in determining the future of their economic relationship.
          To stay updated on all economic events of today, please check out our Economic calendar
          Risk Warnings and Disclaimers
          You understand and acknowledge that there is a high degree of risk involved in trading. Following any strategies or investment methods may lead to potential losses. The content on the site is provided by our contributors and analysts for information purposes only. You are solely responsible for determining whether any trading assets, securities, strategy, or any other product is suitable for investing based on your own investment objectives and financial situation.
          Add to Favorites
          Share

          The Jobs Slump Is Here: What It Means for The Stock Market And The Fed

          Michelle

          Economic

          Stocks

          Several months ago, stocks briefly crashed over concerns about a trade war and a slowing economy. Now, the S&P 500 (^GSPC 0.21%) is trading at an all-time high even as recent economic data makes it clear the labor market is grinding to a halt.

          Friday's employment report showed the U.S. added just 22,000 jobs in August, missing expectations of 75,000 net new jobs. The report continued a recent streak of weak jobs growth and included a downward revision of 27,000 jobs over the prior two months. The economy lost 13,000 jobs in June and gained 79,000 in July, meaning that job growth has averaged less than 30,000 over the last four months, significantly less than what's considered a healthy job market (at least 100,000 job gains per month).

          Image source: Getty Images.

          What it means for investors

          For investors, the jobs report is important not just because it's a major indicator of the health of the overall economy, but also because it impacts the Federal Reserve's interest rate decisions. The Federal Reserve has a dual mandate to keep both unemployment and inflation low, generally targeting a 2% inflation rate, and a weak jobs report makes it more likely that the Fed will cut rates at its next meeting on Sept. 16-17. The central bank tends to cut rates when the economy is weak in order to stimulate growth, and raise rates when the economy is overheated and inflation is too high, in order to control the economic cycle.

          With job growth looking sluggish for the fourth straight month, the Fed is more likely to cut rates at the September meeting than it was before the update, and lower rates tend to be good for stocks. They make it easier for businesses to borrow and invest, and they make stocks more attractive versus bonds, so investment capital tends to rotate from bonds into stocks in low-rate environments. Low rates are especially beneficial to growth stocks because they lower the discount rate in discounted cash-flow valuations, meaning earnings in the distant future are worth more than they previously were.

          However, investors didn't quite know what to make of the jobs report on Friday as stock futures initially popped on the news due to the increased chances for an interest rate cut, but then gave back those gains in the regular trading session, and all three major indexes finished in the red with the S&P 500 down 0.5% in afternoon trading. The small-cap Russell 2000 index, which is more sensitive to interest rates due to the volatile nature of small-cap stocks, was trading higher for part of the session.

          Friday's movement is a reminder that rate cuts alone aren't enough to drive stocks higher, especially if the cause is job losses and an increased potential for recession.

          Winners and losers

          While the S&P 500 was down on the move, individual stocks don't move in lockstep with the broad-market index, and some sectors figure to be winners from a rate cut, especially those most sensitive to interest rates.

          That includes homebuilders and other stocks directly tied to the housing market. The SPDR S&P Homebuilders ETF (XHB 0.18%), for example, was up 1.6% Friday afternoon, and Opendoor Technologies (OPEN -9.17%), the home-flipper that has surged lately on interest from meme stock investors as well as hopes for rate cuts, traded up by double-digit percentages.

          Among the losers on Friday were cyclical sectors with the most exposure to a recession, like energy, which was down 2.4% in afternoon trading, and financials, which was off 2.1%.

          Image source: Getty Images.

          What the jobs report means for the Fed

          There's only one more major economic release that's likely to influence the Fed's September decision. That's the August Consumer Price Index (CPI) report, which is due out Sept. 11.

          Inflation has been creeping higher, and an uptick could make the Fed's decision more difficult, but a rate cut seems more likely than not at this point, especially after Fed Chair Powell alluded to one in his closely watched Jackson Hole speech in mid-August. In fact, there's a chance the Fed could cut rates by 50 basis points, rather than the standard 25 bps, especially if signs of trouble in the labor market increase and the CPI report shows cooler inflation than expected.

          Source: The Motley Fool

          To stay updated on all economic events of today, please check out our Economic calendar
          Risk Warnings and Disclaimers
          You understand and acknowledge that there is a high degree of risk involved in trading. Following any strategies or investment methods may lead to potential losses. The content on the site is provided by our contributors and analysts for information purposes only. You are solely responsible for determining whether any trading assets, securities, strategy, or any other product is suitable for investing based on your own investment objectives and financial situation.
          Add to Favorites
          Share

          South Korea's Toss Expands Globally, Eyes Won-Based Stablecoin

          Gerik

          Economic

          Toss Ventures Beyond South Korea with Global Expansion Plans

          Toss, South Korea's leading fintech unicorn, is preparing for an international expansion, starting with its launch in Australia later this year. Founder and CEO Lee Seung-gun highlighted Toss's success in competing with established players in South Korea's financial sector and aims to replicate this success internationally. Toss has already attracted over 30 million users in South Korea since its founding in 2015, and Lee believes the startup’s model will thrive in international markets where fragmented banking systems and open banking rules create opportunities for a seamless all-in-one financial app.
          The initial focus will be on Australia, where Toss plans to offer core services such as peer-to-peer money transfers by the end of 2025. The company is also evaluating other markets, with Singapore serving as a regional hub. Toss’s long-term vision is to become a global internet company centered on financial services rather than a traditional financial holding company.

          Fintech Unicorn Eyes $10 Billion IPO in the U.S.

          Toss is preparing for an ambitious IPO, with plans to list on the U.S. stock market in the second quarter of 2026, aiming for a valuation of over $10 billion. Some industry experts suggest the valuation could exceed $15 billion, making it the largest IPO by a South Korean company in the U.S. since 2021. Toss’s success has attracted interest from global funds, with many viewing it as one of the few fintechs to successfully execute the “super app” concept, combining a wide range of financial services into a single platform.
          In addition to its international expansion, Toss is preparing to issue a won-based stablecoin once South Korea’s financial regulator finalizes the legal framework for stablecoins. Lee emphasized that Toss is already in discussions with authorities to ensure the necessary infrastructure is in place. The move aligns with South Korea's plans to introduce legislation enabling companies to issue stablecoins, a digital currency tied to assets like gold or the Korean won. Lee is confident that Toss will play a key role in creating a digitally native form of the won, allowing the company to further innovate in the country’s financial landscape.
          Toss’s expansion into global markets and its ambitious plans for a won-based stablecoin reflect its drive to reshape the financial services industry. With a proven track record in South Korea and strategic moves to enter international markets, Toss aims to establish itself as a key player in the global fintech space. The company’s continued focus on innovation, regulatory compliance, and user-centric services positions it well for future success as it looks to disrupt traditional financial systems worldwide.

          Source: Reuters

          To stay updated on all economic events of today, please check out our Economic calendar
          Risk Warnings and Disclaimers
          You understand and acknowledge that there is a high degree of risk involved in trading. Following any strategies or investment methods may lead to potential losses. The content on the site is provided by our contributors and analysts for information purposes only. You are solely responsible for determining whether any trading assets, securities, strategy, or any other product is suitable for investing based on your own investment objectives and financial situation.
          Add to Favorites
          Share

          Vietnam’s Exports to the U.S. and Imports from China Drop in August Amid Tariff Impact

          Gerik

          Economic

          Impact of U.S. Tariffs on Vietnam's Trade

          Vietnam's exports to the U.S. fell by 2% in August compared to July, totaling $13.94 billion. The decline came as the U.S. imposed a 20% tariff on Vietnamese shipments, starting August 7, part of broader efforts to counteract perceived trade imbalances. While exports to the U.S. increased by 18.33% compared to August 2024, the monthly drop highlights the immediate impact of the tariff. For the first eight months of 2025, Vietnam’s exports to the U.S. rose by 26.4%, reaching $99.05 billion. However, with tariffs now in place, trade growth is expected to moderate.
          Imports from China also fell by 2% in August, continuing a trend of reliance on Chinese materials and equipment for Vietnam's manufacturing industries. For the first eight months of 2025, imports from China surged by 27%, totaling $117.93 billion. This shows the significant role that China continues to play in Vietnam’s supply chains, especially as raw materials and industrial components come primarily from China to fuel Vietnam’s export-driven manufacturing.
          Vietnam remains under scrutiny for its role as a potential transshipment hub for Chinese goods, which has drawn criticism from the U.S. The U.S. has accused Vietnam of facilitating the movement of Chinese products through its borders to avoid tariffs, a concern that could impact future trade dynamics.

          Economic Forecasts Show Slowing Growth

          Oxford Economics has warned that Vietnam’s export growth will likely continue to ease due to the tariff impact, while the World Bank revised its GDP growth forecast for 2025 down to 6.6%, from 6.8%. The adjustment reflects concerns that the country's export-driven economy is moderating, as the impact of U.S. tariffs and the ongoing trade tensions weigh on trade growth.
          The Vietnamese government had initially targeted GDP growth of 8.3% to 8.5% for the year, with Prime Minister Pham Minh Chinh acknowledging that this goal would be difficult to reach. Despite the challenging environment, the government remains focused on achieving this target, even in the face of these obstacles.
          Vietnam's trade with the U.S. and China is being impacted by external economic factors, particularly the new U.S. tariffs, which are slowing the growth of exports. With Vietnam continuing to rely heavily on Chinese imports for its manufacturing sector, and with global economic conditions presenting challenges, the country faces a difficult path to meeting its ambitious growth targets for 2025. The ongoing tariff battles and shifting trade dynamics will continue to shape Vietnam’s economic performance in the coming months.

          Source: Reuters

          To stay updated on all economic events of today, please check out our Economic calendar
          Risk Warnings and Disclaimers
          You understand and acknowledge that there is a high degree of risk involved in trading. Following any strategies or investment methods may lead to potential losses. The content on the site is provided by our contributors and analysts for information purposes only. You are solely responsible for determining whether any trading assets, securities, strategy, or any other product is suitable for investing based on your own investment objectives and financial situation.
          Add to Favorites
          Share

          US-South Korea Deadlock Over $350 Billion Investment Fund Threatens Trade Deal

          Gerik

          Economic

          Investment Fund Dispute Puts Trade Deal in Jeopardy

          The $350 billion investment fund, a central component of the trade deal designed to maintain a 15% tariff on South Korean imports, is at the heart of the deadlock between the two nations. South Korea's presidential office, represented by Kim Yong-beom, has expressed concerns about accepting terms similar to Japan's $550 billion pledge. Kim emphasized that the size and structure of the two economies are fundamentally different, particularly in relation to the foreign exchange market and currency dynamics.
          The disagreement stems from the need to secure and manage such a substantial sum from the foreign exchange market, with South Korea focusing on how to avoid market instability. While the fund's investment decisions and profit-sharing arrangements are key, South Korea's immediate concern is the potential strain on its financial systems.

          Key Differences Between South Korea and Japan’s Terms

          The US had presented South Korea with a draft similar to Japan’s, but the terms are unacceptable to Seoul. One of the main issues is the disparity in economic conditions between the two nations. Japan’s involvement is underpinned by its currency swap arrangements and the yen's status as a reserve currency, which offers Japan different financial flexibility than South Korea.
          Kim’s statements underscore the critical nature of finding a workable structure for the $350 billion fund, especially considering South Korea's concerns over the impact on its currency and economy. He noted that without agreement, the Make American Shipbuilding Great Again (MASGA) initiative a key part of the trade deal aimed at boosting US shipbuilding would be at risk of failure.

          Broader Tensions and Investment Concerns

          The deadlock over the investment fund is compounded by other tensions between the two countries. Recently, the US immigration raid on a Hyundai Motor and LG Energy Solution plant in Georgia, which detained hundreds of South Koreans, has led to concerns that South Korean companies may hesitate to invest further in the US, despite being encouraged to do so under the trade agreement.
          South Korea's reluctance to accept the $350 billion investment fund as initially proposed reflects a broader apprehension about the potential economic shock, especially as the automotive sector, a major point of contention, is involved in the trade deal. South Korean officials argue that the focus should not solely be on securing tariff reductions but also on maintaining economic stability.
          The future of the $350 billion investment fund and its implications for the broader trade deal remain in limbo as South Korea seeks more favorable terms. The deadlock underscores the challenges of aligning the interests of two economies with differing financial conditions and priorities. With the MASGA project and other initiatives hanging in the balance, the resolution of these issues will be critical for the future of US-South Korea trade relations.

          Source: Bloomberg

          To stay updated on all economic events of today, please check out our Economic calendar
          Risk Warnings and Disclaimers
          You understand and acknowledge that there is a high degree of risk involved in trading. Following any strategies or investment methods may lead to potential losses. The content on the site is provided by our contributors and analysts for information purposes only. You are solely responsible for determining whether any trading assets, securities, strategy, or any other product is suitable for investing based on your own investment objectives and financial situation.
          Add to Favorites
          Share

          XAU/USD Analysis: 3 Reasons Why Gold’s Rally Might Pause

          Golden Gleam

          Commodity

          Technical Analysis

          Today’s XAU/USD chart shows that gold continues to set records in September. The price has risen above $3,650 per ounce for the first time in history – one of the main drivers being expectations of a Federal Reserve rate cut on Wednesday, 17 September.

          Easier monetary policy is generally seen as boosting gold’s appeal – this has pushed XAU/USD nearly 6% higher since the start of September. However, the chart highlights three reasons why further upside may be limited.

          Technical Analysis of the XAU/USD Chart

          1. Long-term channel:

          Over the course of 2025, gold price movements have formed an ascending channel (shown in blue), and today XAU/USD is trading close to its median line. This is where supply and demand typically balance out. Buyers may consider the post-September rally overstretched, while sellers could view the all-time high as an opportunity to take profits.

          2. Rectangle pattern target reached:

          The range between $3,250 and $3,440 that developed mid-year can be interpreted as a rectangle pattern. Following the bullish breakout, the implied target of $3,630 has already been achieved.

          3. RSI signals risk:

          The RSI indicator is close to forming a bearish divergence.

          Given the steep angle of the orange support line, a correction – for example, towards the psychological level of $3,550 – might occur.

          In summary, gold’s upward momentum may start to slow. At the same time, given the market’s inertia, traders may have little reason to expect a decisive shift away from bullish dominance. Still, next Wednesday could bring surprises.

          Source: ACTIONFOREX

          Risk Warnings and Disclaimers
          You understand and acknowledge that there is a high degree of risk involved in trading. Following any strategies or investment methods may lead to potential losses. The content on the site is provided by our contributors and analysts for information purposes only. You are solely responsible for determining whether any trading assets, securities, strategy, or any other product is suitable for investing based on your own investment objectives and financial situation.
          Add to Favorites
          Share
          FastBull
          Copyright © 2025 FastBull Ltd

          728 RM B 7/F GEE LOK IND BLDG NO 34 HUNG TO RD KWUN TONG KLN HONG KONG

          TelegramInstagramTwitterfacebooklinkedin
          App Store Google Play Google Play
          Products
          Charts

          Chats

          Q&A with Experts
          Screeners
          Economic Calendar
          Data
          Tools
          Membership
          Features
          Function
          Markets
          Copy Trading
          Latest Signals
          Contests
          News
          Analysis
          24/7
          Columns
          Education
          Company
          Careers
          About Us
          Contact Us
          Advertising
          Help Center
          Feedback
          User Agreement
          Privacy Policy
          Business

          White Label

          Data API

          Web Plug-ins

          Poster Maker

          Affiliate Program

          Risk Disclosure

          The risk of loss in trading financial instruments such as stocks, FX, commodities, futures, bonds, ETFs and crypto can be substantial. You may sustain a total loss of the funds that you deposit with your broker. Therefore, you should carefully consider whether such trading is suitable for you in light of your circumstances and financial resources.

          No decision to invest should be made without thoroughly conducting due diligence by yourself or consulting with your financial advisors. Our web content might not suit you since we don't know your financial conditions and investment needs. Our financial information might have latency or contain inaccuracy, so you should be fully responsible for any of your trading and investment decisions. The company will not be responsible for your capital loss.

          Without getting permission from the website, you are not allowed to copy the website's graphics, texts, or trademarks. Intellectual property rights in the content or data incorporated into this website belong to its providers and exchange merchants.

          Not Logged In

          Log in to access more features

          FastBull Membership

          Not yet

          Purchase

          Become a signal provider
          Help Center
          Customer Service
          Dark Mode
          Price Up/Down Colors

          Log In

          Sign Up

          Position
          Layout
          Fullscreen
          Default to Chart
          The chart page opens by default when you visit fastbull.com