Markets
News
Analysis
User
24/7
Economic Calendar
Education
Data
- Names
- Latest
- Prev


Job growth has been somewhat anemic for the past several months and worsened in August. Here's how it could affect markets.
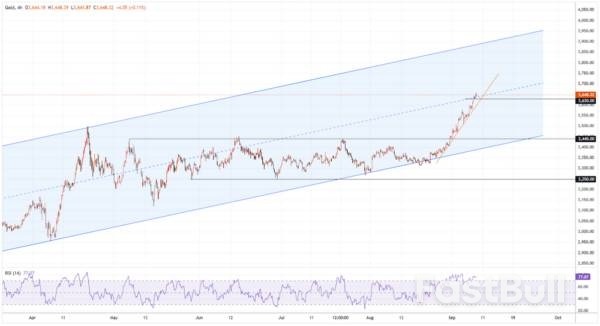
Several months ago, stocks briefly crashed over concerns about a trade war and a slowing economy. Now, the S&P 500 (^GSPC 0.21%) is trading at an all-time high even as recent economic data makes it clear the labor market is grinding to a halt.
Friday's employment report showed the U.S. added just 22,000 jobs in August, missing expectations of 75,000 net new jobs. The report continued a recent streak of weak jobs growth and included a downward revision of 27,000 jobs over the prior two months. The economy lost 13,000 jobs in June and gained 79,000 in July, meaning that job growth has averaged less than 30,000 over the last four months, significantly less than what's considered a healthy job market (at least 100,000 job gains per month).
For investors, the jobs report is important not just because it's a major indicator of the health of the overall economy, but also because it impacts the Federal Reserve's interest rate decisions. The Federal Reserve has a dual mandate to keep both unemployment and inflation low, generally targeting a 2% inflation rate, and a weak jobs report makes it more likely that the Fed will cut rates at its next meeting on Sept. 16-17. The central bank tends to cut rates when the economy is weak in order to stimulate growth, and raise rates when the economy is overheated and inflation is too high, in order to control the economic cycle.
With job growth looking sluggish for the fourth straight month, the Fed is more likely to cut rates at the September meeting than it was before the update, and lower rates tend to be good for stocks. They make it easier for businesses to borrow and invest, and they make stocks more attractive versus bonds, so investment capital tends to rotate from bonds into stocks in low-rate environments. Low rates are especially beneficial to growth stocks because they lower the discount rate in discounted cash-flow valuations, meaning earnings in the distant future are worth more than they previously were.
However, investors didn't quite know what to make of the jobs report on Friday as stock futures initially popped on the news due to the increased chances for an interest rate cut, but then gave back those gains in the regular trading session, and all three major indexes finished in the red with the S&P 500 down 0.5% in afternoon trading. The small-cap Russell 2000 index, which is more sensitive to interest rates due to the volatile nature of small-cap stocks, was trading higher for part of the session.
Friday's movement is a reminder that rate cuts alone aren't enough to drive stocks higher, especially if the cause is job losses and an increased potential for recession.
While the S&P 500 was down on the move, individual stocks don't move in lockstep with the broad-market index, and some sectors figure to be winners from a rate cut, especially those most sensitive to interest rates.
That includes homebuilders and other stocks directly tied to the housing market. The SPDR S&P Homebuilders ETF (XHB 0.18%), for example, was up 1.6% Friday afternoon, and Opendoor Technologies (OPEN -9.17%), the home-flipper that has surged lately on interest from meme stock investors as well as hopes for rate cuts, traded up by double-digit percentages.
Among the losers on Friday were cyclical sectors with the most exposure to a recession, like energy, which was down 2.4% in afternoon trading, and financials, which was off 2.1%.
There's only one more major economic release that's likely to influence the Fed's September decision. That's the August Consumer Price Index (CPI) report, which is due out Sept. 11.
Inflation has been creeping higher, and an uptick could make the Fed's decision more difficult, but a rate cut seems more likely than not at this point, especially after Fed Chair Powell alluded to one in his closely watched Jackson Hole speech in mid-August. In fact, there's a chance the Fed could cut rates by 50 basis points, rather than the standard 25 bps, especially if signs of trouble in the labor market increase and the CPI report shows cooler inflation than expected.
728 RM B 7/F GEE LOK IND BLDG NO 34 HUNG TO RD KWUN TONG KLN HONG KONG


The risk of loss in trading financial instruments such as stocks, FX, commodities, futures, bonds, ETFs and crypto can be substantial. You may sustain a total loss of the funds that you deposit with your broker. Therefore, you should carefully consider whether such trading is suitable for you in light of your circumstances and financial resources.
No decision to invest should be made without thoroughly conducting due diligence by yourself or consulting with your financial advisors. Our web content might not suit you since we don't know your financial conditions and investment needs. Our financial information might have latency or contain inaccuracy, so you should be fully responsible for any of your trading and investment decisions. The company will not be responsible for your capital loss.
Without getting permission from the website, you are not allowed to copy the website's graphics, texts, or trademarks. Intellectual property rights in the content or data incorporated into this website belong to its providers and exchange merchants.
Not Logged In
Log in to access more features

FastBull Membership
Not yet
Purchase


Log In
Sign Up