• Trade
  • Markets
  • Copy
  • Contests
  • News
  • 24/7
  • Calendar
  • Q&A
  • Chats
Trending
Screeners
SYMBOL
LAST
BID
ASK
HIGH
LOW
NET CHG.
%CHG.
SPREAD
SPX
S&P 500 Index
6845.26
6845.26
6845.26
6878.28
6841.15
-25.14
-0.37%
--
DJI
Dow Jones Industrial Average
47771.52
47771.52
47771.52
47971.51
47709.38
-183.46
-0.38%
--
IXIC
NASDAQ Composite Index
23526.30
23526.30
23526.30
23698.93
23505.52
-51.82
-0.22%
--
USDX
US Dollar Index
99.110
99.190
99.110
99.160
98.730
+0.160
+ 0.16%
--
EURUSD
Euro / US Dollar
1.16242
1.16250
1.16242
1.16717
1.16162
-0.00184
-0.16%
--
GBPUSD
Pound Sterling / US Dollar
1.33180
1.33189
1.33180
1.33462
1.33053
-0.00132
-0.10%
--
XAUUSD
Gold / US Dollar
4190.92
4191.33
4190.92
4218.85
4175.92
-6.99
-0.17%
--
WTI
Light Sweet Crude Oil
59.054
59.084
59.054
60.084
58.837
-0.755
-1.26%
--

Community Accounts

Signal Accounts
--
Profit Accounts
--
Loss Accounts
--
View More

Become a signal provider

Sell trading signals to earn additional income

View More

Guide to Copy Trading

Get started with ease and confidence

View More

Signal Accounts for Members

All Signal Accounts

Best Return
  • Best Return
  • Best P/L
  • Best MDD
Past 1W
  • Past 1W
  • Past 1M
  • Past 1Y

All Contests

  • All
  • Trump Updates
  • Recommend
  • Stocks
  • Cryptocurrencies
  • Central Banks
  • Featured News
Top News Only
Share

In The Past 24 Hours, The Marketvector Digital Asset 100 Small Cap Index Rose 1.96%, Currently At 4135.44 Points. The Sydney Market Initially Exhibited An N-shaped Pattern, Hitting A Daily Low Of 3988.39 Points At 06:08 Beijing Time, Before Steadily Rising To A Daily High Of 4206.06 Points At 17:07, Subsequently Stabilizing At This High Level

Share

[Sovereign Bond Yields In France, Italy, Spain, And Greece Rose By More Than 7 Basis Points, Raising Concerns That The ECB's Interest Rate Outlook May Push Up Financing Costs] In Late European Trading On Monday (December 8), The Yield On French 10-year Bonds Rose 5.8 Basis Points To 3.581%. The Yield On Italian 10-year Bonds Rose 7.4 Basis Points To 3.559%. The Yield On Spanish 10-year Bonds Rose 7.0 Basis Points To 3.332%. The Yield On Greek 10-year Bonds Rose 7.1 Basis Points To 3.466%

Share

Oil Falls 1% Amid Ongoing Ukraine Talks, Ahead Of Expected US Interest Rate Cut

Share

Azeri Btc Crude Oil Exports From Ceyhan Port Set At 16.2 Million Barrels In January Versus 17.0 Million In December, Schedule Shows

Share

USA - Greenland Joint Committee Statement: The United States And Greenland Look Forward To Building On Momentum In The Year Ahead And Strengthening Ties That Support A Secure And Prosperous Arctic Region

Share

MSCI Nordic Countries Index Fell 0.4% To 356.64 Points. Among The Ten Sectors, The Nordic Healthcare Sector Saw The Largest Decline. Novo Nordisk, A Heavyweight Stock, Closed Down 3.4%, Leading The Losses Among Nordic Stocks

Share

France's CAC 40 Down 0.2%, Spain's IBEX Up 0.1%

Share

Europe's STOXX Index Up 0.1%, Euro Zone Blue Chips Index Flat

Share

Germany's DAX 30 Index Closed Up 0.08% At 24,044.88 Points. France's Stock Index Closed Down 0.19%, Italy's Stock Index Closed Down 0.13% With Its Banking Index Up 0.33%, And The UK's Stock Index Closed Down 0.32%

Share

The STOXX Europe 600 Index Closed Down 0.12% At 578.06 Points. The Eurozone STOXX 50 Index Closed Down 0.04% At 5721.56 Points. The FTSE Eurotop 300 Index Closed Down 0.05% At 2304.93 Points

Share

Israeli Prime Minister Netanyahu: Hamas Has Violated The Ceasefire Agreement, And We Will Never Allow Its Members To Re-arm Themselves And Threaten US

Share

Israeli Prime Minister Netanyahu: We Are Working To Return The Body Of Another Detainee From The Gaza Strip

Share

Iraq's West Qurna 2 Oil Field Will Increase Oil Production Beyond Normal Levels To Compensate For The Production Stoppage Caused By The Trump Administration's Sanctions Against Russia

Share

Israeli Prime Minister Netanyahu: We Are Close To Completing The First Phase Of Trump’s Plan And Will Now Focus On Disarming Gaza And Seizing Hamas Weapons

Share

Moody's Affirmed Burberry's Long-term Rating Of Baa3 And Revised Its Outlook (from Negative) To Stable

Share

The Trump Administration Supports Iraq's Plan To Transfer Russian Oil Company Lukoil Pjsc's Assets In The West Qurna 2 Oil Field To An American Company

Share

JMA: Tsunami Of 70 Centimetres Observed In Japan's Kuji Port In Iwate Prefecture

Share

The U.S. Bureau Of Labor Statistics Plans To Release A Press Release On January 15, 2026, For November 2025, Along With Data For October

Share

Tiger Global Has Established A New Fund, Aiming To Raise $2 Billion To $3 Billion

Share

The U.S. Bureau Of Labor Statistics Announced That It Will Not Release A Press Release Regarding The U.S. Import And Export Price Index (MXP) For October 2025

TIME
ACT
FCST
PREV
France Trade Balance (SA) (Oct)

A:--

F: --

P: --
Euro Zone Employment YoY (SA) (Q3)

A:--

F: --

P: --
Canada Part-Time Employment (SA) (Nov)

A:--

F: --

P: --

Canada Unemployment Rate (SA) (Nov)

A:--

F: --

P: --

Canada Full-time Employment (SA) (Nov)

A:--

F: --

P: --

Canada Labor Force Participation Rate (SA) (Nov)

A:--

F: --

P: --

Canada Employment (SA) (Nov)

A:--

F: --

P: --

U.S. PCE Price Index MoM (Sept)

A:--

F: --

P: --

U.S. Personal Income MoM (Sept)

A:--

F: --

P: --

U.S. Core PCE Price Index MoM (Sept)

A:--

F: --

P: --

U.S. PCE Price Index YoY (SA) (Sept)

A:--

F: --

P: --

U.S. Core PCE Price Index YoY (Sept)

A:--

F: --

P: --

U.S. Personal Outlays MoM (SA) (Sept)

A:--

F: --

P: --
U.S. 5-10 Year-Ahead Inflation Expectations (Dec)

A:--

F: --

P: --

U.S. Real Personal Consumption Expenditures MoM (Sept)

A:--

F: --

P: --
U.S. Weekly Total Rig Count

A:--

F: --

P: --

U.S. Weekly Total Oil Rig Count

A:--

F: --

P: --

U.S. Consumer Credit (SA) (Oct)

A:--

F: --

P: --
China, Mainland Foreign Exchange Reserves (Nov)

A:--

F: --

P: --

Japan Trade Balance (Oct)

A:--

F: --

P: --

Japan Nominal GDP Revised QoQ (Q3)

A:--

F: --

P: --

China, Mainland Imports YoY (CNH) (Nov)

A:--

F: --

P: --

China, Mainland Exports (Nov)

A:--

F: --

P: --

China, Mainland Imports (CNH) (Nov)

A:--

F: --

P: --

China, Mainland Trade Balance (CNH) (Nov)

A:--

F: --

P: --

China, Mainland Exports YoY (USD) (Nov)

A:--

F: --

P: --

China, Mainland Imports YoY (USD) (Nov)

A:--

F: --

P: --

Germany Industrial Output MoM (SA) (Oct)

A:--

F: --

P: --
Euro Zone Sentix Investor Confidence Index (Dec)

A:--

F: --

P: --

Canada National Economic Confidence Index

A:--

F: --

P: --

U.K. BRC Like-For-Like Retail Sales YoY (Nov)

--

F: --

P: --

U.K. BRC Overall Retail Sales YoY (Nov)

--

F: --

P: --

Australia Overnight (Borrowing) Key Rate

--

F: --

P: --

RBA Rate Statement
RBA Press Conference
Germany Exports MoM (SA) (Oct)

--

F: --

P: --

U.S. NFIB Small Business Optimism Index (SA) (Nov)

--

F: --

P: --

Mexico 12-Month Inflation (CPI) (Nov)

--

F: --

P: --

Mexico Core CPI YoY (Nov)

--

F: --

P: --

Mexico PPI YoY (Nov)

--

F: --

P: --

U.S. Weekly Redbook Index YoY

--

F: --

P: --

U.S. JOLTS Job Openings (SA) (Oct)

--

F: --

P: --

China, Mainland M1 Money Supply YoY (Nov)

--

F: --

P: --

China, Mainland M0 Money Supply YoY (Nov)

--

F: --

P: --

China, Mainland M2 Money Supply YoY (Nov)

--

F: --

P: --

U.S. EIA Short-Term Crude Production Forecast For The Year (Dec)

--

F: --

P: --

U.S. EIA Natural Gas Production Forecast For The Next Year (Dec)

--

F: --

P: --

U.S. EIA Short-Term Crude Production Forecast For The Next Year (Dec)

--

F: --

P: --

EIA Monthly Short-Term Energy Outlook
U.S. API Weekly Gasoline Stocks

--

F: --

P: --

U.S. API Weekly Cushing Crude Oil Stocks

--

F: --

P: --

U.S. API Weekly Crude Oil Stocks

--

F: --

P: --

U.S. API Weekly Refined Oil Stocks

--

F: --

P: --

South Korea Unemployment Rate (SA) (Nov)

--

F: --

P: --

Japan Reuters Tankan Non-Manufacturers Index (Dec)

--

F: --

P: --

Japan Reuters Tankan Manufacturers Index (Dec)

--

F: --

P: --

Japan Domestic Enterprise Commodity Price Index MoM (Nov)

--

F: --

P: --

Japan Domestic Enterprise Commodity Price Index YoY (Nov)

--

F: --

P: --

China, Mainland PPI YoY (Nov)

--

F: --

P: --

China, Mainland CPI MoM (Nov)

--

F: --

P: --

Q&A with Experts
    • All
    • Chatrooms
    • Groups
    • Friends
    Connecting
    .
    .
    .
    Type here...
    Add Symbol or Code

      No matching data

      All
      Trump Updates
      Recommend
      Stocks
      Cryptocurrencies
      Central Banks
      Featured News
      • All
      • Russia-Ukraine Conflict
      • Middle East Flashpoint
      • All
      • Russia-Ukraine Conflict
      • Middle East Flashpoint
      Search
      Products

      Charts Free Forever

      Chats Q&A with Experts
      Screeners Economic Calendar Data Tools
      Membership Features
      Data Warehouse Market Trends Institutional Data Policy Rates Macro

      Market Trends

      Market Sentiment Order Book Forex Correlations

      Top Indicators

      Charts Free Forever
      Markets

      News

      News Analysis 24/7 Columns Education
      From Institutions From Analysts
      Topics Columnists

      Latest Views

      Latest Views

      Trending Topics

      Top Columnists

      Latest Update

      Signals

      Copy Rankings Latest Signals Become a signal provider AI Rating
      Contests
      Brokers

      Overview Brokers Assessment Rankings Regulators News Claims
      Broker listing Forex Brokers Comparison Tool Live Spread Comparison Scam
      Q&A Complaint Scam Alert Videos Tips to Detect Scam
      More

      Business
      Events
      Careers About Us Advertising Help Center

      White Label

      Data API

      Web Plug-ins

      Affiliate Program

      Awards Institution Evaluation IB Seminar Salon Event Exhibition
      Vietnam Thailand Singapore Dubai
      Fans Party Investment Sharing Session
      FastBull Summit BrokersView Expo
      Recent Searches
        Top Searches
          Markets
          News
          Analysis
          User
          24/7
          Economic Calendar
          Education
          Data
          • Names
          • Latest
          • Prev

          View All

          No data

          Scan to Download

          Faster Charts, Chat Faster!

          Download App
          English
          • English
          • Español
          • العربية
          • Bahasa Indonesia
          • Bahasa Melayu
          • Tiếng Việt
          • ภาษาไทย
          • Français
          • Italiano
          • Türkçe
          • Русский язык
          • 简中
          • 繁中
          Open Account
          Search
          Products
          Charts Free Forever
          Markets
          News
          Signals

          Copy Rankings Latest Signals Become a signal provider AI Rating
          Contests
          Brokers

          Overview Brokers Assessment Rankings Regulators News Claims
          Broker listing Forex Brokers Comparison Tool Live Spread Comparison Scam
          Q&A Complaint Scam Alert Videos Tips to Detect Scam
          More

          Business
          Events
          Careers About Us Advertising Help Center

          White Label

          Data API

          Web Plug-ins

          Affiliate Program

          Awards Institution Evaluation IB Seminar Salon Event Exhibition
          Vietnam Thailand Singapore Dubai
          Fans Party Investment Sharing Session
          FastBull Summit BrokersView Expo

          Preliminary Consumer Sentiment Rises to 61.8 In July, 1-year Inflation Fears Drop, But Uncertainty Persists

          Glendon

          Economic

          Commodity

          Summary:

          The gold market is trading higher ahead of the weekend after the latest data showed consumer sentiment in the U.S. improving more than expected, while near-term inflation expectations pulled back.

          The gold market is trading higher ahead of the weekend after the latest data showed consumer sentiment in the U.S. improving more than expected, while near-term inflation expectations pulled back.

          The University of Michigan announced on Friday that the preliminary reading of its Consumer Sentiment survey for July was 61.8, which was higher than June’s final reading of 60.7. The data was better than expectations, as the consensus forecast of economists called for a 61.5 reading.

          “Consumer sentiment was little changed from June, inching up about one index point,” said Surveys of Consumers Director Joanne Hsu. “While sentiment reached its highest value in five months, it remains a substantial 16% below December 2024 and is well below its historical average.”

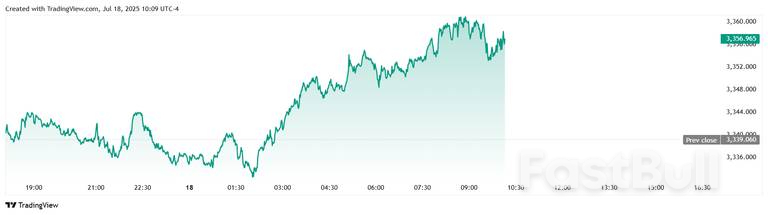
          The gold market is trading near the upper edge of its daily range following the 10 am EDT data release, with spot gold last trading at $3,356.84 per ounce for a gain of 0.53% on the day.

          The components of the July index were mixed, with a sharp rise in short-run expected business conditions and a significant drop in one-year inflation expectations, but longer-run inflation fears persisted.

          “Short-run business conditions improved about 8%, whereas expected personal finances fell back about 4%,” Hsu noted. “Consumers are unlikely to regain their confidence in the economy unless they feel assured that inflation is unlikely to worsen, for example if trade policy stabilizes for the foreseeable future. At this time, the interviews reveal little evidence that other policy developments, including the recent passage of the tax and spending bill, moved the needle much on consumer sentiment.”

          Year-ahead inflation expectations also fell for a second straight month, dropping from 5.0% in June to 4.4% this month. “Long-run inflation expectations receded for the third consecutive month, falling back from 4.0% in June to 3.6% in July,” she said. “Both readings are the lowest since February 2025 but remain above December 2024, indicating that consumers still perceive substantial risk that inflation will increase in the future.”

          Source: Kitco

          To stay updated on all economic events of today, please check out our Economic calendar
          Risk Warnings and Disclaimers
          You understand and acknowledge that there is a high degree of risk involved in trading. Following any strategies or investment methods may lead to potential losses. The content on the site is provided by our contributors and analysts for information purposes only. You are solely responsible for determining whether any trading assets, securities, strategy, or any other product is suitable for investing based on your own investment objectives and financial situation.
          Add to Favorites
          Share

          Natural Gas and Oil Forecast: Brent Rebounds as China GDP and US Data Boost Sentiment

          Adam

          Commodity

          Market Overview

          Oil markets remained volatile on Friday as WTI crude held onto recent gains near $ 67.60 per barrel, buoyed by renewed supply risks and a brighter demand outlook. Output disruptions of up to 150,000 barrels per day in northern Iraq, alongside broader geopolitical tensions, stoked market uncertainty.
          On the demand side, resilient U.S. economic indicators and stronger-than-expected Chinese GDP data helped ease growth concerns. Meanwhile, a sharp drop in U.S. crude inventories, despite rising production, underscored solid consumption.
          However, prices still faced weekly losses of over 1% as easing sanctions concerns tempered bullish momentum, highlighting the market’s sensitivity to shifting global risk dynamics.

          Natural Gas Price Forecast

          Natural Gas and Oil Forecast: Brent Rebounds as China GDP and US Data Boost Sentiment_1Natural Gas (NG) Price Chart

          Natural gas prices are holding firm at $3.578, staying within a rising parallel channel after rebounding from the $3.19 low. The 50-EMA at $3.476 now acts as dynamic support, while the 200-EMA at $3.620 remains a key resistance zone.
          A clean breakout above $3.600 could open the door to $3.622 and $3.678, with $3.752 as the next upside target. On the downside, a break below $3.510 may trigger a correction toward $3.419 and $3.292.
          As long as the price stays inside the ascending channel and above the 50-EMA, the bias remains bullish. Traders should watch for a breakout or rejection near the $3.600 level to determine the next directional move.

          WTI Oil Price Forecast

          Natural Gas and Oil Forecast: Brent Rebounds as China GDP and US Data Boost Sentiment_2WTI Price Chart

          WTI crude oil is attempting a bullish breakout above $67.88 after bouncing from a rising trendline near $65.56. Price now trades above both the 50-day EMA ($67.17) and 200-day EMA ($66.78), signaling strengthening short-term momentum.
          Immediate resistance sits at the 23.6% Fibonacci level ($67.11), followed by $69.00 and $70.56. A sustained move above $69.00 would expose $72.11 as the next upside target. On the downside, support is seen at $67.12 and $65.56. A drop below $65.56 could open the door toward $64.02.
          Overall structure suggests cautious bullishness, but momentum hinges on holding above $67.12 and breaking through $69.00.

          Brent Oil Price Forecast

          Natural Gas and Oil Forecast: Brent Rebounds as China GDP and US Data Boost Sentiment_3Brent Price Chart

          Brent crude is trading near $69.81, showing signs of strength after rebounding off the $69.00 support level. The price is moving within an ascending channel and remains above the 200-EMA ($68.67), with the 50-EMA ($69.08) acting as dynamic resistance.
          A clean break above $70.31 could open the door to $71.50 and possibly $72.83. On the downside, support is firm at $69.00, followed by $67.66 and $66.88. As long as the price stays within the rising channel and holds above key EMAs, the short-term structure favors cautious upside potential.
          Traders will be watching for a decisive close above $70.31 to confirm renewed bullish momentum.

          Source: fxempire

          Risk Warnings and Disclaimers
          You understand and acknowledge that there is a high degree of risk involved in trading. Following any strategies or investment methods may lead to potential losses. The content on the site is provided by our contributors and analysts for information purposes only. You are solely responsible for determining whether any trading assets, securities, strategy, or any other product is suitable for investing based on your own investment objectives and financial situation.
          Add to Favorites
          Share

          Japan's core CPI cools as expected

          Adam

          Economic

          The Japanese yen is showing little movement on Friday. In the North American session, USD/JPY is trading at 148.69, up 0.06% on the day. On the data calendar, Japan's inflation rate eased in June. It's a light day in the US, highlighted by UoM consumer sentiment and inflation expectations.

          Japan's core CPI eases to 3.3%

          Inflation in Japan fell in June as expected and the yen is showing little movement today. Headline CPI dropped to 3.3% y/y from 3.5% in May, matching the consensus. This was the lowest level since Nov. 2024, as prices for electricity and gasoline rose more slowly in June. Food prices were up 7.2%, the most since March, as rice prices soared 100%. Monthly, CPI eased to 0.1%, down from 0.3% in May. Core inflation, which excludes fresh food but includes energy, fell to 3.3% from 3.7%, in line with the consensus and the lowest pace since March.
          The inflation numbers come just before an election for Japan's Upper House of Parliament on Sunday. The ruling coalition is in danger of losing its majority, and if that happens, it will likely impact yields and the yen next week.
          The Bank of Japan meets next on July 31 and is expected to continue its wait-and-see approach and hold interest rates. The BoJ hiked rates in January but hopes for a series of rate increases were dashed after US President Trump promised and delivered tariffs on many US trading partners, including Japan.
          Trade talks between the US and Japan have bogged down and Trump has threatened to hit Japan with 25% tariffs if an agreement isn't reached by Aug. 1. In this uncertain environment, the BoJ isn't likely to raise interest rates.

          USD/JPY Technical

          USD/JPY is testing resistance at 148.66. Above, there is resistance at 1.4882
          148.44 and 148.28 are the next support levels
          Japan's core CPI cools as expected_1

          USDJPY 4-Hour Chart, July 18, 2025

          Source: marketpulse

          To stay updated on all economic events of today, please check out our Economic calendar
          Risk Warnings and Disclaimers
          You understand and acknowledge that there is a high degree of risk involved in trading. Following any strategies or investment methods may lead to potential losses. The content on the site is provided by our contributors and analysts for information purposes only. You are solely responsible for determining whether any trading assets, securities, strategy, or any other product is suitable for investing based on your own investment objectives and financial situation.
          Add to Favorites
          Share

          Europe Threatens Iran With Sanctions If Nuclear Talks Don’t Restart

          Michelle

          Political

          France, Germany, and the UK told Iran on Thursday they’ll bring back United Nations sanctions unless Tehran gets serious and restarts nuclear talks immediately.

          They want actual results on the table before August is over. No more delays. The pressure’s real this time. The three countries, called the E3, spoke with Iran’s Foreign Minister Abbas Abbas Araghchi, and they weren’t asking nicely.

          It was their first direct contact since Israel and the U.S. bombed Iranian nuclear sites last month. That changed everything. Now the Europeans are watching Iran’s next move like hawks.

          A French diplomatic source said the E3 pushed hard for “a verifiable and lasting deal” and warned that the snapback mechanism would be triggered if Iran kept stalling.

          Araghchi fires back, blames U.S. for walking away

          Araghchi jumped on X and made it clear he wasn’t impressed. He said he told the Europeans: “It was US that left the negotiation table in June this year and chose a military option instead, not Iran.” He said if the E3 or EU wanted to be taken seriously, they should stop throwing around threats. He said:

          “They should act responsibly, and put aside the worn-out policies of threat and pressure, including the ‘snap-back’ for which they lack absolutely [any] moral and legal ground.”

          Araghchi made one thing clear: Iran is open to talking, but only “when the other party is ready for a fair, balanced, and mutually beneficial nuclear deal.” Translation: no talks unless the West stops playing tough guy. Iran isn’t going to roll over.

          The 2015 nuclear deal is still technically in place, at least for now. The U.S. walked away from it in 2018, but France, the UK, Germany, China, and Russia are still on board.

          Under the agreement, if Iran breaks the rules, any one of those remaining members can launch the snapback and bring back UN sanctions, and it would take just 30 days to kick in. After that, Iran would be back under international pressure with no way out unless it complies.

          A French source added, “The ministers also reiterated their determination to use the so-called ‘snapback’ mechanism in the absence of concrete progress toward such an agreement by the end of the summer.” No specifics were given, but the message was loud: Europe’s done waiting.

          Right now, IAEA inspectors are no longer inside Iran. That’s a big problem. No one has eyes on the nuclear facilities, and that makes any real deal basically impossible. Without verification, there’s nothing to talk about.

          Iran says it’s open to diplomacy, but there’s nothing on the calendar. A sixth round of talks with the U.S. isn’t even close to happening. Diplomats who allegedly spoke anonymously said the August deadline is a long shot.

          Still, some hope remains. Two European diplomats said they’re trying to sync with Washington in the coming days. The goal? Get talks going again. But it’s not clear if that’ll happen before August runs out. And if it doesn’t, the snapback will probably go live.

          Source: CryptoSlate

          Risk Warnings and Disclaimers
          You understand and acknowledge that there is a high degree of risk involved in trading. Following any strategies or investment methods may lead to potential losses. The content on the site is provided by our contributors and analysts for information purposes only. You are solely responsible for determining whether any trading assets, securities, strategy, or any other product is suitable for investing based on your own investment objectives and financial situation.
          Add to Favorites
          Share

          Pound Sterling Looks to Build On Recent Gains Made Against Euro and Dollar

          Warren Takunda

          Economic

          Pound Sterling has corrected higher against the Euro, Dollar and some other major peers over the second half of the past week, as the July selloff fades from exhaustion more than anything else.
          Heading into the week, some technical indicators spoke of the need for some near-term gains to correct from oversold levels, while the bad news concerning the UK economy is now generally well understood and incorporated into exchange rates.
          This left Sterling ripe for a rebound, with the trigger for that move coming on Thursday following the release of above-consensus UK wage data that spoke of enduring inflation pressures, which should limit the Bank of England's ability to cut interest rates too fast, or too far.
          With foreign exchange markets moving away from Trump-related trade drivers, the focus returns to relative interest rate policy, ensuring the steady build-up of bets in favour of quicker Bank of England easing has weighed on the Pound.
          This means Wednesday's hot inflation figures, combined with Thursday's inflationary wage numbers, send a reminder that the repricing lower of UK interest rate expectations will be limited, offering the Pound a hand.
          "We downgrade our GBP outlook but maintain our view that it should recoup some ground vs the EUR & the USD in H225 and further outperform the EUR in 2026," says Valentin Marinov, Head of G10 FX Strategy at Crédit Agricole.
          The Pound to Euro exchange rate (GBP/EUR), which is now at 1.1550, looks like it wants to even out above 1.15, which was a level tested earlier this week and now looks to be forming a level of resistance.
          Pound Sterling Looks to Build On Recent Gains Made Against Euro and Dollar_1

          Above: GBP/EUR is flattening out. RSI in lower panel reached oversold on Monday and is rebounding, reflecting the pick-up in spot above 1.15.

          The EUR/GBP measure is at 0.8656. "We slightly adjusted our forecasts higher to reflect the new outlook and now see EUR/GBP around current levels in the coming months but edging slightly higher in 2026," says Patrick Ernst, FX Strategist at the UBS Chief Investment Office.
          The Pound to Dollar exchange rate (GBP/USD) is meanwhile still very much dependent on the U.S. side of the equation. Here, the Dollar has been regaining recently lost ground, pushing GBP/USD down to 1.34 having been as high as 1.3750 at the start of the month.
          "The Dollar rebound can gather some pace," says Francesco Pesole, FX Strategist at ING Bank N.V.
          The dollar index, a broad measure of U.S. Dollar performance, is on track for a second consecutive week of gains, having rallied over 2% since the 1 July low of 96.50.
          "While modest compared to the steep losses in the first half of 2025, the dollar has realigned with core macro drivers and notably re-established its positive correlation with 10year yields. One of our key calls this summer is that this return to dollar ‘functionality’ reduces the likelihood of new selloffs," adds Pesole.Pound Sterling Looks to Build On Recent Gains Made Against Euro and Dollar_2

          Above: GBP/USD has found some near-term support, but could yet face a challenging summer.

          Although the key GBP/USD and GBP/EUR pairs are forming potential bases, the prospect for a resumption of the recent selloff cannot be discounted.
          For one, UK macroeconomic data is still a concern, with the UK labour market report on Thursday confirming an eighth consecutive month of job losses, while last week's GDP print made for the second consecutive monthly contraction.
          "The mood surrounding the pound has soured in recent weeks and dovish comments by BoE governor Bailey on the labour market and interest rates put investors on notice for potentially further losses ahead," says Kenneth Broux, a market strategist at Société Générale. "A return below 1.34 could be on the cards"
          Analysts at Crédit Agricole have meanwhile lowered their general Pound Sterling profile as a result of the slowing in economic momentum.
          "We downgrade our GBP outlook given that recent developments have increased the downside risks to the UK economic outlook and could thus lead to a more aggressive easing from the BoE," says Marinov.

          Source: Poundsterlinglive

          To stay updated on all economic events of today, please check out our Economic calendar
          Risk Warnings and Disclaimers
          You understand and acknowledge that there is a high degree of risk involved in trading. Following any strategies or investment methods may lead to potential losses. The content on the site is provided by our contributors and analysts for information purposes only. You are solely responsible for determining whether any trading assets, securities, strategy, or any other product is suitable for investing based on your own investment objectives and financial situation.
          Add to Favorites
          Share

          Positive tone for markets, after a record-breaking week

          Adam

          Economic

          The positive tone to risk sentiment is continuing on Friday, after a week of record highs for global equities. The S&P 500 recorded another record high on Thursday and is expected to extend gains on Friday, although overall stock market gains have been slim this week. Likewise, while stronger than expected earnings reports have driven indices to record highs, the gains for individual stocks after reporting earnings have been below average. For example, Netflix delivered a better-than-expected earnings report for Q2 and posted a stronger outlook for full-year 2025 revenue, yet its share price is down more than 1% in the pre-market on Friday, usually, the average move in its share price in the 24 hours after an earnings report is more than 8%.

          Why the underwhelming price action after earnings beats?

          The reason why stocks are inching into fresh record territory is perfectly reasonable: some stocks and indices look overvalued and have had a strong run already in 2025. For example, Netflix has a 12-month forward P/E ratio of more than 40, and the S&P 500’s P/E ratio is above 26 times aggregate earnings, which is the highest level since February, and is approaching the 27.7 level, which was the highest rate since 2022. When valuations get to this level, it is natural that caution sets in, and fears rise about a stock market fall or correction.
          High valuations a risk for US equities
          Thus, good news for stocks and risk sentiment is tempered by concerns about excessive valuations and whether strong earnings growth in Q2 can be repeated later this year. For example, banks including Goldman Sachs, JP Morgan and Citi all reported stunning trading results for Q2 due to excessive volatility in April, that may not get replicated in Q3. The banking sector has been outperforming the overall S&P 500 so far this year, but warning signs lie ahead. Many people think that Warren Buffet is a good lead indicator for financial markets, and Berkshire Hathaway has been offloading US banks in recent months.
          Many people may ask why sell stocks when they are continuing to make gains, which is a valid question. However, Berkshire Hathaway has a long-term investment strategy and so levels may have reached their take profit targets. This does not mean that banks will crash, but they may be near a peak.

          As tariff risks recede, stocks reach record highs

          Tariffs dominated market sentiment at the start of this week, but as the focus turns to President Trump’s health, tariff risks could recede. The EU and Canada now face the biggest hurdle to agree better terms than the 30% and 35% tariff rates applied to their exports. The August 1st deadline is a risk event for markets, however, with the President toning down his rhetoric, markets are quick to forget tariff risks and concentrate on the positives including a resilient US economy.
          The dollar is also falling on Friday, although it is the second-best performing currency in the G10 FX space this week. The dollar has had a decent month, especially vs. the yen and the pound, although it continued to post losses vs. the euro and the Swiss franc, which remains the FX market’s preferred haven, even though the SNB has implemented 0% interest rates.

          The pound is at risk from bond yields once again

          The pound is at risk of breaking down and is testing the zone around $1.3370, the low from late June. If it breaks this level in the coming days, then we could see steeper losses back to $1.30. The problem for the pound is bond yields, and fears of a fiscal crisis in the UK. UK bonds have been a major underperformer in the developed markets in recent days, and 2-year yields are higher by more than 10 bps this week, 10-year yields are higher by 7bps. There does not seem to be much good economic news around either. In the past week, UK GDP has contracted, unemployment is higher, and inflation rose by more than expected.
          Even with this backdrop the FTSE 100 reached a record high, and the FTSE 250 reached its highest level since 2022. Why are UK stock markets recording these highs when the domestic economy is so weak? It is because they are not reliant on the UK, and they contain international companies. Even the FTSE 250 generates more than 50% of its revenue outside of the UK. Thus, the UK’s stock indices could still perform well, even as the UK economy is coming under unbearable pressure.
          UK companies driven by global factors: GSK and Burberry
          As an example, GlaxoSmithKline is the weakest performer on the FTSE 100 today, due to the FDA, the drug administration in the US, failing to back its blood cancer drug. The reason the FDA gave is that the company refused to test the drug at lower levels to reduce eye toxicity, and this is not a sign that the FDA is showing a preference for US drug firms over international firms.
          In contrast, Burberry, the UK luxury goods firm, is the second-best performer on the FTSE 250 after it reported better than expected earnings. Although sales fell in the first quarter of their fiscal year, they eased by less than expected, which is a sign that the company’s new strategic direction could be working. For example, its store sales fell 1% in the three months to June, compared to 6% a year ago. The company also said that it expects a continued improvement in the coming quarters.
          Overall, the focus on Friday will be on the University of Michigan consumer confidence data in the US that will be released this afternoon. The market will be looking for consumer confidence data to reinforce the ‘resilient US economy’ narrative that has taken hold of financial markets this week.

          Source: xtb

          To stay updated on all economic events of today, please check out our Economic calendar
          Risk Warnings and Disclaimers
          You understand and acknowledge that there is a high degree of risk involved in trading. Following any strategies or investment methods may lead to potential losses. The content on the site is provided by our contributors and analysts for information purposes only. You are solely responsible for determining whether any trading assets, securities, strategy, or any other product is suitable for investing based on your own investment objectives and financial situation.
          Add to Favorites
          Share

          Japan’s Core CPI Cools As Expected

          Glendon

          Economic

          Forex

          The Japanese yen is showing little movement on Friday. In the North American session, USD/JPY is trading at 148.69, up 0.06% on the day. On the data calendar, Japan’s inflation rate eased in June. It’s a light day in the US, highlighted by UoM consumer sentiment and inflation expectations.

          Japan’s core CPI eases to 3.3%

          Inflation in Japan fell in June as expected and the yen is showing little movement today. Headline CPI dropped to 3.3% y/y from 3.5% in May, matching the consensus. This was the lowest level since Nov. 2024, as prices for electricity and gasoline rose more slowly in June. Food prices were up 7.2%, the most since March, as rice prices soared 100%. Monthly, CPI eased to 0.1%, down from 0.3% in May. Core inflation, which excludes fresh food but includes energy, fell to 3.3% from 3.7%, in line with the consensus and the lowest pace since March.

          The inflation numbers come just before an election for Japan’s Upper House of Parliament on Sunday. The ruling coalition is in danger of losing its majority, and if that happens, it will likely impact yields and the yen next week.

          The Bank of Japan meets next on July 31 and is expected to continue its wait-and-see approach and hold interest rates. The BoJ hiked rates in January but hopes for a series of rate increases were dashed after US President Trump promised and delivered tariffs on many US trading partners, including Japan.

          Trade talks between the US and Japan have bogged down and Trump has threatened to hit Japan with 25% tariffs if an agreement isn’t reached by Aug. 1. In this uncertain environment, the BoJ isn’t likely to raise interest rates.

          USD/JPY Technical

          • USD/JPY is testing resistance at 148.66. Above, there is resistance at 1.4882
          • 148.44 and 148.28 are the next support levels

          USDJPY 4-Hour Chart, July 18, 2025

          Source: ACTIONFOREX

          To stay updated on all economic events of today, please check out our Economic calendar
          Risk Warnings and Disclaimers
          You understand and acknowledge that there is a high degree of risk involved in trading. Following any strategies or investment methods may lead to potential losses. The content on the site is provided by our contributors and analysts for information purposes only. You are solely responsible for determining whether any trading assets, securities, strategy, or any other product is suitable for investing based on your own investment objectives and financial situation.
          Add to Favorites
          Share
          FastBull
          Copyright © 2025 FastBull Ltd

          728 RM B 7/F GEE LOK IND BLDG NO 34 HUNG TO RD KWUN TONG KLN HONG KONG

          TelegramInstagramTwitterfacebooklinkedin
          App Store Google Play Google Play
          Products
          Charts

          Chats

          Q&A with Experts
          Screeners
          Economic Calendar
          Data
          Tools
          Membership
          Features
          Function
          Markets
          Copy Trading
          Latest Signals
          Contests
          News
          Analysis
          24/7
          Columns
          Education
          Company
          Careers
          About Us
          Contact Us
          Advertising
          Help Center
          Feedback
          User Agreement
          Privacy Policy
          Business

          White Label

          Data API

          Web Plug-ins

          Poster Maker

          Affiliate Program

          Risk Disclosure

          The risk of loss in trading financial instruments such as stocks, FX, commodities, futures, bonds, ETFs and crypto can be substantial. You may sustain a total loss of the funds that you deposit with your broker. Therefore, you should carefully consider whether such trading is suitable for you in light of your circumstances and financial resources.

          No decision to invest should be made without thoroughly conducting due diligence by yourself or consulting with your financial advisors. Our web content might not suit you since we don't know your financial conditions and investment needs. Our financial information might have latency or contain inaccuracy, so you should be fully responsible for any of your trading and investment decisions. The company will not be responsible for your capital loss.

          Without getting permission from the website, you are not allowed to copy the website's graphics, texts, or trademarks. Intellectual property rights in the content or data incorporated into this website belong to its providers and exchange merchants.

          Not Logged In

          Log in to access more features

          FastBull Membership

          Not yet

          Purchase

          Become a signal provider
          Help Center
          Customer Service
          Dark Mode
          Price Up/Down Colors

          Log In

          Sign Up

          Position
          Layout
          Fullscreen
          Default to Chart
          The chart page opens by default when you visit fastbull.com