• Trade
  • Markets
  • Copy
  • Contests
  • News
  • 24/7
  • Calendar
  • Q&A
  • Chats
Trending
Screeners
SYMBOL
LAST
BID
ASK
HIGH
LOW
NET CHG.
%CHG.
SPREAD
SPX
S&P 500 Index
6870.39
6870.39
6870.39
6895.79
6858.28
+13.27
+ 0.19%
--
DJI
Dow Jones Industrial Average
47954.98
47954.98
47954.98
48133.54
47871.51
+104.05
+ 0.22%
--
IXIC
NASDAQ Composite Index
23578.12
23578.12
23578.12
23680.03
23506.00
+72.99
+ 0.31%
--
USDX
US Dollar Index
98.830
98.910
98.830
98.960
98.810
-0.120
-0.12%
--
EURUSD
Euro / US Dollar
1.16542
1.16550
1.16542
1.16551
1.16341
+0.00116
+ 0.10%
--
GBPUSD
Pound Sterling / US Dollar
1.33404
1.33415
1.33404
1.33420
1.33151
+0.00092
+ 0.07%
--
XAUUSD
Gold / US Dollar
4212.39
4212.77
4212.39
4213.06
4190.61
+14.48
+ 0.34%
--
WTI
Light Sweet Crude Oil
59.998
60.035
59.998
60.063
59.752
+0.189
+ 0.32%
--

Community Accounts

Signal Accounts
--
Profit Accounts
--
Loss Accounts
--
View More

Become a signal provider

Sell trading signals to earn additional income

View More

Guide to Copy Trading

Get started with ease and confidence

View More

Signal Accounts for Members

All Signal Accounts

Best Return
  • Best Return
  • Best P/L
  • Best MDD
Past 1W
  • Past 1W
  • Past 1M
  • Past 1Y

All Contests

  • All
  • Trump Updates
  • Recommend
  • Stocks
  • Cryptocurrencies
  • Central Banks
  • Featured News
Top News Only
Share

Russia's Air Defences Destroy 67 Ukrainian Drones Overnight, RIA Agency Reports

Share

India's Nifty 50 Index Down 0.37%

Share

Hsi Down 287 Pts, Hsti Down 13 Pts, Pop Mart Down Over 8%, Ping An Hit New Highs

Share

China's November Coal Imports Down 20% Year-On-Year

Share

At Least One Thai Soldier Killed And 7 Wounded - Thai Army Spokesman

Share

India's Nifty Bank Futures Up 0.73% In Pre-Open Trade

Share

Cambodia Has Expanded Clashes To Several New Locations - Thai Army Spokesman

Share

Cambodian Military Has Increased Deployment Of Troops And Weapons - Thai Army Spokesman

Share

India's Nifty 50 Futures Up 0.53% In Pre-Open Trade

Share

India's Nifty 50 Index Down 0.1% In Pre-Open Trade

Share

Indian Rupee Opens Down 0.1% At 90.0625 Per USA Dollar, Versus 89.98 Previous Close

Share

China November Copper Imports At 427000 Tonnes

Share

China November Coal Imports At 44.05 Million Tonnes

Share

China November Iron Ore Imports At 110.54 Million Tonnes, Down 0.7 % From October

Share

China November Meat Imports At 393000 Tonnes

Share

China Imported 8.11 Million Tonnes Of Soy In November

Share

China November Crude Oil Imports Up 5.2 % From October

Share

China November Rare Earth Exports At 5493.9 Tonnes

Share

China Jan-Nov Iron Ore Imports Up 1.4% At 1.139 Billion Metric Tons

Share

China Jan-Nov Trade Balance 7708.1 Billion Yuan

TIME
ACT
FCST
PREV
U.S. Personal Income MoM (Sept)

A:--

F: --

P: --

U.S. PCE Price Index YoY (SA) (Sept)

A:--

F: --

P: --

U.S. PCE Price Index MoM (Sept)

A:--

F: --

P: --

U.S. Personal Outlays MoM (SA) (Sept)

A:--

F: --

P: --

U.S. Core PCE Price Index MoM (Sept)

A:--

F: --

P: --

U.S. Core PCE Price Index YoY (Sept)

A:--

F: --

P: --

U.S. UMich 5-Year-Ahead Inflation Expectations Prelim YoY (Dec)

A:--

F: --

P: --

U.S. Real Personal Consumption Expenditures MoM (Sept)

A:--

F: --

P: --

U.S. UMich Current Economic Conditions Index Prelim (Dec)

A:--

F: --

P: --

U.S. UMich Consumer Sentiment Index Prelim (Dec)

A:--

F: --

P: --

U.S. UMich 1-Year-Ahead Inflation Expectations Prelim (Dec)

A:--

F: --

P: --

U.S. UMich Consumer Expectations Index Prelim (Dec)

A:--

F: --

P: --

U.S. Weekly Total Rig Count

A:--

F: --

P: --

U.S. Weekly Total Oil Rig Count

A:--

F: --

P: --

U.S. Unit Labor Cost Prelim (SA) (Q3)

--

F: --

P: --

U.S. Consumer Credit (SA) (Oct)

A:--

F: --

P: --

China, Mainland Foreign Exchange Reserves (Nov)

A:--

F: --

P: --

Japan Wages MoM (Oct)

A:--

F: --

P: --

Japan Trade Balance (Oct)

A:--

F: --

P: --

Japan Nominal GDP Revised QoQ (Q3)

A:--

F: --

P: --

Japan Trade Balance (Customs Data) (SA) (Oct)

A:--

F: --

P: --

Japan GDP Annualized QoQ Revised (Q3)

A:--

F: --

P: --
China, Mainland Exports YoY (CNH) (Nov)

A:--

F: --

P: --

China, Mainland Imports YoY (CNH) (Nov)

A:--

F: --

P: --

China, Mainland Exports (Nov)

A:--

F: --

P: --

China, Mainland Imports (CNH) (Nov)

A:--

F: --

P: --

China, Mainland Trade Balance (CNH) (Nov)

A:--

F: --

P: --

China, Mainland Imports YoY (USD) (Nov)

A:--

F: --

P: --

China, Mainland Exports YoY (USD) (Nov)

A:--

F: --

P: --

China, Mainland Trade Balance (USD) (Nov)

A:--

F: --

P: --

Germany Industrial Output MoM (SA) (Oct)

--

F: --

P: --

Euro Zone Sentix Investor Confidence Index (Dec)

--

F: --

P: --

Canada Leading Index MoM (Nov)

--

F: --

P: --

Canada National Economic Confidence Index

--

F: --

P: --

U.S. Dallas Fed PCE Price Index YoY (Sept)

--

F: --

P: --

China, Mainland Trade Balance (USD) (Nov)

--

F: --

P: --

U.S. 3-Year Note Auction Yield

--

F: --

P: --

U.K. BRC Overall Retail Sales YoY (Nov)

--

F: --

P: --

U.K. BRC Like-For-Like Retail Sales YoY (Nov)

--

F: --

P: --

Australia Overnight (Borrowing) Key Rate

--

F: --

P: --

RBA Rate Statement
RBA Press Conference
Germany Exports MoM (SA) (Oct)

--

F: --

P: --

U.S. NFIB Small Business Optimism Index (SA) (Nov)

--

F: --

P: --

Mexico Core CPI YoY (Nov)

--

F: --

P: --

Mexico 12-Month Inflation (CPI) (Nov)

--

F: --

P: --

Mexico PPI YoY (Nov)

--

F: --

P: --

Mexico CPI YoY (Nov)

--

F: --

P: --

U.S. Weekly Redbook Index YoY

--

F: --

P: --

U.S. JOLTS Job Openings (SA) (Oct)

--

F: --

P: --

China, Mainland M2 Money Supply YoY (Nov)

--

F: --

P: --

China, Mainland M0 Money Supply YoY (Nov)

--

F: --

P: --

China, Mainland M1 Money Supply YoY (Nov)

--

F: --

P: --

U.S. EIA Short-Term Crude Production Forecast For The Next Year (Dec)

--

F: --

P: --

U.S. EIA Short-Term Crude Production Forecast For The Year (Dec)

--

F: --

P: --

U.S. EIA Natural Gas Production Forecast For The Next Year (Dec)

--

F: --

P: --

EIA Monthly Short-Term Energy Outlook
U.S. 10-Year Note Auction Avg. Yield

--

F: --

P: --

U.S. API Weekly Cushing Crude Oil Stocks

--

F: --

P: --

U.S. API Weekly Crude Oil Stocks

--

F: --

P: --

Q&A with Experts
    • All
    • Chatrooms
    • Groups
    • Friends
    Connecting
    .
    .
    .
    Type here...
    Add Symbol or Code

      No matching data

      All
      Trump Updates
      Recommend
      Stocks
      Cryptocurrencies
      Central Banks
      Featured News
      • All
      • Russia-Ukraine Conflict
      • Middle East Flashpoint
      • All
      • Russia-Ukraine Conflict
      • Middle East Flashpoint
      Search
      Products

      Charts Free Forever

      Chats Q&A with Experts
      Screeners Economic Calendar Data Tools
      Membership Features
      Data Warehouse Market Trends Institutional Data Policy Rates Macro

      Market Trends

      Market Sentiment Order Book Forex Correlations

      Top Indicators

      Charts Free Forever
      Markets

      News

      News Analysis 24/7 Columns Education
      From Institutions From Analysts
      Topics Columnists

      Latest Views

      Latest Views

      Trending Topics

      Top Columnists

      Latest Update

      Signals

      Copy Rankings Latest Signals Become a signal provider AI Rating
      Contests
      Brokers

      Overview Brokers Assessment Rankings Regulators News Claims
      Broker listing Forex Brokers Comparison Tool Live Spread Comparison Scam
      Q&A Complaint Scam Alert Videos Tips to Detect Scam
      More

      Business
      Events
      Careers About Us Advertising Help Center

      White Label

      Data API

      Web Plug-ins

      Affiliate Program

      Awards Institution Evaluation IB Seminar Salon Event Exhibition
      Vietnam Thailand Singapore Dubai
      Fans Party Investment Sharing Session
      FastBull Summit BrokersView Expo
      Recent Searches
        Top Searches
          Markets
          News
          Analysis
          User
          24/7
          Economic Calendar
          Education
          Data
          • Names
          • Latest
          • Prev

          View All

          No data

          Scan to Download

          Faster Charts, Chat Faster!

          Download App
          English
          • English
          • Español
          • العربية
          • Bahasa Indonesia
          • Bahasa Melayu
          • Tiếng Việt
          • ภาษาไทย
          • Français
          • Italiano
          • Türkçe
          • Русский язык
          • 简中
          • 繁中
          Open Account
          Search
          Products
          Charts Free Forever
          Markets
          News
          Signals

          Copy Rankings Latest Signals Become a signal provider AI Rating
          Contests
          Brokers

          Overview Brokers Assessment Rankings Regulators News Claims
          Broker listing Forex Brokers Comparison Tool Live Spread Comparison Scam
          Q&A Complaint Scam Alert Videos Tips to Detect Scam
          More

          Business
          Events
          Careers About Us Advertising Help Center

          White Label

          Data API

          Web Plug-ins

          Affiliate Program

          Awards Institution Evaluation IB Seminar Salon Event Exhibition
          Vietnam Thailand Singapore Dubai
          Fans Party Investment Sharing Session
          FastBull Summit BrokersView Expo

          OPEC+ Discussing Pause to Output Hikes After Next Increase

          Glendon

          Commodity

          Summary:

          OPEC+ is discussing a pause in further production increases after its next monthly hike, according to delegates familiar with the matter.

          OPEC+ is discussing a pause in further production increases after its next monthly hike, according to delegates familiar with the matter.

          Saudi Arabia and its partners already have a tentative plan to complete the revival of a 2.2 million-barrel supply revival in September, with another monthly tranche of 550,000 barrels.

          The group will likely wait for some time before moving onto reversing another layer of halted production, amounting to roughly 1.66 million barrels per day, said the delegates. They asked not to be identified as the talks are private.

          Source: Bloomberg Europe

          Risk Warnings and Disclaimers
          You understand and acknowledge that there is a high degree of risk involved in trading. Following any strategies or investment methods may lead to potential losses. The content on the site is provided by our contributors and analysts for information purposes only. You are solely responsible for determining whether any trading assets, securities, strategy, or any other product is suitable for investing based on your own investment objectives and financial situation.
          Add to Favorites
          Share

          BofA: USD Faces Limited Downside in Second Half of 2025

          Michelle

          Economic

          Forex

          The US dollar has experienced the worst start to a year since 1973, but analysis from Bank of America suggests the currency may see more limited downside in the second half of 2025.

          According to BofA’s time zone framework analysis, while overall USD price action no longer correlates with Federal Reserve rate cut pricing, cumulative USD return during US trading hours still maintains a +71% correlation with Fed rates pricing in 2025.

          The bank notes that unchanged Fed rates for the remainder of the year should moderately support the USD during US trading hours.

          Asia-based investors have been the biggest USD sellers so far in 2025. However, a longer-term analysis reveals that USD price actions in Asian trading hours have flattened after cumulative long returns from the past two years unwound to neutral levels. BofA suggests these investors may wait for new bearish USD catalysts to form in other time zones before pushing the currency lower.

          The dollar still has significant room to depreciate during European trading hours, but this would likely require global equity markets to outperform US equity for the rest of the year. Foreign investors now have less incentive to increase their FX hedge ratio on US-based assets following the year-to-date USD movement.

          While global equities outperformed US markets in Q1 2025, the US regained leadership in Q2. BofA indicates that relative equity performance should be the focal point for global FX investors in the second half of 2025.

          Source: Investing

          To stay updated on all economic events of today, please check out our Economic calendar
          Risk Warnings and Disclaimers
          You understand and acknowledge that there is a high degree of risk involved in trading. Following any strategies or investment methods may lead to potential losses. The content on the site is provided by our contributors and analysts for information purposes only. You are solely responsible for determining whether any trading assets, securities, strategy, or any other product is suitable for investing based on your own investment objectives and financial situation.
          Add to Favorites
          Share

          German Exporters Urge Caution on US Trade Deal, Warn Against Concessions Without Fair Terms

          Gerik

          Economic

          German Exporters Prioritize Equity Over Expediency in US Negotiations

          As trade tensions between the European Union and the United States escalate, Germany’s leading export lobby has cautioned against rushing into a trade agreement that overlooks European interests. Dirk Jandura, President of the Federation of German Wholesale, Foreign Trade and Services (BGA), stated firmly in Berlin that any forthcoming deal with Washington must be balanced and fair not merely an exercise in damage control to avert tariffs.
          The urgency arises from President Donald Trump’s August 1 deadline, which threatens sweeping tariff hikes on European goods if a framework agreement is not reached. In response, the European Commission is working to broker a deal in the coming days. However, German exporters are warning that concessionary diplomacy could sacrifice long-term strategic interests for short-term relief.

          Causal Link Between Tariff Threats and Trade Decline

          Recent trade data underscores the deteriorating situation. German exports to the United States its largest trading partner in 2024, with bilateral goods trade reaching €253 billion fell by 7.7% in May, following a 10.5% drop in April. These back-to-back contractions mark a clear downward trajectory, closely aligned with the rise in protectionist US policies.
          The causal relationship between Trump’s tariff stance and Germany’s export downturn is becoming increasingly apparent. Tariff threats have already destabilized cross-border supply chains and investment planning, eroding the predictability exporters rely on. As Jandura put it, “The situation in foreign trade is dramatic and threatens to get worse,” highlighting the immediate economic costs and future risk if tensions escalate unchecked.

          Strategic Recalibration: Strengthening the EU’s Negotiating Leverage

          In calling for a stronger European single market, Jandura emphasizes the need for internal cohesion within the EU to counterbalance external pressures. A more integrated market, he argues, would increase Europe’s bargaining power and reduce dependency on any one trade partner, particularly the United States.
          Moreover, the BGA is advocating for the expansion or renegotiation of trade agreements beyond the transatlantic axis. This includes diversifying export destinations to reduce vulnerability to policy shifts in Washington. The proposal reflects a shift from reactive to proactive trade policy, aiming to insulate European exporters from the volatility of global trade politics.
          Germany’s exporters are drawing a line: economic pragmatism must not be mistaken for submission. While the EU scrambles to finalize a trade framework before Trump's tariff deadline, Berlin is warning against hasty decisions that may sacrifice broader European interests. The recent export declines provide empirical weight to the argument that a weak deal could do more harm than good. Ultimately, the call is for a durable, rules-based trading relationship one that upholds fairness, maintains economic stability, and reinforces Europe’s sovereignty in global trade negotiations.

          Source: Reuters

          To stay updated on all economic events of today, please check out our Economic calendar
          Risk Warnings and Disclaimers
          You understand and acknowledge that there is a high degree of risk involved in trading. Following any strategies or investment methods may lead to potential losses. The content on the site is provided by our contributors and analysts for information purposes only. You are solely responsible for determining whether any trading assets, securities, strategy, or any other product is suitable for investing based on your own investment objectives and financial situation.
          Add to Favorites
          Share

          Wall Street Banks Set for Earnings Boost Amid Trading Surge and Investment Banking Revival

          Gerik

          Economic

          Trading and Investment Banking Rebound Lifts Profit Expectations

          The earnings outlook for the six largest US banks JPMorgan, Bank of America, Citigroup, Wells Fargo, Goldman Sachs, and Morgan Stanley is showing marked improvement heading into the second-quarter results. Analysts anticipate that the rebound in investment banking activity, paired with strong trading performance, will lead to a notable earnings uplift. While the broader macroeconomic environment remains volatile due to trade tensions and policy ambiguity, the banking sector appears to have found stability through diversified revenue streams.
          Analysts at Morgan Stanley and Goldman Sachs report that deal pipelines are strengthening, reversing the April slowdown that marked a 20-year low in global M&A activity. The causal factor here is improved market confidence following a brief lull in early Q2, which revived investor appetite and prompted banks to re-engage in capital markets. This coincided with rising volatility, which in turn created favorable conditions for trading desks.

          Stronger Net Interest Income and Lower Provisions Add to Resilience

          Beyond trading and advisory services, banks are benefiting from a steady increase in net interest income (NII), albeit at low to mid-single digit rates. The expected gains stem from better margins on loans versus deposits, suggesting that interest rate dynamics continue to favor lending profitability.
          Additionally, provisions for loan losses are likely to shrink, as both consumer and commercial borrowers maintain strong credit quality. Analysts have pointed to a possible increase in overall loan growth to 5%, exceeding earlier expectations of 3%, although questions remain about how sustainable this growth trend will be in the second half of the year.

          Regulatory Relief and Capital Deployment in Focus

          The sector also enjoys support from the current deregulatory climate under President Donald Trump. Following successful performance in the Federal Reserve’s stress tests, banks have been authorized to deploy capital more freely. This includes higher dividends and renewed share buyback programs, which investors are likely to scrutinize during earnings calls.
          For institutions like Wells Fargo, the end of a long-standing asset cap opens new possibilities for growth, drawing attention to management’s strategic vision. Similarly, the successful CEO transition at Morgan Stanley has bolstered investor confidence in its long-term positioning.

          Bank-Specific Highlights and EPS Forecasts

          JPMorgan Chase is forecast to report a 5% increase in earnings per share (EPS) to $4.48, driven by stable loan growth and potential updates on its stablecoin initiatives. Bank of America is expected to post a 4% rise in EPS to $0.86, alongside a 7% gain in NII, although investment banking fees may slip to $1.2 billion.
          Citigroup stands out with a 5% projected EPS increase to $1.60, led by strong capital markets performance. Citi remains a top pick for some analysts, although higher expenses and provisions may weigh slightly. Wells Fargo is expected to report $1.41 in EPS, with operating costs falling due to personnel reductions and flat provisioning for credit losses.
          Goldman Sachs is projected to deliver an impressive 11% EPS rise to $9.53, supported by a rebound in both trading and deal-making. Morgan Stanley is anticipated to see a 7% EPS increase to $1.95, with its CEO’s strategic recalibration expected to drive future market share gains.
          US banks are entering the second quarter earnings season with cautious optimism. Trading revenues remain buoyant amid geopolitical uncertainty, and investment banking pipelines are beginning to fill again. As regulatory constraints ease and loan growth edges upward, the financial sector appears well-positioned to capitalize on these favorable conditions barring any escalation in trade disruptions or macroeconomic shocks. Investors will watch closely for clues about capital strategy, credit risk, and long-term growth momentum.

          Source: Reuters

          To stay updated on all economic events of today, please check out our Economic calendar
          Risk Warnings and Disclaimers
          You understand and acknowledge that there is a high degree of risk involved in trading. Following any strategies or investment methods may lead to potential losses. The content on the site is provided by our contributors and analysts for information purposes only. You are solely responsible for determining whether any trading assets, securities, strategy, or any other product is suitable for investing based on your own investment objectives and financial situation.
          Add to Favorites
          Share

          German Exporters Don't Want US Trade Deal 'at Any Price', Says Trade Group

          Glendon

          Economic

          Forex

          German exporters do not want a deal at any price in the trade conflict with the United States, said Dirk Jandura, head of the BGA trade lobby.

          "Our interests must be reflected in an agreement with the U.S.," Jandura said on Thursday in Berlin. "We need a fair deal for the whole of Europe. It must not be concluded at any price."

          The European Commission aims to reach a trade agreement outline with the U.S. in the coming days, ahead of the August 1 deadline set by President Donald Trump for broad tariff increases.

          Jandura, President of the Federation of German Wholesale, Foreign Trade and Services (BGA), called for a stronger European single market to improve the EU's negotiating position and to cushion the economic impact of tariffs, alongside new trade agreements or the revision of existing ones.

          The U.S. was Germany's biggest trading partner in 2024 with two-way goods trade totalling 253 billion euros ($296.77 billion).

          Exports to the United States dropped 7.7% in May month on month, following a 10.5% decline in April, data showed on Tuesday.

          "The situation in foreign trade is dramatic and threatens to get worse," said Jandura. "The consequences of Trump's tariff policy are thus becoming ever clearer."

          Source: Yahoo Finance

          To stay updated on all economic events of today, please check out our Economic calendar
          Risk Warnings and Disclaimers
          You understand and acknowledge that there is a high degree of risk involved in trading. Following any strategies or investment methods may lead to potential losses. The content on the site is provided by our contributors and analysts for information purposes only. You are solely responsible for determining whether any trading assets, securities, strategy, or any other product is suitable for investing based on your own investment objectives and financial situation.
          Add to Favorites
          Share

          Vietnam Moves to Tighten Trade Rules After US Tariff Deal Amid Transshipment Concerns

          Gerik

          Economic

          Vietnam Responds to US Pressure with Regulatory Overhaul

          In the wake of a preliminary tariff agreement with the United States, Vietnam is preparing to enforce stricter trade compliance measures aimed at curbing illegal transshipment practices. A draft decree seen by Reuters outlines plans for increased penalties and inspection protocols, primarily targeting Chinese-origin goods suspected of bypassing US tariffs by re-entering global supply chains through Vietnam.
          This initiative is a direct outcome of recent negotiations between President Donald Trump and Vietnamese leader To Lam, resulting in a deal that reduces the threatened 46% US tariff on Vietnamese imports to 20%. However, goods found to be illegally transshipped through Vietnam will still face a punitive 40% levy, signaling that enforcement not just diplomacy will determine the agreement’s long-term success.

          Causal Relationship Between Trade Surges and Transshipment Concerns

          The US has repeatedly accused Vietnam of being a transshipment hub for Chinese goods attempting to avoid high US tariffs. These accusations are supported by trade data showing a near-synchronous surge in both Vietnamese exports to the US and Vietnamese imports from China since the start of the US-China trade war in 2018. By 2024, Vietnam’s exports and imports in this bilateral triangle both stood at approximately $140 billion.
          The correlation suggests that a significant share of Vietnam’s rising export volume may be composed of goods that underwent minimal transformation, raising questions about their compliance with rules of origin standards. Washington’s demand for clearer thresholds on value-added requirements reflects a push for Vietnam to decrease its reliance on Chinese components, especially in sectors such as electronics and machinery.

          Focus of Enforcement: Origin Fraud and Counterfeit Goods

          Vietnam’s new measures aim to address widespread concerns surrounding fraudulent certificates of origin and counterfeit imports. The July 3 trade ministry document lists key product categories under heightened scrutiny, including plywood, wooden furniture, steel parts, headphones, batteries, and bicycles. These goods have been flagged as high-risk due to their prior involvement in trade defense cases by the US and EU.
          Vietnamese authorities have already intensified inspections on US-bound exports and are preparing to regulate self-certification practices more strictly. Future updates to the draft decree are expected to include financial penalties and legal sanctions. The draft also outlines plans for more frequent on-site inspections and a revision of the certificate-of-origin issuing process to deter fraud.

          Legal Ambiguities and the Path to a Final Deal

          Despite the outlined enforcement intentions, significant legal ambiguities remain. The US has yet to define how it will determine illegal transshipment and how much domestic value addition is required to classify goods as legitimately Vietnamese. These details are crucial, as they will shape compliance expectations and enforcement frameworks on both sides of the deal.
          Sources familiar with the ongoing discussions indicate that Washington is pushing for Vietnam to localize more production processes and reduce dependency on upstream Chinese inputs. However, without clear value thresholds or finalized timelines, both businesses and regulators are navigating uncertain terrain.

          Vietnam’s Strategic Trade Balancing Act

          Vietnam’s actions illustrate a strategic attempt to preserve trade ties with the US, its largest export market, while carefully managing its industrial dependence on China. This balancing act reflects a broader regional challenge: how to navigate great power rivalries while maintaining export-led economic growth.
          By committing to stronger enforcement, Vietnam seeks to demonstrate alignment with US trade priorities without severing its deeply integrated supply chains with China. Whether these measures will satisfy US regulators or disrupt trade flows remains to be seen, but they mark a clear shift in Vietnam’s trade governance in the face of mounting geopolitical and economic pressure.
          Vietnam’s pending crackdown on trade fraud is not merely regulatory housekeeping it is a political and economic response to the evolving demands of its largest trading partner. As the final terms of the tariff deal remain under negotiation, the success of these reforms will depend on both legal clarity and Vietnam’s capacity to enforce new standards without destabilizing its export-driven economy.

          Source: Reuters

          To stay updated on all economic events of today, please check out our Economic calendar
          Risk Warnings and Disclaimers
          You understand and acknowledge that there is a high degree of risk involved in trading. Following any strategies or investment methods may lead to potential losses. The content on the site is provided by our contributors and analysts for information purposes only. You are solely responsible for determining whether any trading assets, securities, strategy, or any other product is suitable for investing based on your own investment objectives and financial situation.
          Add to Favorites
          Share

          S&P 500 Technical Analysis – Awaiting The US CPI for The Next Major Move

          Blue River

          Stocks

          Technical Analysis

          FundamentalOverview

          The S&P 500 continuesto be supported given the lack of bearish drivers. We haven’t got anymeaningful catalyst since the NFP report other than Trump’s tariff letters thatwere largely ignored by the market given that everyone expects them to be justthe usual negotiating tactic.

          Next week, we have the USCPI report and that could trigger some big moves in the market. To keep thetrend going, we would likely need soft inflation figures as a hot report mighttrigger a deeper pullback given the positioning.

          In the bigger picturethough, given that the Fed's reaction function remains to either wait more orcut, the market should eventually get back to its upward trend.

          S&P 500Technical Analysis – Daily Timeframe

          S&P 500 Daily

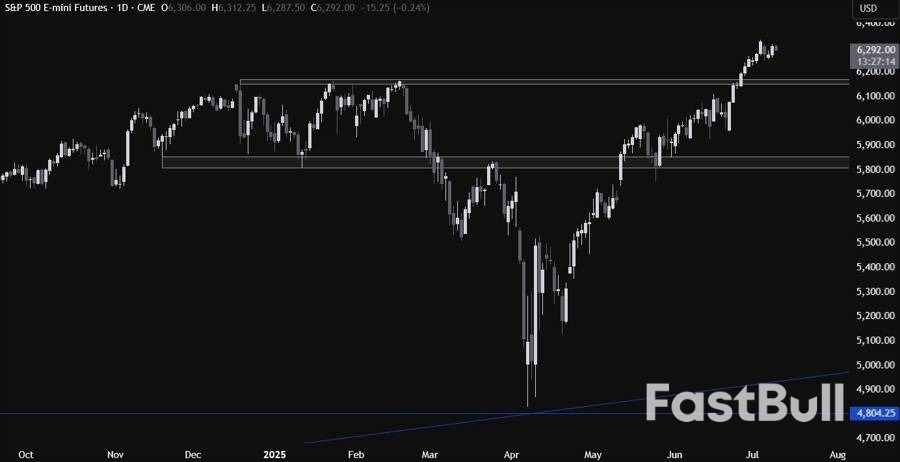
          On the daily chart, we cansee that the S&P 500 is consolidating around the all-time highs after avery strong rally. From a risk management perspective, the buyers will have abetter risk to reward setup around the previous all-time high at 6,160-ishlevel to position for the continuation of the uptrend. The sellers, on theother hand, will want to see the price breaking lower to pile in for a dropinto the 6,000 level next.

          S&P 500 TechnicalAnalysis – 4 hour Timeframe

          S&P 500 4 hour

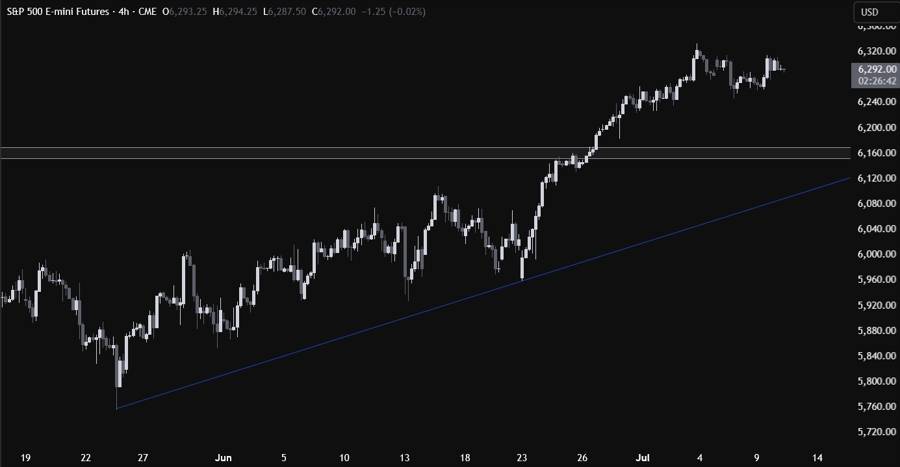
          On the 4 hour chart, we cansee that we have an upward trendline defining the uptrend. If we were toget a pullback all the way into the trendline, we can expect the dip-buyers tolean on it to position for a rally into new all-time highs with a better riskto reward setup. The sellers, on the other hand, will look for a break lower toincrease the bearish bets into the 5,800 level next.

          S&P 500 TechnicalAnalysis – 1 hour Timeframe

          S&P 500 1 hour

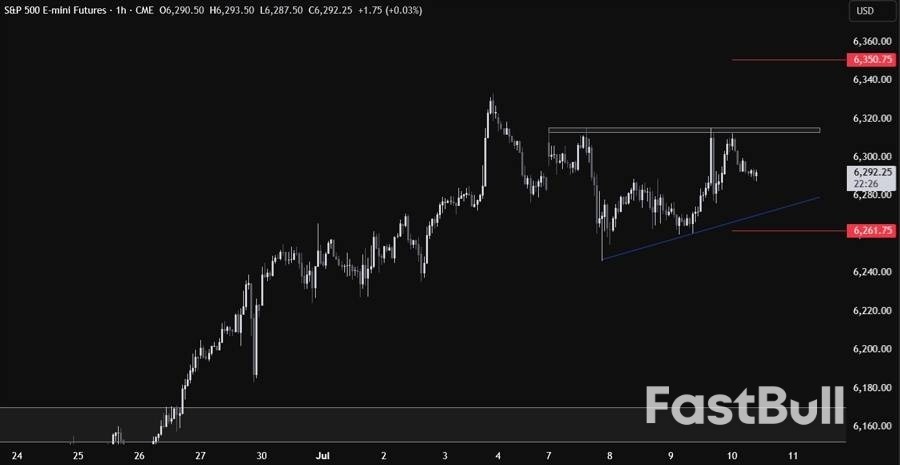
          On the 1 hour chart, we cansee that we have a minor resistance around the 6,315 level. The sellers willlikely continue to step in around the resistance with a defined risk above itto keep targeting a pullback into the 6,160 level. The buyers, on the otherhand, will look for a break higher to increase the bullish bets into newall-time highs.

          There’s also a minor upwardtrendline that can offer support for the dip-buyers, while the sellers willlikely increase the bearish bets into new lows on a breakout. The red linesdefine the average daily range for today.

          Source: ForexLive

          Risk Warnings and Disclaimers
          You understand and acknowledge that there is a high degree of risk involved in trading. Following any strategies or investment methods may lead to potential losses. The content on the site is provided by our contributors and analysts for information purposes only. You are solely responsible for determining whether any trading assets, securities, strategy, or any other product is suitable for investing based on your own investment objectives and financial situation.
          Add to Favorites
          Share
          FastBull
          Copyright © 2025 FastBull Ltd

          728 RM B 7/F GEE LOK IND BLDG NO 34 HUNG TO RD KWUN TONG KLN HONG KONG

          TelegramInstagramTwitterfacebooklinkedin
          App Store Google Play Google Play
          Products
          Charts

          Chats

          Q&A with Experts
          Screeners
          Economic Calendar
          Data
          Tools
          Membership
          Features
          Function
          Markets
          Copy Trading
          Latest Signals
          Contests
          News
          Analysis
          24/7
          Columns
          Education
          Company
          Careers
          About Us
          Contact Us
          Advertising
          Help Center
          Feedback
          User Agreement
          Privacy Policy
          Business

          White Label

          Data API

          Web Plug-ins

          Poster Maker

          Affiliate Program

          Risk Disclosure

          The risk of loss in trading financial instruments such as stocks, FX, commodities, futures, bonds, ETFs and crypto can be substantial. You may sustain a total loss of the funds that you deposit with your broker. Therefore, you should carefully consider whether such trading is suitable for you in light of your circumstances and financial resources.

          No decision to invest should be made without thoroughly conducting due diligence by yourself or consulting with your financial advisors. Our web content might not suit you since we don't know your financial conditions and investment needs. Our financial information might have latency or contain inaccuracy, so you should be fully responsible for any of your trading and investment decisions. The company will not be responsible for your capital loss.

          Without getting permission from the website, you are not allowed to copy the website's graphics, texts, or trademarks. Intellectual property rights in the content or data incorporated into this website belong to its providers and exchange merchants.

          Not Logged In

          Log in to access more features

          FastBull Membership

          Not yet

          Purchase

          Become a signal provider
          Help Center
          Customer Service
          Dark Mode
          Price Up/Down Colors

          Log In

          Sign Up

          Position
          Layout
          Fullscreen
          Default to Chart
          The chart page opens by default when you visit fastbull.com