• Trade
  • Markets
  • Copy
  • Contests
  • News
  • 24/7
  • Calendar
  • Q&A
  • Chats
Trending
Screeners
SYMBOL
LAST
BID
ASK
HIGH
LOW
NET CHG.
%CHG.
SPREAD
SPX
S&P 500 Index
6857.13
6857.13
6857.13
6865.94
6827.13
+7.41
+ 0.11%
--
DJI
Dow Jones Industrial Average
47850.93
47850.93
47850.93
48049.72
47692.96
-31.96
-0.07%
--
IXIC
NASDAQ Composite Index
23505.13
23505.13
23505.13
23528.53
23372.33
+51.04
+ 0.22%
--
USDX
US Dollar Index
98.940
99.020
98.940
99.000
98.740
-0.040
-0.04%
--
EURUSD
Euro / US Dollar
1.16476
1.16485
1.16476
1.16715
1.16408
+0.00031
+ 0.03%
--
GBPUSD
Pound Sterling / US Dollar
1.33447
1.33456
1.33447
1.33622
1.33165
+0.00176
+ 0.13%
--
XAUUSD
Gold / US Dollar
4225.32
4225.73
4225.32
4230.62
4194.54
+18.15
+ 0.43%
--
WTI
Light Sweet Crude Oil
59.355
59.385
59.355
59.543
59.187
-0.028
-0.05%
--

Community Accounts

Signal Accounts
--
Profit Accounts
--
Loss Accounts
--
View More

Become a signal provider

Sell trading signals to earn additional income

View More

Guide to Copy Trading

Get started with ease and confidence

View More

Signal Accounts for Members

All Signal Accounts

Best Return
  • Best Return
  • Best P/L
  • Best MDD
Past 1W
  • Past 1W
  • Past 1M
  • Past 1Y

All Contests

  • All
  • Trump Updates
  • Recommend
  • Stocks
  • Cryptocurrencies
  • Central Banks
  • Featured News
Top News Only
Share

Swiss Federal Council: Committed To Further Improving Access To The US Market

Share

Swiss Federal Council: Prepared To Consider Further Tariff Concessions On Products Originating In The USA, Provided USA Also Willing To Grant More Concessions

Share

Swiss Federal Council: Draft Mandate Will Now Be Consulted With Foreign Policy Committees Of Parliament And Cantons

Share

Swiss Federal Council: Approved The Draft Negotiating Mandate For A Trade Agreement With The US

Share

China's Public Security Ministry Says China, US Anti-Narcotic Teams Held Video Meeting Recently

Share

Argentine Shale Export Deal Includes Initial Volume Of Up To 70000 Barrels/Day, Could Generate Revenues Of $12 Billion Through June 2033

Share

Sources Say German Lawmakers Have Passed A Pension Bill

Share

Russia's Rosatom Discusses With India Possibility Of Localising Production Of Nuclear Fuel For Nuclear Power Plants

Share

Russia Offered India To Localise Production Of Su-57 - Tass Cites Chemezov

Share

Argentina Economy Ministry: Launches 6.50% National Treasury Bond In USA Dollars Maturing On November 30, 2029

Share

Czech Defence Group Csg: Framework Agreement For Period Of 7 Years, Includes Potential Use Of EU's Safe Program

Share

India Aviation Regulator: Committee Shall Submit Its Finding, Recommendation To Regulator Within 15 Days

Share

Brazil October PPI -0.48% From Previous Month

Share

Netflix To Acquire Warner Bros. Following The Separation Of Discovery Global For A Total Enterprise Value Of $82.7 Billion (Equity Value Of $72.0 Billion)

Share

Tass Cites Kremlin: Russia Will Continue Its Actions In Ukraine If Kyiv Refuses To Settle The Conflict

Share

India's Forex Reserves Fall To $686.23 Billion As Of Nov 28

Share

Reserve Bank Of India Says Federal Government Had No Outstanding Loans With It As On Nov 28

Share

Lebanon Says Ceasefire Talks Aim Mainly At Halting Israel's Hostilities

Share

Russia Plans To Boost Oil Exports From Western Ports By 27% In December From November -Sources And Reuters Calculations

Share

Sberbank: Estimated Investment Of $100 Million In Technology, Team Expansion, And New Offices In India

TIME
ACT
FCST
PREV
U.S. Initial Jobless Claims 4-Week Avg. (SA)

A:--

F: --

P: --

U.S. Weekly Continued Jobless Claims (SA)

A:--

F: --

P: --

Canada Ivey PMI (SA) (Nov)

A:--

F: --

P: --

Canada Ivey PMI (Not SA) (Nov)

A:--

F: --

P: --

U.S. Non-Defense Capital Durable Goods Orders Revised MoM (Excl. Aircraft) (SA) (Sept)

A:--

F: --

P: --
U.S. Factory Orders MoM (Excl. Transport) (Sept)

A:--

F: --

P: --

U.S. Factory Orders MoM (Sept)

A:--

F: --

P: --

U.S. Factory Orders MoM (Excl. Defense) (Sept)

A:--

F: --

P: --

U.S. EIA Weekly Natural Gas Stocks Change

A:--

F: --

P: --

Saudi Arabia Crude Oil Production

A:--

F: --

P: --

U.S. Weekly Treasuries Held by Foreign Central Banks

A:--

F: --

P: --

Japan Foreign Exchange Reserves (Nov)

A:--

F: --

P: --

India Repo Rate

A:--

F: --

P: --

India Benchmark Interest Rate

A:--

F: --

P: --

India Reverse Repo Rate

A:--

F: --

P: --

India Cash Reserve Ratio

A:--

F: --

P: --

Japan Leading Indicators Prelim (Oct)

A:--

F: --

P: --

U.K. Halifax House Price Index YoY (SA) (Nov)

A:--

F: --

P: --

U.K. Halifax House Price Index MoM (SA) (Nov)

A:--

F: --

P: --

France Current Account (Not SA) (Oct)

A:--

F: --

P: --

France Trade Balance (SA) (Oct)

A:--

F: --

P: --

France Industrial Output MoM (SA) (Oct)

A:--

F: --

P: --

Italy Retail Sales MoM (SA) (Oct)

A:--

F: --

P: --

Euro Zone Employment YoY (SA) (Q3)

A:--

F: --

P: --

Euro Zone GDP Final YoY (Q3)

A:--

F: --

P: --

Euro Zone GDP Final QoQ (Q3)

A:--

F: --

P: --

Euro Zone Employment Final QoQ (SA) (Q3)

A:--

F: --

P: --

Euro Zone Employment Final (SA) (Q3)

A:--

F: --

P: --
Brazil PPI MoM (Oct)

A:--

F: --

P: --

Mexico Consumer Confidence Index (Nov)

A:--

F: --

P: --

Canada Unemployment Rate (SA) (Nov)

--

F: --

P: --

Canada Labor Force Participation Rate (SA) (Nov)

--

F: --

P: --

Canada Employment (SA) (Nov)

--

F: --

P: --

Canada Part-Time Employment (SA) (Nov)

--

F: --

P: --

Canada Full-time Employment (SA) (Nov)

--

F: --

P: --

U.S. Personal Income MoM (Sept)

--

F: --

P: --

U.S. Dallas Fed PCE Price Index YoY (Sept)

--

F: --

P: --

U.S. PCE Price Index YoY (SA) (Sept)

--

F: --

P: --

U.S. PCE Price Index MoM (Sept)

--

F: --

P: --

U.S. Personal Outlays MoM (SA) (Sept)

--

F: --

P: --

U.S. Core PCE Price Index MoM (Sept)

--

F: --

P: --

U.S. UMich 5-Year-Ahead Inflation Expectations Prelim YoY (Dec)

--

F: --

P: --

U.S. Core PCE Price Index YoY (Sept)

--

F: --

P: --

U.S. Real Personal Consumption Expenditures MoM (Sept)

--

F: --

P: --

U.S. 5-10 Year-Ahead Inflation Expectations (Dec)

--

F: --

P: --

U.S. UMich Current Economic Conditions Index Prelim (Dec)

--

F: --

P: --

U.S. UMich Consumer Sentiment Index Prelim (Dec)

--

F: --

P: --

U.S. UMich 1-Year-Ahead Inflation Expectations Prelim (Dec)

--

F: --

P: --

U.S. UMich Consumer Expectations Index Prelim (Dec)

--

F: --

P: --

U.S. Weekly Total Rig Count

--

F: --

P: --

U.S. Weekly Total Oil Rig Count

--

F: --

P: --

U.S. Consumer Credit (SA) (Oct)

--

F: --

P: --

China, Mainland Foreign Exchange Reserves (Nov)

--

F: --

P: --

China, Mainland Exports YoY (USD) (Nov)

--

F: --

P: --

China, Mainland Imports YoY (CNH) (Nov)

--

F: --

P: --

China, Mainland Imports YoY (USD) (Nov)

--

F: --

P: --

China, Mainland Imports (CNH) (Nov)

--

F: --

P: --

China, Mainland Trade Balance (CNH) (Nov)

--

F: --

P: --

China, Mainland Exports (Nov)

--

F: --

P: --

Japan Wages MoM (Oct)

--

F: --

P: --

Q&A with Experts
    • All
    • Chatrooms
    • Groups
    • Friends
    Connecting
    .
    .
    .
    Type here...
    Add Symbol or Code

      No matching data

      All
      Trump Updates
      Recommend
      Stocks
      Cryptocurrencies
      Central Banks
      Featured News
      • All
      • Russia-Ukraine Conflict
      • Middle East Flashpoint
      • All
      • Russia-Ukraine Conflict
      • Middle East Flashpoint
      Search
      Products

      Charts Free Forever

      Chats Q&A with Experts
      Screeners Economic Calendar Data Tools
      Membership Features
      Data Warehouse Market Trends Institutional Data Policy Rates Macro

      Market Trends

      Market Sentiment Order Book Forex Correlations

      Top Indicators

      Charts Free Forever
      Markets

      News

      News Analysis 24/7 Columns Education
      From Institutions From Analysts
      Topics Columnists

      Latest Views

      Latest Views

      Trending Topics

      Top Columnists

      Latest Update

      Signals

      Copy Rankings Latest Signals Become a signal provider AI Rating
      Contests
      Brokers

      Overview Brokers Assessment Rankings Regulators News Claims
      Broker listing Forex Brokers Comparison Tool Live Spread Comparison Scam
      Q&A Complaint Scam Alert Videos Tips to Detect Scam
      More

      Business
      Events
      Careers About Us Advertising Help Center

      White Label

      Data API

      Web Plug-ins

      Affiliate Program

      Awards Institution Evaluation IB Seminar Salon Event Exhibition
      Vietnam Thailand Singapore Dubai
      Fans Party Investment Sharing Session
      FastBull Summit BrokersView Expo
      Recent Searches
        Top Searches
          Markets
          News
          Analysis
          User
          24/7
          Economic Calendar
          Education
          Data
          • Names
          • Latest
          • Prev

          View All

          No data

          Scan to Download

          Faster Charts, Chat Faster!

          Download App
          English
          • English
          • Español
          • العربية
          • Bahasa Indonesia
          • Bahasa Melayu
          • Tiếng Việt
          • ภาษาไทย
          • Français
          • Italiano
          • Türkçe
          • Русский язык
          • 简中
          • 繁中
          Open Account
          Search
          Products
          Charts Free Forever
          Markets
          News
          Signals

          Copy Rankings Latest Signals Become a signal provider AI Rating
          Contests
          Brokers

          Overview Brokers Assessment Rankings Regulators News Claims
          Broker listing Forex Brokers Comparison Tool Live Spread Comparison Scam
          Q&A Complaint Scam Alert Videos Tips to Detect Scam
          More

          Business
          Events
          Careers About Us Advertising Help Center

          White Label

          Data API

          Web Plug-ins

          Affiliate Program

          Awards Institution Evaluation IB Seminar Salon Event Exhibition
          Vietnam Thailand Singapore Dubai
          Fans Party Investment Sharing Session
          FastBull Summit BrokersView Expo

          Modi, Putin Meet To Deepen Economic Ties Despite US Pressure

          Daniel Carter

          Political

          Summary:

          Indian Prime Minister Modi and Russian President Putin held a bilateral meeting in New Delhi, as the two leaders look to deepen economic cooperation in the face of pressure from US President Donald Trump.

          Indian Prime Minister Narendra Modi and Russian President Vladimir Putin held a bilateral meeting in New Delhi, as the two leaders look to deepen economic cooperation in the face of pressure from US President Donald Trump.
          The meeting on Friday comes a day after Putin's arrival in India — his first to the country since Russia's full-scale invasion of Ukraine — and is expected to showcase the longstanding partnership between the two nations that dates back to the Cold War. Those ties have centered on defense, but Modi and Putin want to broaden cooperation to include deeper trade, migration and economic links.
          During the two-day visit, India and Russia are expected to finalize a mobility agreement that would allow Indian professionals to relocate to Russia, a first for the two countries.
          Also expected is an agreement on the shipment to Russia of Indian marine products and agricultural goods, exports of which have been hit following Trump's 50% tariffs on Indian goods, which took effect Aug. 1.
          Putin is expected to showcase oil and defense ties as well, with officials working to finalize a deal for India to lease a $2 billion submarine from Russia, Bloomberg News reported.
          India's share of Russian imports is now less than 2%. New Delhi and Moscow intend to increase trade to $100 billion by the end of the decade.
          The US doubled tariffs on Indian goods to 50% to punish New Delhi for buying Russian oil and has pressed India to purchase more American weapons. Despite that pressure, Modi's government remains in trade talks with the Trump administration, with a negotiating team from Washington expected in India next week.
          The broadening of ties comes despite heavy criticism from both the US and the European Union, with the meeting underscoring India's eagerness to keep links with traditional partners warm and look for alternate markets to offset US tariffs.
          From direct purchases of military weapons, India and Russia are increasingly moving to joint development and production of weapons, collectively designing and manufacturing missiles and guns.

          Source: Bloomberg Europe

          Risk Warnings and Disclaimers
          You understand and acknowledge that there is a high degree of risk involved in trading. Following any strategies or investment methods may lead to potential losses. The content on the site is provided by our contributors and analysts for information purposes only. You are solely responsible for determining whether any trading assets, securities, strategy, or any other product is suitable for investing based on your own investment objectives and financial situation.
          Add to Favorites
          Share

          Asian Markets Mixed as Investors Eye Fed Rate Decision, China Data, and Inflation Signals

          Gerik

          Economic

          Stocks

          Asian Equities Drift Amid Global Uncertainty and Data-Driven Caution

          Asian markets ended the week on a mixed note, reflecting broader global investor caution ahead of key inflation data in the U.S. and high-level economic meetings in China. While U.S. equity indices hovered near all-time highs, risk appetite in Asia was restrained by soft economic prints from Japan and uncertainty over the Federal Reserve’s policy path.
          Japan’s Nikkei 225 reversed previous gains, falling 1.2% to 50,408.70 after government data revealed a sharper-than-expected 3.0% year-on-year drop in household spending for October the steepest since January 2024. The contraction signals weakening consumer sentiment, which weighed heavily on technology shares. Advantest Corp. lost 2.3% while Tokyo Electron slipped 2.8%, reflecting broader pessimism in Japan’s tech sector.
          The underlying cause appears linked to a combination of stagnant wage growth and elevated living costs, both of which have constrained domestic demand despite moderate GDP growth. Weak consumption remains a structural drag on Japan’s recovery, reinforcing the case for careful coordination between fiscal and monetary policy.

          Diverging Market Performance Across the Region

          In China, the Hang Seng Index dipped 0.1% to 25,921.69, while the Shanghai Composite rose modestly by 0.1% to 3,877.83. Traders remained subdued ahead of key macro data releases next week, including inflation, trade balances, and producer prices. Market participants are also awaiting policy cues from upcoming Communist Party economic meetings, as Beijing crafts its post-COVID growth strategy.
          Meanwhile, South Korea’s Kospi gained 1.1% to 4,074.00, led by sharp rebounds in blue chips like LG Electronics (+5.6%) and Hyundai Motors (+7.2%). The rally was largely sentiment-driven, with analysts pointing to improved forward earnings projections and easing export bottlenecks as possible catalysts. This localized rebound, however, remains decoupled from broader regional caution and illustrates the country’s tech-heavy resilience amid global supply chain normalization.
          Australia’s S&P/ASX200 edged up less than 0.1% to 8,623.40, mirroring the general lack of directional conviction. Taiwan’s Taiex was also virtually unchanged, highlighting overall hesitation across developed Asia-Pacific markets.

          India’s Rate Cut Adds to Mixed Signals in the Region

          India’s Sensex added a modest 0.1% following the Reserve Bank of India’s (RBI) decision to cut its benchmark repo rate to 5.25%. The rate cut delivered despite stronger-than-expected GDP growth signaled a forward-looking stance to cushion potential future slowdowns, particularly in trade-sensitive sectors affected by U.S. tariffs.
          While the move supports domestic credit conditions, it also reinforces market concerns about weakening demand fundamentals in Asia’s third-largest economy. The RBI's liquidity injection into the banking system suggests an effort to stimulate lending and offset the subdued export environment.

          Wall Street Inches Up as Inflation Data Looms

          In the U.S., the S&P 500 rose slightly by 0.1% to 6,857.12 just 0.5% below its all-time high while the Nasdaq gained 0.2% and the Dow Jones slipped by 0.1%. Market sentiment remains buoyed by expectations of another Fed rate cut next week, which would be the third in 2025.
          However, better-than-expected labor market data such as a drop in jobless claims to a three-year low and a sharp decline in announced layoffs dented the certainty of rate cuts. While strong job numbers are positive for households, they signal to the Fed that the labor market may not need immediate support, potentially delaying the easing cycle.
          This dynamic reflects a classic policy trade-off: easing rates would support equities and borrowing, but could also stoke inflation, which remains above the Fed’s 2% target.

          Commodities and Currency Markets Show Limited Movement

          In commodities, U.S. crude futures eased slightly by 17 cents to $59.50 per barrel, while Brent crude edged down 11 cents to $63.15. Oil prices remain subdued amid concerns over global oversupply and mixed geopolitical developments, including uncertainty over the Ukraine ceasefire and OPEC’s output policy.
          On the currency front, the dollar weakened slightly against the Japanese yen, trading at 154.77, down from 155.12. The euro inched up to $1.1657. These movements were minor but reflect broader positioning ahead of major central bank decisions and inflation readings in both the U.S. and Europe.

          Regional Markets Wait for Clear Signals

          Asian financial markets are in a holding pattern, reflecting a blend of cautious optimism and policy uncertainty. While Wall Street’s resilience offers a supportive backdrop, investors across Asia are largely focused on domestic data, upcoming inflation prints, and central bank guidance.
          Whether the Fed moves forward with another rate cut and how China signals its 2026 growth priorities will likely set the tone for the next wave of asset reallocation across global markets. Until then, Asian equities may remain directionless, with isolated sectoral gains unable to mask broader investor hesitation.

          Source: AP

          To stay updated on all economic events of today, please check out our Economic calendar
          Risk Warnings and Disclaimers
          You understand and acknowledge that there is a high degree of risk involved in trading. Following any strategies or investment methods may lead to potential losses. The content on the site is provided by our contributors and analysts for information purposes only. You are solely responsible for determining whether any trading assets, securities, strategy, or any other product is suitable for investing based on your own investment objectives and financial situation.
          Add to Favorites
          Share

          Indian Rupee Weakens After RBI Rate Cut Despite Strong Growth, Tariff Pressures Persist

          Gerik

          Economic

          Forex

          Rupee Retreats Post-Rate Decision as Growth-Inflation Trade-Off Resurfaces

          India’s central bank delivered a 25 basis-point policy rate cut on Friday, as expected by a majority of economists, but the rupee reacted negatively, retreating from 89.78 to 89.92 against the dollar shortly after the announcement. This move reflects both the market's sensitivity to monetary easing and lingering concerns over India’s external sector vulnerabilities.
          Despite stronger-than-expected GDP growth of 8.2% in the July–September quarter, which had tempered expectations of immediate easing for some analysts, the Reserve Bank of India (RBI) proceeded with the cut. The move aims to reinforce momentum in what Governor Sanjay Malhotra described as a "goldilocks economy" characterized by robust growth and subdued inflation but currency markets interpreted it as a dovish signal amid fragile trade dynamics.

          External Pressures Weigh on Currency Performance

          The rupee has depreciated roughly 5% year-to-date, making it the weakest-performing currency in Asia in 2025. This decline is causally linked to a combination of deteriorating trade balances, sluggish capital inflows, and mounting tariff barriers, particularly from the U.S.
          The impact of these tariffs most notably the 50% duties imposed by the Trump administration on Indian exports has deepened India's current account concerns. With outbound shipments to the U.S. declining for consecutive months and overall export values falling, the trade deficit has widened, exacerbating pressure on the rupee.
          The RBI's rate cut, while supportive of domestic credit and liquidity, risks further dampening foreign investor appetite for rupee-denominated assets, especially amid global yield competition and a still-strong U.S. dollar.

          Liquidity Measures May Offer Domestic Support, Not FX Relief

          In addition to the rate cut, the central bank also announced steps to improve banking sector liquidity. These include easing reserve norms and increasing liquidity windows to ensure adequate credit flow. While these measures may support economic activity and help banks expand lending, they are unlikely to stem the rupee’s decline unless accompanied by stronger capital inflows or export recovery.
          The immediate market response wherein the rupee weakened despite an expected policy decision reflects concerns that macro-level interventions are not sufficiently addressing structural external imbalances. Investors remain cautious as the currency continues to test psychological resistance levels near the 90-per-dollar mark.

          Policy Tailwinds for Growth, But Currency Risks Persist

          India’s monetary easing reinforces its growth-supportive stance, especially amid favorable inflation data and solid GDP expansion. However, the rupee’s continued depreciation highlights unresolved external sector fragilities particularly the impact of U.S. trade policy and muted global demand.
          As long as trade imbalances and capital flow challenges persist, the rupee will remain vulnerable, even in the context of a growing domestic economy. The RBI faces a delicate balancing act: supporting growth without undermining currency stability a challenge made more acute by global monetary tightening and trade protectionism.

          Source: Reuters

          To stay updated on all economic events of today, please check out our Economic calendar
          Risk Warnings and Disclaimers
          You understand and acknowledge that there is a high degree of risk involved in trading. Following any strategies or investment methods may lead to potential losses. The content on the site is provided by our contributors and analysts for information purposes only. You are solely responsible for determining whether any trading assets, securities, strategy, or any other product is suitable for investing based on your own investment objectives and financial situation.
          Add to Favorites
          Share

          Japan’s Finance Minister Signals Unity with BOJ as Markets Brace for Potential Rate Hike

          Gerik

          Economic

          Finance-Governor Coordination Suggests Policy Alignment

          Japanese Finance Minister Satsuki Katayama emphasized a constructive working relationship with BOJ Governor Kazuo Ueda, noting “very good” communication since assuming office in October. Speaking at a routine press conference on Friday, Katayama reiterated that the specifics of monetary operations remain under the purview of the central bank, but her tone suggested strong institutional alignment.
          This message comes at a critical time: markets expect the BOJ to raise interest rates soon, and Katayama’s remarks signal that such a move would not face resistance from the fiscal authorities. The comment reflects more than diplomatic cordiality, it suggests a deliberate effort to reduce friction between monetary tightening and fiscal strategy, especially as Japan exits years of ultra-loose monetary policy.

          Bond Yields Climb Amid Fiscal Stimulus and Rate Expectations

          The 10-year Japanese government bond (JGB) yield climbed to 1.94% on Friday, the highest level since July 2007. This surge reflects investor concern over the dual pressures of rising interest rates and expansive fiscal policy under Prime Minister Sanae Takaichi’s stimulus agenda. The stimulus, which is expected to be financed primarily through new borrowing, has reignited fears over Japan’s already-heavy debt load.
          The market’s response is not coincidental, it is causally linked to the perceived lack of synchronization between increased spending and looming monetary tightening. However, Katayama attempted to counter this narrative by underscoring the government’s commitment to fiscal responsibility. She affirmed that the recently announced supplementary budget was formulated “with sustainability in mind,” and that similar discipline will guide the FY2026 budget process.

          Balancing Fiscal Ambition with Market Confidence

          Katayama also acknowledged recent volatility in the bond market, stating that the government would closely monitor developments and maintain dialogue with market participants to safeguard confidence. Her comments reflect growing awareness that policy credibility is now under scrutiny, not just from domestic investors but also from global markets that track Japan’s fiscal-monetary dynamics closely.
          The challenge lies in maintaining a delicate balance: the government must stimulate growth while avoiding destabilization of its bond market, especially as the BOJ signals an end to its yield curve control (YCC) framework and moves toward normalization.

          Subtle Shift Toward Policy Coordination in Post-Yield Curve Control Era

          As Japan approaches a likely interest rate hike, Katayama’s comments serve to pre-empt market volatility and reinforce a narrative of institutional coordination. The message is clear: while the BOJ remains independent, the Ministry of Finance is prepared to cooperate in navigating Japan’s transition out of ultra-loose policy.
          With bond yields climbing and debt-funded stimulus in motion, the path ahead will test both monetary flexibility and fiscal restraint. The early signals from Katayama’s tenure suggest that policymakers are aware of these pressures and are actively working to present a unified front crucial for sustaining confidence in Japan’s policy credibility during a period of historic transition.

          Source: Reuters

          To stay updated on all economic events of today, please check out our Economic calendar
          Risk Warnings and Disclaimers
          You understand and acknowledge that there is a high degree of risk involved in trading. Following any strategies or investment methods may lead to potential losses. The content on the site is provided by our contributors and analysts for information purposes only. You are solely responsible for determining whether any trading assets, securities, strategy, or any other product is suitable for investing based on your own investment objectives and financial situation.
          Add to Favorites
          Share

          China’s Housing Market to Extend Downturn Through 2026 Amid Structural Drags and Tepid Policy Response

          Gerik

          Economic

          Home Prices Slide as Structural Pressures Persist

          China’s real estate sector remains mired in prolonged weakness, with average home prices expected to fall by 3.7% in 2025, according to a Reuters survey conducted between November 17 and December 3. This extends the market’s decline from previous years, reflecting enduring structural challenges. Forecasts for 2026 have been revised downward as well, with prices now expected to contract another 2.8% a sharper drop than the 0.5% previously projected. The market is now anticipated to stabilize only in 2027, and even then, prices are forecast to stay flat, rather than recover.
          This continuous decline reflects a causal dynamic driven by deep-seated issues: overbuilt housing stock, weak consumer confidence, unfavorable demographics, and tight labor market conditions. The property market’s trajectory is no longer shaped by cyclical fluctuations alone but by structural dislocations that have yet to be meaningfully addressed by Beijing’s policy apparatus.

          Policy Responses Remain Inadequate Amid Mounting Risks

          Despite a series of modest policy efforts including mortgage rate cuts and regulatory easing Chinese authorities have so far refrained from launching large-scale stimulus to absorb excess housing inventory or rescue heavily indebted developers. Analysts, including Zichun Huang from Capital Economics, argue that while a significant government intervention could engineer a temporary rebound, there is little evidence to suggest policymakers are prepared to take such steps.
          Instead, housing support continues to underwhelm, especially in the face of a deepening supply glut. Fitch Ratings’ Lulu Shi highlights that structural headwinds such as falling birth rates, job insecurity, and affordability constraints continue to weigh down demand, amplifying the downward pressure on prices. These factors collectively create a feedback loop, where price declines dampen sentiment, reducing buying activity and extending the cycle of market stagnation.
          This reveals a causal pattern: without substantial fiscal support or demand-side recovery, housing prices are unlikely to find a floor. Supply-side excess alone is now sufficient to depress valuations, even as other economic indicators attempt to stabilize.

          Investment and Sales Slump Reflects Broader Sectoral Weakness

          Beyond price pressures, the Reuters poll also revealed that property investment is expected to decline by 15% in 2025, while sales may drop by 8% steeper than prior forecasts. These figures indicate that developers are not only facing financing constraints but also a loss of operational viability as unsold inventory mounts and buyer interest fades.
          The downturn in investment is both a symptom and a cause of weaker market confidence. Developers scaling back projects to preserve cash flow are reinforcing the perception that the market lacks direction. Simultaneously, sales declines reflect both a drop in effective demand and a growing perception among consumers that waiting may yield better value, which perpetuates the slump.
          This cycle of falling prices, reduced investment, and waning sales underscores the sector’s ongoing contraction. Without stronger macroeconomic stimulus or confidence-building reforms, these trends are likely to persist well into 2026.

          Downside Risks: Mortgage Stress and Negative Equity

          Looking ahead, the outlook could worsen if macroeconomic support fails to materialize. Fitch’s Shi warns that falling prices may push more homeowners into negative equity, potentially triggering a rise in mortgage delinquencies and wider financial instability. This scenario would pose risks not just to the real estate sector but to the banking system and broader consumer spending.
          Such risks underscore the urgency of a coordinated policy approach that goes beyond piecemeal real estate measures. Structural reforms to labor markets, income distribution, and social safety nets may be necessary to rebuild the foundation for long-term housing demand.

          Stabilization Unlikely Before 2027 Without Bolder Action

          China’s housing market remains on a multi-year downward path, with no recovery in sight before 2027. The causes are deeply structural, and current policy responses have not proven sufficient to restore confidence or absorb oversupply. The decline in prices, investment, and sales reflects more than just post-COVID turbulence it signals a sector grappling with a long-term reset.
          Unless Beijing shifts toward a more aggressive, coordinated stimulus strategy, the risk of continued price deflation, investment stagnation, and financial stress will remain elevated. For now, the sector’s trajectory continues to point downward, with stabilization still two years away and a full recovery dependent on broader economic transformation.

          Source: Reuters

          To stay updated on all economic events of today, please check out our Economic calendar
          Risk Warnings and Disclaimers
          You understand and acknowledge that there is a high degree of risk involved in trading. Following any strategies or investment methods may lead to potential losses. The content on the site is provided by our contributors and analysts for information purposes only. You are solely responsible for determining whether any trading assets, securities, strategy, or any other product is suitable for investing based on your own investment objectives and financial situation.
          Add to Favorites
          Share

          USD Rebounds: Technical Overview For EUR/USD, USD/CAD And USD/CHF

          MarketPulse by OANDA Group

          Forex

          Technical Analysis

          Despite a rough monthly open, the US Dollar is currently trading within a key technical range, a factor that holds FX Markets firmly in balance despite some individual breakouts seen in pairs like NZD/USD or GBP/USD.

          As is often the case ahead of pivotal events like the FOMC, the Dollar may test relative extremes, but it rarely poses definitive breakout situations.

          The best example of this was ahead of the September Fed Meeting, where the Dollar rushed to make new lows but was inevitably constrained by the bounds of its previous yearly support zones.

          The catalyst for the current downside came from NY Fed President John Williams' speech on November 21, which fundamentally shook markets by reintroducing rate cut hopes.

          His dovish comments took the 25 basis point cut pricing from 20% all the way to the current stable 87%. This rapid repricing triggered a swift selloff in the Dollar over the past two weeks of trading.

          Dollar Index (DXY) 8H Chart. December 4, 2025– Source: TradingView

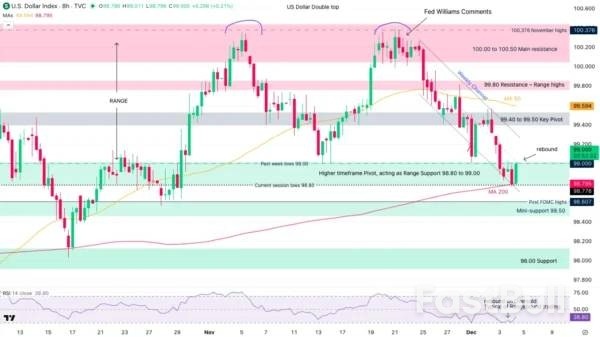
          But, as mentioned in our recent in-depth analysis of the Greenback, the Dollar Index is still maintaining a broad range on the bigger picture, having tested its 200-period Moving Average (and range lows) and currently bouncing above 99.00.

          The range highs on the Dollar Index is located at the 100.00 level.

          Today, we will look at three key FX Majors and their intraday timeframes to see how the range in the Dollar Index affects their own currency pairs: EUR/USD, USD/CHF, and USD/CAD.

          EUR/USD 8H Chart and Technical Levels

          EUR/USD 8H Chart. December 4, 2025– Source: TradingView

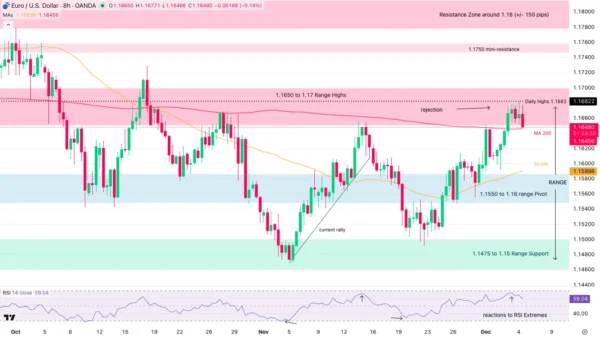
          As mentioned in our November 25 post (On the US Dollar rejecting its range highs), EUR/USD is maintaining a wide Range between 1.15 to 1.17.

          As often, the range gets confirmed with:

          · Rejection of price after reaching overbought/oversold levels in the RSI
          · Flatlining Moving Averages, particularly the MA 200

          Currently rejecting its highs, the current setup is one of a sell with a potential stop at range extremes (Above 1.17).

          Sellers are currently pushing below the 200-period Moving Average (1.16455), the rejection confirms with a 1H Close below.

          Levels of interest for EUR/USD Trading

          Resistance levels

          · 1.1630 to 1.1670 Pivot zone (range Highs)
          · 1.1750 mini-resistance
          · Resistance Zone around 1.18 (+/- 150 pips)
          · Sep 2021 Highs – Resistance 1.19 to 1.1950 Zone
          · Weekly highs 1.1656

          Support levels

          · 1.1470 to 1.15 range support
          · 4H MA 200 Mini-support 1.16190
          · 1.1475 to 1.15 Support Zone
          · 1.1350 to 1.14 Support
          · Session lows 1.14966

          USD/CAD 8H Chart and Technical Levels

          USD/CAD 8H Chart. December 4, 2025– Source: TradingView

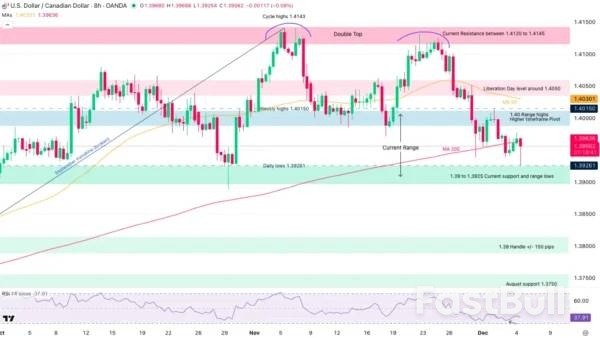
          The rangebound characteristics of USD/CAD are less obvious, but taking a step back, the North American pair has stopped trending since reaching its November and cycle highs.

          Holding firmly between 1.39 and 1.40, the currency pair has been seesawing within the 1,000 pip range since the final days of November.

          With traders not knowing what to do with the US-Canada deal (it seems like the Canadian government also doesn't know), rangebound conditions also make fundamental sense.

          In the case of a break, watch for a daily close above or below to avoid getting trapped.

          Note to traders that news on a trade-deal might move things in a flash.

          Levels of interest for USD/CAD Trading

          Resistance Levels

          · 1.40 Major Pivot acting as resistance
          · Cycle highs 1.4143 and Double top
          · Resistance between 1.4120 to 1.4145
          · Key resistance 1.4250

          Support Levels

          · 1.39 to 1.3925 Higher timeframe pivot, current support
          · 1.38 Major support +/- 150 pips
          · August range support 1.3750
          · 1.3550 Main 2025 Support

          USD/CHF 8H Chart and Technical Levels

          USD/CHF 8H Chart. December 4, 2025– Source: TradingView

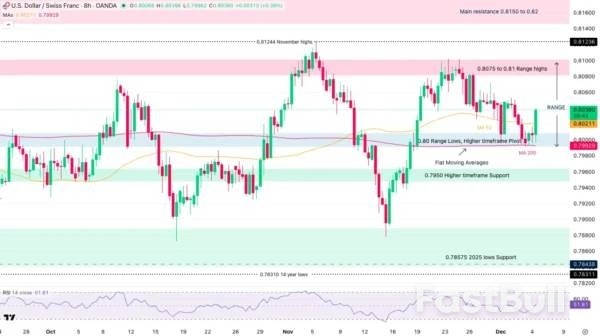
          USD/CHF is also stuck within two ranges – A large half-year range between 0.7850 to 0.8140 and another, smaller one but more active: 0.80 to 0.81

          We will focus on the smaller timeframe consolidation, also 1,000 pip large.

          Buyers are stepping in from the 0.80 Zone after bouncing on the 200-period Moving Average (1.79930).

          The current candle is strong, with the ongoing rebound in the USD.

          Check out reactions at the highs of the range.

          Levels of interest for USD/CHF Trading

          Resistance levels

          · 0.8075 to 0.81 Range highs
          · 0.81244 November highs
          · Main resistance 0.8150 to 0.82
          · 0.82144 June Highs

          Support levels

          · 0.80 Range Lows, Higher timeframe Pivot
          · 0.7950 Higher timeframe Support
          · 0.78575 2025 lows support

          Source: MarketPulse by OANDA Group

          Risk Warnings and Disclaimers
          You understand and acknowledge that there is a high degree of risk involved in trading. Following any strategies or investment methods may lead to potential losses. The content on the site is provided by our contributors and analysts for information purposes only. You are solely responsible for determining whether any trading assets, securities, strategy, or any other product is suitable for investing based on your own investment objectives and financial situation.
          Add to Favorites
          Share

          Putin’s India Visit Aims to Deepen Strategic Ties as Trade Balancing Act Intensifies

          Gerik

          Economic

          Summit Signals Resilience in Russia–India Strategic Partnership

          Russian President Vladimir Putin arrived in New Delhi for a high-level summit with Indian Prime Minister Narendra Modi, marking his first visit to India in four years. The visit underscores Moscow’s efforts to reinforce its strategic relationship with New Delhi as Western sanctions, particularly from the U.S. and Europe, continue to limit Russia’s global trade options.
          At the heart of this visit is a concerted push to increase bilateral trade, which Russia hopes to elevate to $100 billion by 2030. Currently, the trade balance heavily favors Moscow due to India’s large-scale imports of discounted Russian crude oil since the onset of the Ukraine conflict. In response, Russia is now seeking to import more Indian goods in an effort to rebalance the trade flow.
          The bilateral summit reflects a causal strategy: Russia’s energy isolation in the West has elevated India’s role as a critical buyer, while India is leveraging this position to strengthen defense partnerships and push for favorable terms in its own trade negotiations.

          Navigating the U.S.–Russia Tightrope

          India’s position is increasingly complex. While Washington remains a key strategic and economic partner, recent tensions have emerged over India’s energy trade with Russia. The Trump administration re-imposed punitive tariffs on Indian goods earlier this year in response to India’s growing imports of Russian oil, complicating New Delhi’s desire to maintain balanced relations with both major powers.
          As noted by Michael Kugelman of the Atlantic Council, India faces a diplomatic “conundrum”: deepening its engagement with either Moscow or Washington risks straining ties with the other. This is not merely a correlation of tensions it reflects a causal dilemma driven by overlapping geopolitical and economic priorities.
          Modi’s warm personal reception of Putin, including a red carpet welcome and private dinner at his residence, signals India’s intent to maintain its long-standing strategic ties with Russia, even while continuing trade negotiations with the U.S.

          Defense and Civil Nuclear Cooperation Take Center Stage

          Defense remains a cornerstone of the Russia–India partnership. Russia has long been India’s largest arms supplier, and this visit featured renewed discussions on defense industrial collaboration. Russian Defence Minister Andrei Belousov met with Indian counterpart Rajnath Singh, offering support for India’s self-reliance goals in domestic weapons production.
          This is a strategic alignment that serves both nations: Russia seeks stable defense export markets amid sanctions, while India is accelerating its “Make in India” agenda for defense modernization. The result is a mutually reinforcing relationship with high stakes in security and industrial development.
          Additionally, civil nuclear energy and labor agreements are reportedly on the agenda, with announcements of new deals expected, highlighting the multifaceted nature of the partnership.

          Geopolitics: India’s Diplomatic Neutrality and Strategic Hedging

          Putin’s visit follows inconclusive discussions with U.S. envoys over the Ukraine conflict. India has maintained a policy of neutrality, refusing to directly condemn Russia’s invasion while advocating for peace through diplomacy. This stance reflects India’s geopolitical strategy of “multi-alignment,” aiming to preserve flexibility and autonomy in a polarized international environment.
          India has criticized Western double standards, noting that some countries continue economic engagements with Moscow when it suits their interests, even while pressuring others to cut ties. This critique strengthens India’s justification for sustaining its Russia relationship.

          Strategic Diversification or Strategic Tightrope?

          Putin’s summit with Modi is more than a ceremonial visit it is a reaffirmation of strategic intent between two nations facing distinct but overlapping pressures. Russia seeks to circumvent isolation by expanding ties with cooperative partners, while India walks a tightrope between great powers to preserve its autonomy.
          Whether India can continue to balance these relationships without diplomatic fallout remains an open question. What is clear, however, is that the India–Russia axis remains resilient, adaptive, and central to the evolving power dynamics of Eurasia in a sanctions-era world.

          Source: Reuters

          To stay updated on all economic events of today, please check out our Economic calendar
          Risk Warnings and Disclaimers
          You understand and acknowledge that there is a high degree of risk involved in trading. Following any strategies or investment methods may lead to potential losses. The content on the site is provided by our contributors and analysts for information purposes only. You are solely responsible for determining whether any trading assets, securities, strategy, or any other product is suitable for investing based on your own investment objectives and financial situation.
          Add to Favorites
          Share
          FastBull
          Copyright © 2025 FastBull Ltd

          728 RM B 7/F GEE LOK IND BLDG NO 34 HUNG TO RD KWUN TONG KLN HONG KONG

          TelegramInstagramTwitterfacebooklinkedin
          App Store Google Play Google Play
          Products
          Charts

          Chats

          Q&A with Experts
          Screeners
          Economic Calendar
          Data
          Tools
          Membership
          Features
          Function
          Markets
          Copy Trading
          Latest Signals
          Contests
          News
          Analysis
          24/7
          Columns
          Education
          Company
          Careers
          About Us
          Contact Us
          Advertising
          Help Center
          Feedback
          User Agreement
          Privacy Policy
          Business

          White Label

          Data API

          Web Plug-ins

          Poster Maker

          Affiliate Program

          Risk Disclosure

          The risk of loss in trading financial instruments such as stocks, FX, commodities, futures, bonds, ETFs and crypto can be substantial. You may sustain a total loss of the funds that you deposit with your broker. Therefore, you should carefully consider whether such trading is suitable for you in light of your circumstances and financial resources.

          No decision to invest should be made without thoroughly conducting due diligence by yourself or consulting with your financial advisors. Our web content might not suit you since we don't know your financial conditions and investment needs. Our financial information might have latency or contain inaccuracy, so you should be fully responsible for any of your trading and investment decisions. The company will not be responsible for your capital loss.

          Without getting permission from the website, you are not allowed to copy the website's graphics, texts, or trademarks. Intellectual property rights in the content or data incorporated into this website belong to its providers and exchange merchants.

          Not Logged In

          Log in to access more features

          FastBull Membership

          Not yet

          Purchase

          Become a signal provider
          Help Center
          Customer Service
          Dark Mode
          Price Up/Down Colors

          Log In

          Sign Up

          Position
          Layout
          Fullscreen
          Default to Chart
          The chart page opens by default when you visit fastbull.com