Markets
News
Analysis
User
24/7
Economic Calendar
Education
Data
- Names
- Latest
- Prev


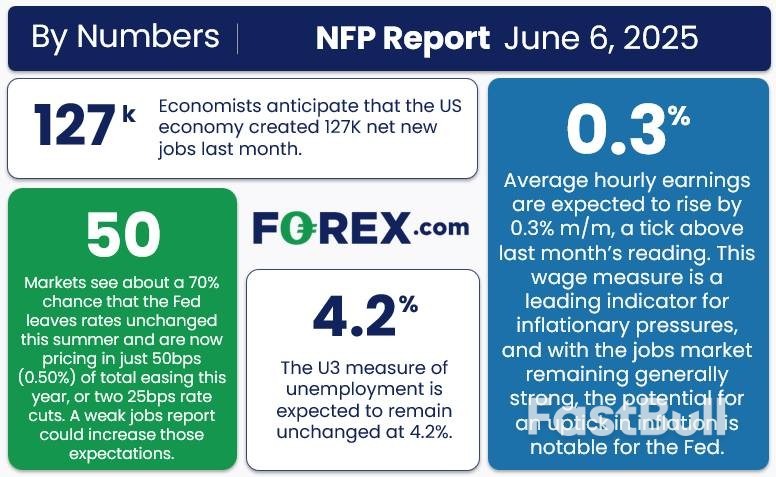
Headline nonfarm payrolls rose by +139k last month, modestly aboveh consensus estimates for a +125k increase, but well within the tighter than usual forecast range of +75k to 190k.
Headline nonfarm payrolls rose by +139k last month, modestly aboveh consensus estimates for a +125k increase, but well within the tighter than usual forecast range of +75k to 190k. Simultaneously, the prior two payrolls prints were revised by a sizeable net -95k, in turn taking the 3-month average of job gains to +135k, still considerably above the breakeven pace

Digging a little deeper into the payrolls print, job gains were relatively broad-based, though for the second month running Education led the way, closely followed by Leisure & Hospitality, while on the flip side Professional & Business Services, Manufacturing, and Mining & Logging were the only sectors seeing MoM declines in employment.

Sticking with the establishment survey, the jobs report once again pointed to earnings pressures remaining contained. Average hourly earnings rose 0.4% MoM, a touch hotter than expected, which in turn saw the annual rate also tick higher, to 3.9% YoY.
Data of this ilk continues to reinforce the FOMC's now-familiar view that the labour market is not a source of significant upside inflation risks at the current juncture. Those risks, though, are obviously still present, stemming primarily from President Trump's tariff policies, even if said price pressures are likely to prove temporary in nature.

Turning to the household survey, unemployment held steady at 4.2%, in line with expectations, though labour force participation surprisingly dipped to 62.4%, below the bottom of the forecast range.
As has been the case for some time, however, some degree of caution is required in interpreting this data, which has been unusually volatile this cycle, as the BLS continue to grapple with falling survey response rates, and the rapidly changing composition of the labour force.

As the jobs report was digested, money markets, per the USD OIS curve, underwent a very marginal dovish repricing, continuing to fully discount the next 25bp cut for October, but now pricing around 48bp of easing by year-end, compared to 53bp pre-release.

Zooming out, it's difficult to imagine the May jobs report significantly shifting the outlook from a monetary policy perspective. For the time being, the FOMC remain firmly in ‘wait and see' mode, buying time to assess the impact of tariffs, plus the associated policy uncertainty, and how this shifts the balance of risks to either side of the dual mandate. Furthermore, policymakers are also seeking to ensure that inflation expectations remain well-anchored, in spite of any transitory tariff-related price pressures.
Consequently, Powell & Co, who enter the pre-meeting ‘blackout' period at close of play today, are likely to remain on the sidelines for the time being. Though the direction of travel for rates clearly is still lower, the prospect of a rate cut before Q4 remains a long shot.
728 RM B 7/F GEE LOK IND BLDG NO 34 HUNG TO RD KWUN TONG KLN HONG KONG


The risk of loss in trading financial instruments such as stocks, FX, commodities, futures, bonds, ETFs and crypto can be substantial. You may sustain a total loss of the funds that you deposit with your broker. Therefore, you should carefully consider whether such trading is suitable for you in light of your circumstances and financial resources.
No decision to invest should be made without thoroughly conducting due diligence by yourself or consulting with your financial advisors. Our web content might not suit you since we don't know your financial conditions and investment needs. Our financial information might have latency or contain inaccuracy, so you should be fully responsible for any of your trading and investment decisions. The company will not be responsible for your capital loss.
Without getting permission from the website, you are not allowed to copy the website's graphics, texts, or trademarks. Intellectual property rights in the content or data incorporated into this website belong to its providers and exchange merchants.
Not Logged In
Log in to access more features

FastBull Membership
Not yet
Purchase


Log In
Sign Up


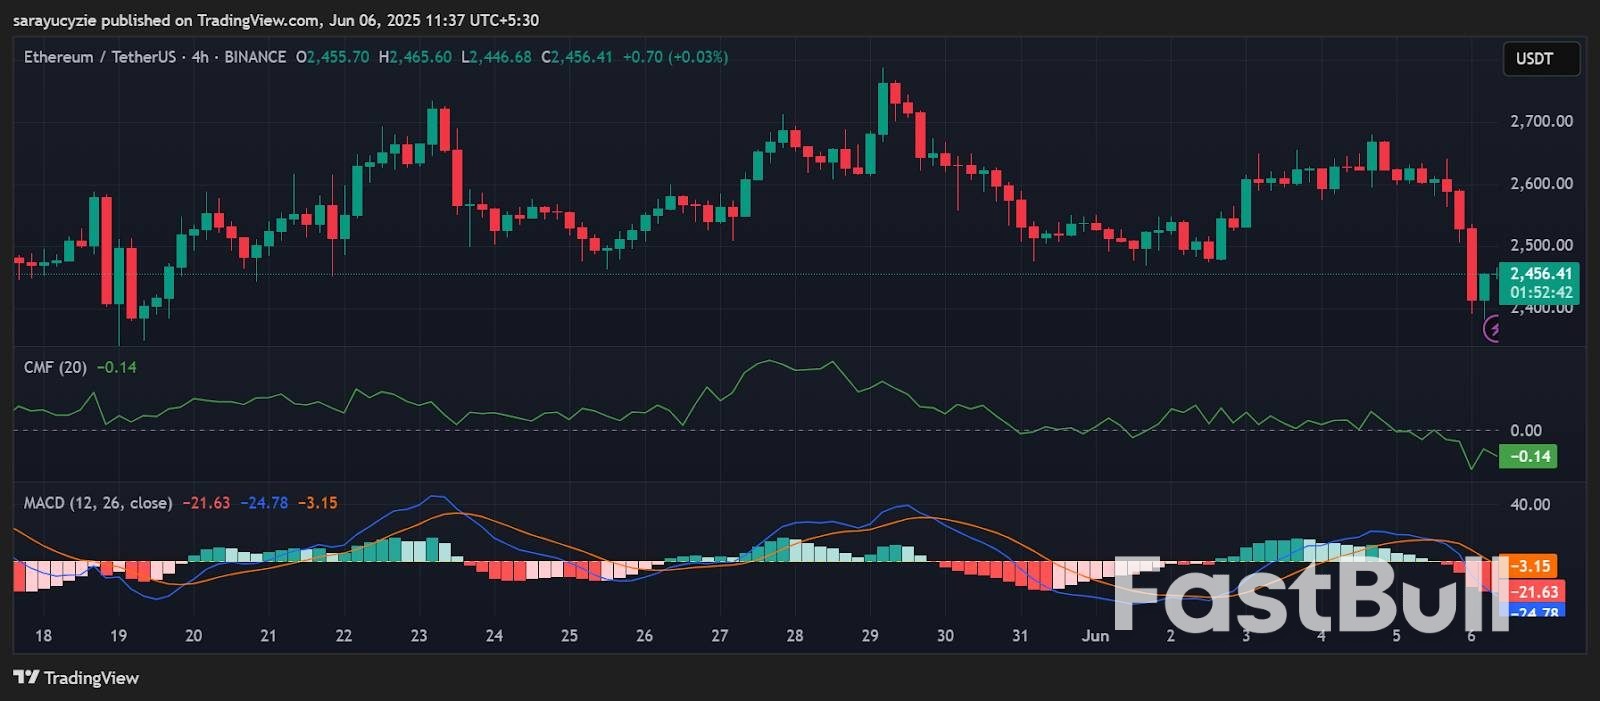 ETH chart (Source: