

Markets
News
Analysis
User
24/7
Economic Calendar
Education
Data
- Names
- Latest
- Prev


Signal Accounts for Members
All Signal Accounts
All Contests
 U.K. Trade Balance Non-EU (SA) (Oct)
A:--
F: --
P: --
U.K. Trade Balance (Oct)A:--
F: --
P: --
U.K. Services Index MoMA:--
F: --
P: --
U.K. Construction Output MoM (SA) (Oct)A:--
F: --
P: --
U.K. Industrial Output YoY (Oct)A:--
F: --
P: --
U.K. Trade Balance (SA) (Oct)A:--
F: --
P: --
U.K. Trade Balance EU (SA) (Oct)A:--
F: --
P: --
U.K. Manufacturing Output YoY (Oct)A:--
F: --
P: --
U.K. GDP MoM (Oct)A:--
F: --
P: --
U.K. GDP YoY (SA) (Oct)A:--
F: --
P: --
U.K. Industrial Output MoM (Oct)A:--
F: --
P: --
U.K. Construction Output YoY (Oct)A:--
F: --
P: --
 France HICP Final MoM (Nov)
A:--
F: --
P: --
 China, Mainland Outstanding Loans Growth YoY (Nov)
A:--
F: --
P: --
China, Mainland M2 Money Supply YoY (Nov)A:--
F: --
P: --
China, Mainland M0 Money Supply YoY (Nov)A:--
F: --
P: --
China, Mainland M1 Money Supply YoY (Nov)A:--
F: --
P: --
 India CPI YoY (Nov)
A:--
F: --
P: --
India Deposit Gowth YoYA:--
F: --
P: --
 Brazil Services Growth YoY (Oct)
A:--
F: --
P: --
 Mexico Industrial Output YoY (Oct)
A:--
F: --
P: --
 Russia Trade Balance (Oct)
A:--
F: --
P: --
 Philadelphia Fed President Henry Paulson delivers a speech
 Canada Building Permits MoM (SA) (Oct)
A:--
F: --
P: --
Canada Wholesale Sales YoY (Oct)A:--
F: --
P: --
Canada Wholesale Inventory MoM (Oct)A:--
F: --
P: --
Canada Wholesale Inventory YoY (Oct)A:--
F: --
P: --
Canada Wholesale Sales MoM (SA) (Oct)A:--
F: --
P: --
 Germany Current Account (Not SA) (Oct)
A:--
F: --
P: --
U.S. Weekly Total Rig CountA:--
F: --
P: --
U.S. Weekly Total Oil Rig CountA:--
F: --
P: --
 Japan Tankan Large Non-Manufacturing Diffusion Index (Q4)
--
F: --
P: --
Japan Tankan Small Manufacturing Outlook Index (Q4)--
F: --
P: --
Japan Tankan Large Non-Manufacturing Outlook Index (Q4)--
F: --
P: --
Japan Tankan Large Manufacturing Outlook Index (Q4)--
F: --
P: --
Japan Tankan Small Manufacturing Diffusion Index (Q4)--
F: --
P: --
Japan Tankan Large Manufacturing Diffusion Index (Q4)--
F: --
P: --
Japan Tankan Large-Enterprise Capital Expenditure YoY (Q4)--
F: --
P: --
U.K. Rightmove House Price Index YoY (Dec)--
F: --
P: --
China, Mainland Industrial Output YoY (YTD) (Nov)--
F: --
P: --
China, Mainland Urban Area Unemployment Rate (Nov)--
F: --
P: --
 Saudi Arabia CPI YoY (Nov)
--
F: --
P: --
 Euro Zone Industrial Output YoY (Oct)
--
F: --
P: --
Euro Zone Industrial Output MoM (Oct)--
F: --
P: --
Canada Existing Home Sales MoM (Nov)--
F: --
P: --
Euro Zone Total Reserve Assets (Nov)--
F: --
P: --
U.K. Inflation Rate Expectations--
F: --
P: --
Canada National Economic Confidence Index--
F: --
P: --
Canada New Housing Starts (Nov)--
F: --
P: --
U.S. NY Fed Manufacturing Employment Index (Dec)--
F: --
P: --
U.S. NY Fed Manufacturing Index (Dec)--
F: --
P: --
Canada Core CPI YoY (Nov)--
F: --
P: --
Canada Manufacturing Unfilled Orders MoM (Oct)--
F: --
P: --
Canada Manufacturing New Orders MoM (Oct)--
F: --
P: --
Canada Core CPI MoM (Nov)--
F: --
P: --
Canada Manufacturing Inventory MoM (Oct)--
F: --
P: --
Canada CPI YoY (Nov)--
F: --
P: --
Canada CPI MoM (Nov)--
F: --
P: --
Canada CPI YoY (SA) (Nov)--
F: --
P: --
Canada Core CPI MoM (SA) (Nov)--
F: --
P: --

No matching data
Latest Views
Latest Views
Trending Topics
Top Columnists
Latest Update
White Label
Data API
Web Plug-ins
Affiliate Program
View All
No data
The USD/JPY pair dropped to 140.13 on Tuesday, marking yet another seven-month low.
The USD/JPY pair dropped to 140.13 on Tuesday, marking yet another seven-month low.
The yen’s rally is gaining momentum amid rising global trade risks. Additionally, investors are growing increasingly wary of US assets.
Last week’s tentative market optimism has now faded, with sentiment deteriorating following remarks from US President Donald Trump regarding the potential dismissal of Federal Reserve Chair Jerome Powell. Trump has expressed dissatisfaction with the Fed’s pace of decision-making, with the White House believing progress is too slow.
Domestically, Japanese investors are closely watching the upcoming Bank of Japan (BoJ) meeting on 1 May. While the key interest rate is expected to remain steady at 0.50% per annum, the central bank may revise its economic growth forecasts—prompted by mounting external risks, including the impact of US tariffs on Japanese exports.
The yen continues to perform strongly as a safe-haven asset. However, an excessively strong JPY also carries risks.
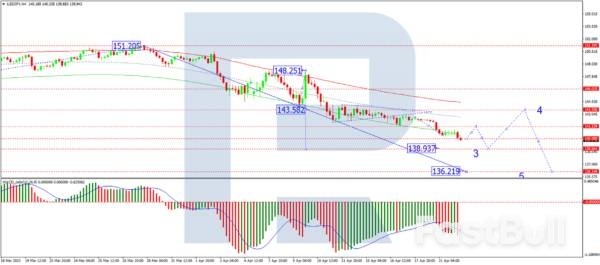
H4 Chart
On the H4 chart, USD/JPY has broken below the 141.55 level, extending its downward wave towards 138.88. This is a near-term target, and upon reaching it, a corrective rebound towards 143.55 is possible. Beyond that, further downside towards 136.22 may be considered. This scenario is supported by the MACD indicator, with its signal line firmly below zero and pointing sharply downward.
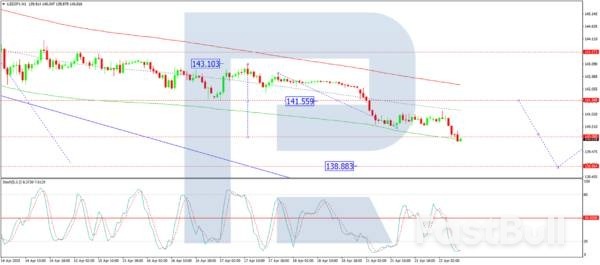
H1 Chart
On the H1 chart, the pair continues to develop the third wave of its downtrend. The immediate target of 140.00 has been met, and a temporary rebound to 141.55 (testing from below) could occur today. Subsequently, another decline towards 138.88 may follow. This outlook is corroborated by the Stochastic oscillator, whose signal line is below 20 but turning upward towards 80.
While the yen’s strength reflects its defensive appeal, excessive appreciation could prove detrimental. Traders should monitor both fundamental developments and technical signals for further guidance.
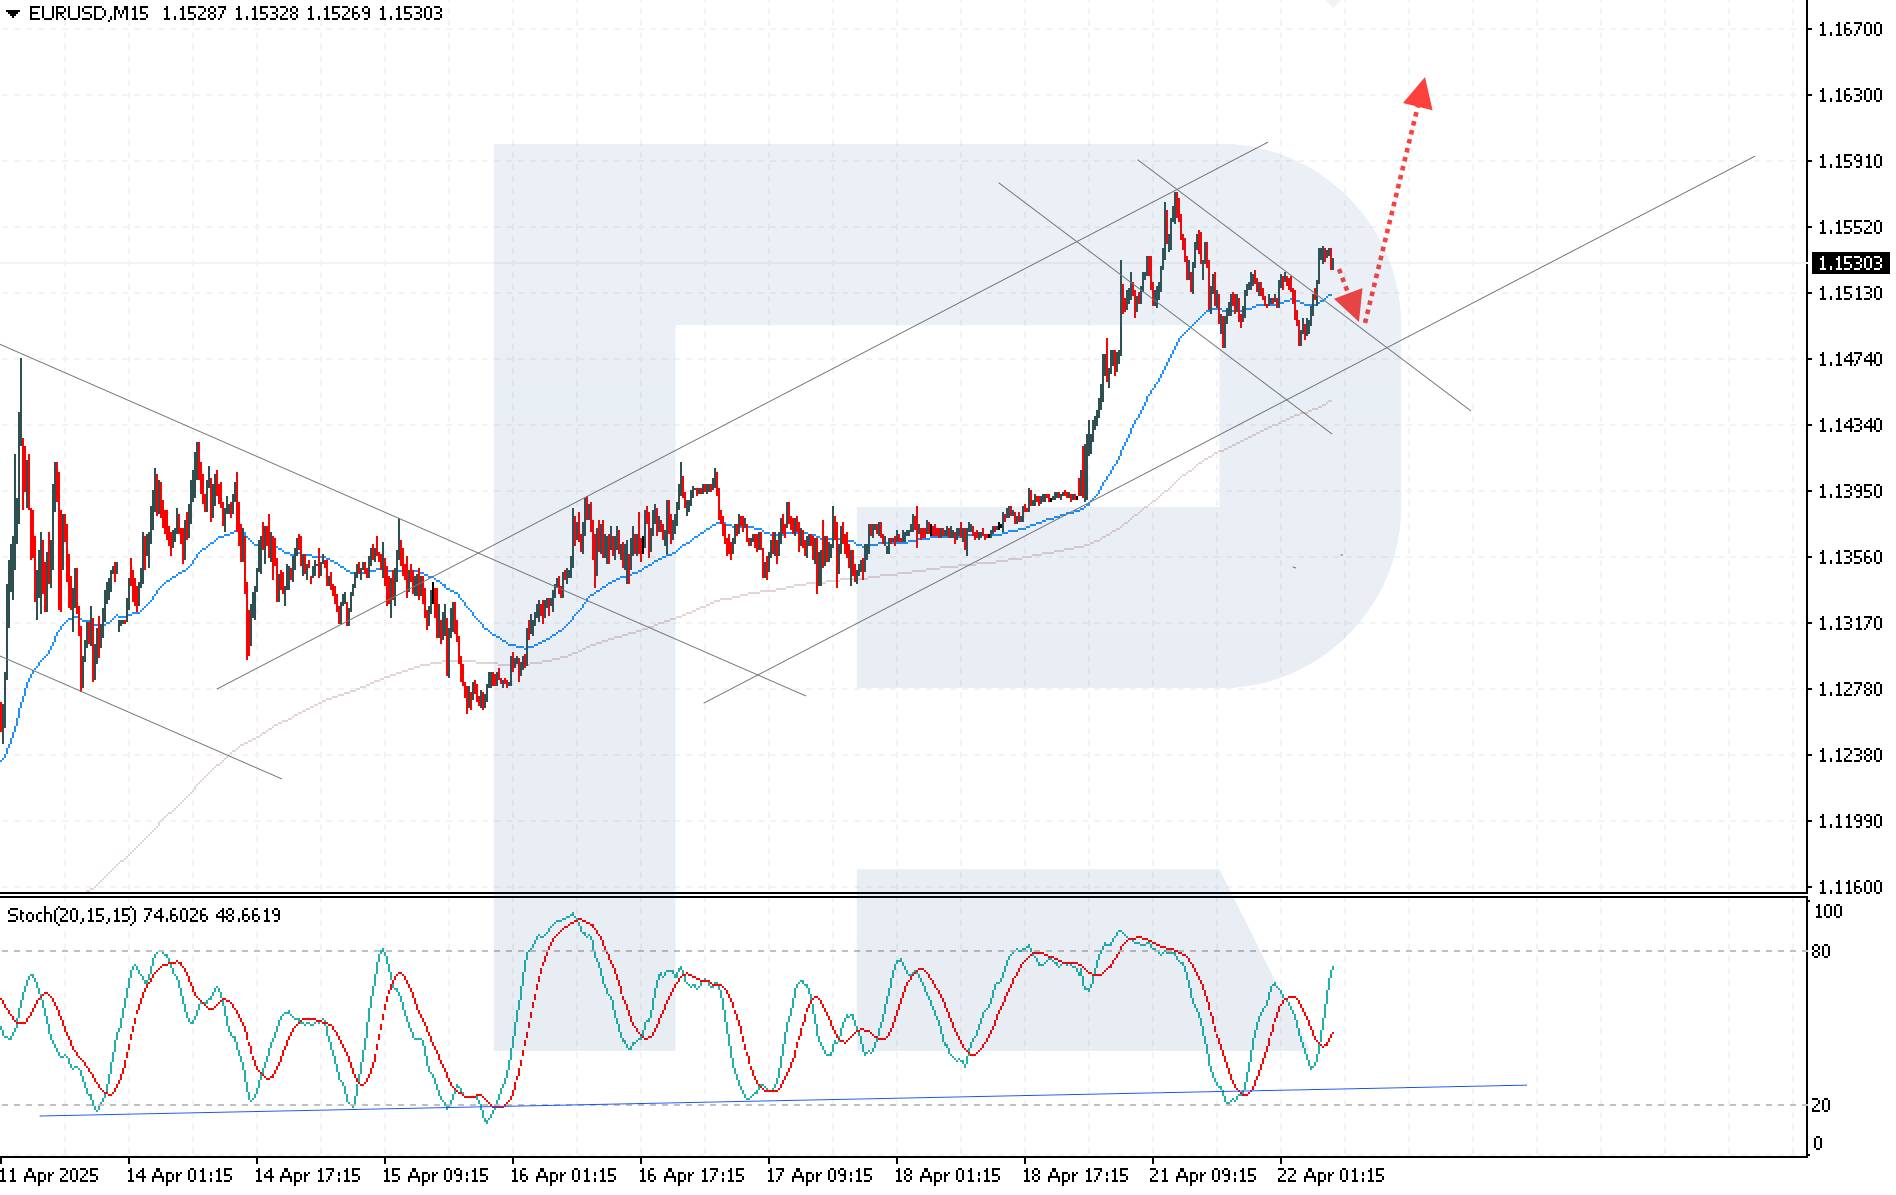
Increased pressure on the Fed and rising geopolitical tensions continue to undermine the US dollar, supporting the EURUSD rally. The EURUSD technical analysis points to strong upside potential, with the next target at 1.1630.
The EURUSD rate is gaining for the third consecutive trading session, currently trading at 1.1530. Find out more in our analysis for 22 April 2025.
The EURUSD rate continues to rally after rebounding from the 1.1475 support level. Pressure on the US dollar has increased following fresh verbal attacks by President Donald Trump on Federal Reserve Chairman Jerome Powell. On Monday, Trump escalated his calls for immediate rate cuts.
Market participants are increasingly concerned about the rising tension between the White House and the Fed. Trump’s actions could be perceived as an attempt to pressure the Fed’s independence, with speculation around a possible replacement of Powell adding to uncertainty and fear in the market, undermining confidence in the US dollar.
Additional support for the EURUSD rally came from investor disappointment over stalled US-China trade negotiations. Beijing accused Washington of misusing tariffs and warned other nations about entering trade deals with the US, which has increased tensions and further weighed on the US dollar.
The EURUSD rate is on the rise after breaking above the upper boundary of the descending corrective channel. Today’s EURUSD forecast points to a continued bullish wave targeting 1.1630. Technical indicators support the bullish scenario, with Moving Averages maintaining their upward direction and the Stochastic Oscillator rising confidently from oversold territory, showing a bullish crossover between the %K and %D lines. Consolidation above the local resistance at 1.1555 will confirm the bullish scenario.

It’s the turnaround point of a previous trend shift — $1.3430 could be a double-top pattern and bears are on the watch. Also, sterling is up a whopping 11% since mid-January.
Today will be light on the macro front, with markets continuing to closely watch trade uncertainty and any signals from Trump.
In the euro area, focus turns to the consumer confidence indicator for April. Consumer confidence has declined in the past months following a great rebound last year, and the trade war uncertainty in April has likely amplified the development.
In Sweden, the latest unemployment figures will be released today at 8:00 CET. The concerning trend observed in recent months may persist due to significant uncertainties faced by companies, which likely suppress their willingness to hire. Although we anticipate a decline in unemployment towards the end of the year, it may take a few more months to be certain that we have surpassed the peak levels.
For the remainder of the week, the most important data releases are the PMI reports for April, scheduled for release on Wednesday. As the surveys were conducted after Liberation Day, the figures are likely to provide a first glimpse of the impact from tariff uncertainty. Importantly, any progress in the tariff saga – particularly in US-China trade negotiations – and shifts in global investor sentiment will continue to influence markets this week.
What happened during Easter
In the US, retail sales growth in March (ahead of Liberation Day) remained solid, printing close to expectations at 1.4% (cons: 1.3%, prior: 0.2%). Lower gasoline prices dragged on the headline, while car sales edged up. While tariff concerns likely impacted some categories, sales growth in bars and restaurants — often a good measure of discretionary spending and not affected by tariffs — gained some momentum from February. Overall, the release suggests that the very gloomy consumer sentiment readings have yet to translate into hard data as negatively as some had feared.
The Philly Fed’s manufacturing index weakened markedly in April, with new orders slumping to -34.2 from 8.7 in March. Hence, there are signs that PMIs for April will deteriorate in the first reading after Liberation Day.
During Easter, several Fed speakers were on the wire. Fed Chair Powell (hawk and voting member) emphasized that the Fed remains in a wait-and-see mode. Similarly, NY Fed President Williams (hawk and voting member) said that he does not see an imminent need for a change in monetary policy. Chicago Fed President Goolsbee (neutral and voting member) stated that he hopes the US is not moving toward an environment where the Fed’s monetary policy independence is questioned, following Trump’s recent attacks on Powell. Considering the upcoming week for the Fed, focus will naturally be on Trump’s outbursts toward Powell, but attention will also be on several Fed officials scheduled to speak before the blackout period begins on Saturday.
In the euro area, the ECB cut policy rates by 25bp, bringing the deposit rate to 2.25%, as widely anticipated. Overall, the meeting was in line with our expectations, with the ECB conveying a dovish tone – noting the downside risks to growth, while downplaying the topside risks to inflation. Markets reacted by sending European yields lower on the statement, with further declines during the press conference. EUR/USD moved initially lower, but the weak Philly Fed reading provided some support for the cross. Looking ahead, we continue to expect the ECB to deliver 25bp cuts at the upcoming meetings, bringing the deposit rate to 1.50% by September 2025. We currently see downside risks to growth, inflation and rates in the medium term. For more detail on our assessment of the ECB meeting, please see ECB review – Dovish bias in troubled waters, 17 April.
In China, the 1Y loan prime rate and the 5Y loan prime rate were held unchanged at 3.10% and 3.60%, respectively.
Turning to politics, China has accused the US of abusing tariffs and warned other countries against striking deals with the US at China’s expense. The remarks come after a Bloomberg article, citing sources familiar with the matter, reported that the Trump administration is preparing to pressure nations seeking tariff reductions or exemptions from the US to curb trade with China – including through the imposition of monetary sanctions. For more detail on how we currently see China’s footing in the trade war, please see Postcard from China – 10 key takeaways from trip to China, 16 April.
In the UK, March inflation was lower than expected across the board, with headline at 2.6% y/y (cons: 2.7%, prior: 2.8%), core at 3.4% (cons: 3.4%, prior: 3.5%) and services at 4.7% (cons: 4.8%, prior: 5.0%). The largest downward contribution came from recreation and culture and transport, while clothing provided the largest upward contribution. The monthly momentum eased in services and in core services, which is the key measure for the BoE. With UK inflation surprising to the downside over the past months we think the BoE is set to continue easing, delivering its next 25bp cut at the upcoming meeting in May.
In Denmark, Danmarks Nationalbank followed the ECB, cutting its key policy rate 25bp to 1.85%.
In Canada, the BoC held its policy rate at 2.75%, as expected by markets. The BoC emphasized that monetary policy cannot fix trade uncertainty and reaffirmed its 2% inflation target. The MPR included two scenarios: one with normal trade, showing modest growth and steady inflation, and another with a prolonged trade war, forecasting recession and inflation above 3% next year. The neutral rate estimate was kept unchanged at 2.25-3.25%. Markets now lean toward a June cut, suggesting the BoC is pausing, not ending, its easing cycle amid tariff-related uncertainty.
In Japan, the nationwide inflation report for March, saw core CPI rise 3.2% y/y from 3.0%, in line with expectations. Excluding fresh food and fuel costs, the index increased 2.9% y/y from 2.0%. Governor Ueda was on the wire, reiterating that the BoJ will continue to raise interest rates if underlying inflation pressures continue to accelerate toward 2%. That said, Ueda also signalled a naturally cautious and flexible approach amid the uncertainty stemming from Trump’s potential tariffs. We continue to expect the BoJ to normalize policy further, delivering additional rate hikes this year.
In Turkey, the CBT surprised markets hiking its policy rate by 350bp to 46%.
In commodities space, easing supply concerns tied to potential progress in US-Iran nuclear talks pushed oil prices down over 2% during yesterday’s session. As of this morning brent is trading around 67 USD/bbl.
Gold prices continued its record high rally this morning, hovering around USD3488 per troy, driven by investors seeking safe-haven assets.
Equities: Looking at equity markets over Easter – a period with more public holidays in Europe than in the US – the overall direction has been lower. Over the past five trading days, US equities have fallen by a little more than 4%, while European equities are marginally higher. That said, US futures are pointing higher this morning, whereas European futures are slightly in the red. In terms of cyclicals versus defensives, the risk-off sentiment has been most pronounced in the US, with cyclicals down more than 5%, while defensives are down around 2%. Europe shows a similar but more muted trend, with modest defensive outperformance. In the US yesterday, the Dow declined by 2.5%, the S&P 500 by 2.4%, the Nasdaq by 2.6%, and the Russell 2000 by 2.1%. With yesterday’s moves, the VIX is now back at 33 – a clear reflection of the current environment, where uncertainty is weighing on equities more than hard macro data. Year-to-date, European equities have outperformed US equities by nearly 15% when measured in local currency. However, the recent EUR/USD appreciation adds another ~12% headwind for investors who have not hedged the dollar, making U.S. equity exposure particularly challenging this year. This morning, Asian equities are trading higher, while European futures are lower, and US futures are marginally up.
FI & FX: USD continues to weaken on the back of the economic and political uncertainty in US as well as recent comment from Trump regarding Fed Chairman Powell and the need for “pre-emptive rate cuts” from the Federal Reserve. Short-end rates in the US have fallen since last week, but the long-end continues to rise in a steepening move. Following a dovish ECB meeting with a widely anticipated 25bp rate cut, European rates have rallied, which helped the SEK perform against EUR last Thursday, however, the negative international turmoil has caught up with the SEK and will likely push EURSEK levels back towards our post ECB-decision near-term fair-value assessment of 11.
Bitcoin (BTC) showed significant recovery momentum after a week of consolidation, rising by over 3% as of April 21, 2025, to reach $87,350 at press time. This upward movement brings BTC closer to the key $88,500 resistance level, a critical area that could trigger further liquidity movement. If it breaches this resistance effectively, BTC may target the $90k level given the current price action and patterns noted on previous breakouts tried in analogous zones.
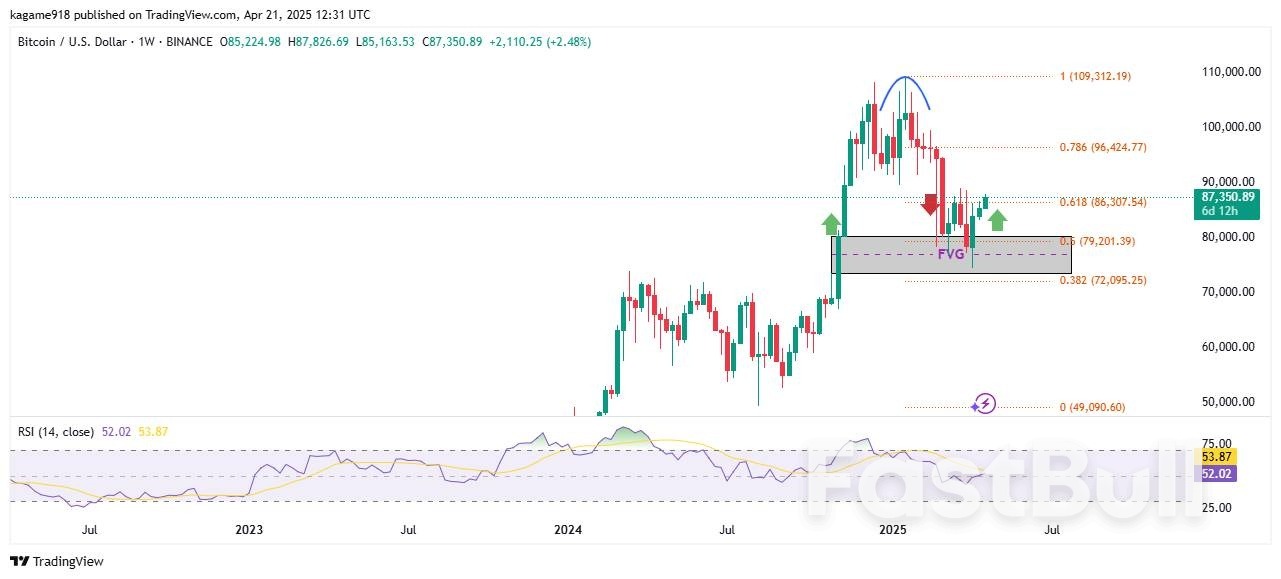
BTC has shown resilience, consolidating between $76,000 and $87,350 in recent weeks after failing to hold above $90,000 during earlier attempts. The chart analysis highlights $88,500 as a major resistance point, where BTC has previously struggled to maintain upward momentum. The 0.618 Fibonacci retracement level at $86,307 suggests that BTC is holding firm near this zone, signaling that the market could be preparing for another upward push if buying pressure continues and liquidity above $88,500 is taken.
Furthermore, the Relative Strength Index (RSI) at 52.02 relative to the 14-day close of 53.87 suggests a neutral market sentiment. This level suggests that BTC has potential for growth, as it is far from being overbought. The recovery of RSI from the low 40s confirms renewed buying interest after weeks of stagnation. In this case, should the buying side strengthen, BTC would push past resistance at $88,500 and move toward $90,000 before facing further obstacles near its $96,424 and $109,312 Fibonacci extensions.
If BTC fails to sustain above $88,500, it might retrace toward the $79,200 support level, aligning with the 0.5 Fibonacci zone. Additionally, if the sentiment declines, the $72,095 mark at the 0.382 retracement may act as the next downside buffer. The Fair Value Gap (FVG) formed earlier is still active below the current price and may act as a magnet should the momentum fade in the short term.
728 RM B 7/F GEE LOK IND BLDG NO 34 HUNG TO RD KWUN TONG KLN HONG KONG


White Label
Data API
Web Plug-ins
Poster Maker
Affiliate Program
The risk of loss in trading financial instruments such as stocks, FX, commodities, futures, bonds, ETFs and crypto can be substantial. You may sustain a total loss of the funds that you deposit with your broker. Therefore, you should carefully consider whether such trading is suitable for you in light of your circumstances and financial resources.
No decision to invest should be made without thoroughly conducting due diligence by yourself or consulting with your financial advisors. Our web content might not suit you since we don't know your financial conditions and investment needs. Our financial information might have latency or contain inaccuracy, so you should be fully responsible for any of your trading and investment decisions. The company will not be responsible for your capital loss.
Without getting permission from the website, you are not allowed to copy the website's graphics, texts, or trademarks. Intellectual property rights in the content or data incorporated into this website belong to its providers and exchange merchants.
Not Logged In
Log in to access more features

FastBull Membership
Not yet
Purchase


Log In
Sign Up


