• Trade
  • Markets
  • Copy
  • Contests
  • 24/7
  • Calendar
  • Q&A
  • Chats
Screeners
SYMBOL
LAST
BID
ASK
HIGH
LOW
NET CHG.
%CHG.
SPREAD
SOURCE
SPX
S&P 500 Index
7554.28
7554.28
7554.28
7577.92
7516.75
+122.83
+ 1.65%
--
--
DJI
Dow Jones Industrial Average
51671.02
51671.02
51671.02
51945.89
51647.50
+468.77
+ 0.92%
--
--
IXIC
NASDAQ Composite Index
26683.93
26683.93
26683.93
26687.56
26438.77
+795.10
+ 3.07%
--
--
USDX
US Dollar Index
99.420
99.420
99.500
99.430
99.330
+0.110
+ 0.11%
--
--
EURUSD
Euro / US Dollar
1.15849
1.15849
1.15856
1.15948
1.15844
-0.00039
-0.03%
--
--
GBPUSD
Pound Sterling / US Dollar
1.34003
1.34003
1.34010
1.34177
1.33999
-0.00102
-0.08%
--
--
XAUUSD
Gold / US Dollar
4310.57
4310.57
4310.95
4325.78
4305.88
+2.22
+ 0.05%
--
--
WTI
Light Sweet Crude Oil
79.518
79.518
79.553
80.135
79.464
-0.320
-0.40%
--
--

Community Accounts

Signal Accounts
--
Profit Accounts
--
Loss Accounts
--
View More

Become a signal provider

Sell trading signals to earn additional income

View More

Guide to Copy Trading

Get started with ease and confidence

View More

Signal Accounts for Members

All Signal Accounts

Best Return
  • Best Return
  • Best P/L
  • Best MDD
Past 1W
  • Past 1W
  • Past 1M
  • Past 1Y

All Contests

  • All
  • Recommend
  • Stocks
  • Cryptocurrencies
  • Central Banks
  • Trump Updates
  • Featured News
Top News Only
Share

The Main Polypropylene (PP) Contract Fell Below 8,000 Yuan/ton, Down 4.36% On The Day

Share

National Bureau Of Statistics: Imports And Exports Posted Robust Growth, And The Trade Structure Continued To Improve

Share

The Main Methanol Futures Contract Fell 6.00% Intraday, Currently Trading At 2676.00 Yuan/ton

Share

National Bureau Of Statistics: Natural Gas Production Declined Slightly. In May, Natural Gas Output From Industrial Enterprises Above Designated Size Totaled 21.7 Billion Cubic Meters, Down 2.2% Year On Year, Compared With A 1.9% Increase In April; The Average Daily Output Was 700 Million Cubic Meters. From January To May, Natural Gas Production By These Enterprises Reached 111.7 Billion Cubic Meters, Up 1.7% Year On Year

Share

National Bureau Of Statistics: Crude Oil Production Posted Steady Growth. In May, Crude Oil Output From Industrial Enterprises Above Designated Size Reached 18.57 Million Tonnes, Up 0.5% Year On Year; The Growth Rate Slowed By 0.7 Percentage Points Compared With April, With An Average Daily Output Of 599,000 Tonnes. From January To May, Crude Oil Production By These Enterprises Totaled 91.31 Million Tonnes, A Year-on-Year Increase Of 1.1%

Share

National Bureau Of Statistics: Raw Coal Production Remained At A High Level. In May, The Output Of Raw Coal From Industrial Enterprises Above Designated Size Was 400 Million Tons, A Year-on-Year Decrease Of 1.7%; The Average Daily Output Was 12.81 Million Tons. From January To May, The Output Of Raw Coal From Industrial Enterprises Above Designated Size Was 1.98 Billion Tons, A Year-on-Year Decrease Of 0.3%

Share

National Bureau Of Statistics: From January To May, The Total Retail Sales Of Consumer Goods And Services Increased By 2.8% Year On Year

Share

National Bureau Of Statistics: From January To May, Nationwide Online Retail Sales Of Goods And Services Totaled RMB 8.3177 Trillion, Up 5.9% Year On Year. Among Them, Online Retail Sales Of Goods Reached RMB 5.2718 Trillion, An Increase Of 5.0%; Within This Category, Sales Of Food, Apparel, And Daily-use Products Rose By 15.5%, 7.2%, And 1.6%, Respectively. Online Retail Sales Of Services Amounted To RMB 3.0459 Trillion, Up 7.6%

Share

National Bureau Of Statistics: Industrial Investment Grew 0.1% Year-on-Year From January To May

Share

National Bureau Of Statistics: The National Services Production Index Rose By 4.4% Year-on-Year In May

Share

National Bureau Of Statistics: In May, New-energy Vehicle Production Reached 1.489 Million Units, Up 17.8% Year On Year

Share

National Bureau Of Statistics: From January To May, The Sales Area Of Newly Built Commercial Housing Totaled 313.2 Million Square Meters, Down 10.8% Year On Year

Share

In May, China's Urban Fixed-asset Investment Fell 1.91% Month-on-month, Compared With A Previous Reading Of -2.36%

Share

National Bureau Of Statistics: In May, The Output Of 3D Printing Equipment, Lithium-ion Batteries, And Industrial Robots Increased Year On Year By 54.4%, 40.0%, And 27.9%, Respectively

Share

In May, China's Industrial Value-added Growth For Enterprises Above Designated Size Rose 0.4% Month-on-month, Compared With The Previous Reading Of 0.05%

Share

China's Total Retail Sales Of Consumer Goods Rose By -0.38% Month-over-month In May, Compared To A Previous Reading Of -0.48%

Share

According To The National Bureau Of Statistics, In May, The Production Of Raw Coal By Industrial Enterprises Above A Designated Size Remained At A High Level, Crude Oil Production Grew Steadily, Natural Gas Production Declined Slightly, And The Growth Rate Of Electricity Production Accelerated

Share

According To The National Bureau Of Statistics, From January To May, National Real Estate Development Investment Totaled 3.0356 Trillion Yuan, A Year-on-Year Decrease Of 16.2%; Among Which, Residential Investment Totaled 2.3426 Trillion Yuan, A Decrease Of 15.6%

Share

National Bureau Of Statistics: Total Retail Sales Of Consumer Goods Grew By 1.4% From January To May 2026

Share

National Bureau Of Statistics: The National Economy Operated Smoothly Overall In May, Showing New And Positive Trends

TIME
ACT
FCST
PREV
IMPACT
U.S. Weekly Total Rig Count

A:--

F: --

P: --

WTI
  • WTI
  • XAUUSD
  • XAGUSD
  • USDX
U.S. Weekly Total Oil Rig Count

A:--

F: --

P: --

WTI
  • WTI
  • XAUUSD
  • XAGUSD
  • USDX
U.K. Rightmove House Price Index YoY (Jun)

A:--

F: --

P: --

GBPUSD
  • GBPUSD
  • XAUUSD
  • XAGUSD
  • WTI
  • USDX
ECB President Lagarde Speaks
Euro Zone Industrial Output YoY (Apr)

A:--

F: --

P: --
EURUSD
  • EURUSD
  • XAUUSD
  • XAGUSD
  • WTI
  • USDX
Euro Zone Trade Balance (Not SA) (Apr)

A:--

F: --

P: --
EURUSD
  • EURUSD
  • XAUUSD
  • XAGUSD
  • WTI
  • USDX
Euro Zone Trade Balance (SA) (Apr)

A:--

F: --

P: --
EURUSD
  • EURUSD
  • XAUUSD
  • XAGUSD
  • WTI
  • USDX
Euro Zone Industrial Output MoM (Apr)

A:--

F: --

P: --
EURUSD
  • EURUSD
  • XAUUSD
  • XAGUSD
  • WTI
  • USDX
Euro Zone Total Reserve Assets (May)

A:--

F: --

P: --

EURUSD
  • EURUSD
  • XAUUSD
  • XAGUSD
  • WTI
  • USDX
Canada National Economic Confidence Index

A:--

F: --

P: --

USDCAD
  • USDCAD
  • XAUUSD
  • XAGUSD
  • WTI
  • USDX
Canada New Housing Starts (May)

A:--

F: --

P: --
USDCAD
  • USDCAD
  • XAUUSD
  • XAGUSD
  • WTI
  • USDX
Canada Manufacturing New Orders MoM (Apr)

A:--

F: --

P: --

USDCAD
  • USDCAD
  • XAUUSD
  • XAGUSD
  • WTI
  • USDX
Canada Manufacturing Unfilled Orders MoM (Apr)

A:--

F: --

P: --

USDCAD
  • USDCAD
  • XAUUSD
  • XAGUSD
  • WTI
  • USDX
U.S. NY Fed Manufacturing Employment Index (Jun)

A:--

F: --

P: --

USDX
  • USDX
  • XAUUSD
  • XAGUSD
  • WTI
U.S. NY Fed Manufacturing New Orders Index (Jun)

A:--

F: --

P: --

USDX
  • USDX
  • XAUUSD
  • XAGUSD
  • WTI
U.S. NY Fed Manufacturing Prices Received Index (Jun)

A:--

F: --

P: --

USDX
  • USDX
  • XAUUSD
  • XAGUSD
  • WTI
Canada Wholesale Inventory MoM (Apr)

A:--

F: --

P: --

USDCAD
  • USDCAD
  • XAUUSD
  • XAGUSD
  • WTI
  • USDX
Canada Wholesale Sales YoY (Apr)

A:--

F: --

P: --

USDCAD
  • USDCAD
  • XAUUSD
  • XAGUSD
  • WTI
  • USDX
Canada Manufacturing Inventory MoM (Apr)

A:--

F: --

P: --

USDCAD
  • USDCAD
  • XAUUSD
  • XAGUSD
  • WTI
  • USDX
Canada Wholesale Inventory YoY (Apr)

A:--

F: --

P: --

USDCAD
  • USDCAD
  • XAUUSD
  • XAGUSD
  • WTI
  • USDX
Canada Wholesale Sales MoM (SA) (Apr)

A:--

F: --

P: --
USDCAD
  • USDCAD
  • XAUUSD
  • XAGUSD
  • WTI
  • USDX
U.S. NY Fed Manufacturing Index (Jun)

A:--

F: --

P: --

USDX
  • USDX
  • XAUUSD
  • XAGUSD
  • WTI
U.S. Industrial Output MoM (SA) (May)

A:--

F: --

P: --
USDX
  • USDX
  • XAUUSD
  • XAGUSD
  • WTI
U.S. Capacity Utilization MoM (SA) (May)

A:--

F: --

P: --

WTI
  • WTI
  • XAUUSD
  • XAGUSD
  • USDX
U.S. Manufacturing Output MoM (SA) (May)

A:--

F: --

P: --
USDX
  • USDX
  • XAUUSD
  • XAGUSD
  • WTI
U.S. Industrial Output YoY (May)

A:--

F: --

P: --

USDX
  • USDX
  • XAUUSD
  • XAGUSD
  • WTI
U.S. Manufacturing Capacity Utilization (May)

A:--

F: --

P: --

USDX
  • USDX
  • XAUUSD
  • XAGUSD
  • WTI
U.S. NAHB Housing Market Index (Jun)

A:--

F: --

P: --

USDX
  • USDX
  • XAUUSD
  • XAGUSD
  • WTI
Saudi Arabia CPI YoY (May)

A:--

F: --

P: --

China, Mainland Urban Area Unemployment Rate (May)

A:--

F: --

P: --

XAUUSD
  • XAUUSD
  • XAGUSD
  • WTI
  • USDX
China, Mainland Industrial Output YoY (YTD) (May)

A:--

F: --

P: --

XAUUSD
  • XAUUSD
  • XAGUSD
  • WTI
  • USDX
Japan Benchmark Interest Rate

--

F: --

P: --

BOJ Monetary Policy Statement
Australia Overnight (Borrowing) Key Rate

--

F: --

P: --

RBA Rate Statement
BOJ Press Conference
Turkey Retail Sales YoY (Apr)

--

F: --

P: --

Euro Zone Gross Wages YoY (Q1)

--

F: --

P: --

Euro Zone ZEW Current Conditions Index (Jun)

--

F: --

P: --

Germany ZEW Economic Sentiment Index (Jun)

--

F: --

P: --

Canada Existing Home Sales MoM (May)

--

F: --

P: --

Euro Zone Labor Cost YoY (Q1)

--

F: --

P: --

Euro Zone ZEW Economic Sentiment Index (Jun)

--

F: --

P: --

Germany ZEW Current Conditions Index (Jun)

--

F: --

P: --

Brazil Retail Sales MoM (Apr)

--

F: --

P: --

U.S. Import Price Index YoY (May)

--

F: --

P: --

U.S. Building Permits MoM (SA) (May)

--

F: --

P: --

U.S. New Housing Starts Annualized MoM (SA) (May)

--

F: --

P: --

U.S. Export Price Index MoM (May)

--

F: --

P: --

U.S. Export Price Index YoY (May)

--

F: --

P: --

U.S. Import Price Index MoM (May)

--

F: --

P: --

U.S. Total Building Permits (SA) (May)

--

F: --

P: --

U.S. Annual New Housing Starts (SA) (May)

--

F: --

P: --

U.S. Weekly Redbook Index YoY

--

F: --

P: --

ECB Chief Economist Lane Speaks
U.S. API Weekly Refined Oil Stocks

--

F: --

P: --

U.S. API Weekly Gasoline Stocks

--

F: --

P: --

U.S. API Weekly Cushing Crude Oil Stocks

--

F: --

P: --

U.S. API Weekly Crude Oil Stocks

--

F: --

P: --

Japan Reuters Tankan Manufacturers Index (Jun)

--

F: --

P: --

Q&A with Experts
    • All
    • Chatrooms
    • Groups
    • Friends
    Tom Moffitt flag
    KPRLPMLM46
    @EuroTrader yeah but I think it has to take out liquidity before the continuation
    @KPRLPMLM46 What are the levels for the lower liquidity sweep.?
    Tom Moffitt flag
    风神1号
    00:15
    @风神1号On fire mate
    Tom Moffitt flag
    You are a legend.
    KPRLPMLM46 flag
    Tom Moffitt
    @KPRLPMLM46 What are the levels for the lower liquidity sweep.?
    @Tom Moffitt 4,280
    Tom Moffitt flag
    KPRLPMLM46
    @Tom Moffitt 4,280
    @KPRLPMLM46 I was on the same page but the last 15 min candles kept me thinking why is it going up from there.
    风神1号 flag
    昨晚 黄金 的收益也不错最高到了4369
    风神1号 flag
    77 flag
    风神1号
    昨晚 黄金 的收益也不错最高到了4369
    @风神1号 我保损在60
    风神1号 flag
    对啊做这个交易赚钱了必须保損 下来我们还是赚钱了
    77 flag
    是的,保损看目标,怎样都是好的结果
    4769526 flag
    Strong bearish today gold
    Man Chez flag
    @风神1号what of today?
    𝐊𝐚𝐩𝐨𝐱 𝐟𝐱 𝐯𝐥𝐩 flag
    𝐊𝐚𝐩𝐨𝐱 𝐟𝐱 𝐯𝐥𝐩 flag
    𝐊𝐚𝐩𝐨𝐱 𝐟𝐱 𝐯𝐥𝐩 flag
    Gold on fire
    Man Chez flag
    @𝐊𝐚𝐩𝐨𝐱 𝐟𝐱 𝐯𝐥𝐩 your tp?
    𝐊𝐚𝐩𝐨𝐱 𝐟𝐱 𝐯𝐥𝐩 flag
    4280
    "𝐊𝐚𝐩𝐨𝐱 𝐟𝐱 𝐯𝐥𝐩" recalled a message
    jino james flag
    jino james flag
    nice one
    Type here...
    Add Symbol or Code

      No matching data

      All
      Recommend
      Stocks
      Cryptocurrencies
      Central Banks
      Trump Updates
      Featured News
      • All
      • Russia-Ukraine Conflict
      • Middle East Flashpoint
      • All
      • Russia-Ukraine Conflict
      • Middle East Flashpoint
      Search
      Products

      Charts Free Forever

      Chats Q&A with Experts
      Screeners Economic Calendar Data Tools
      Membership Features
      Data Warehouse Market Trends Institutional Data Policy Rates Macro

      Market Trends

      Market Sentiment Order Book Forex Correlations

      Top Indicators

      Charts Free Forever
      Markets

      News

      24/7 Analysis Education

      Latest Views

      Latest Update

      Signals

      Copy Rankings Latest Signals Become a signal provider AI Rating
      Contests
      Brokers

      Overview Brokers Assessment Rankings Regulators News Claims
      Broker listing Forex Brokers Comparison Tool Live Spread Comparison Scam
      Q&A Complaint Scam Alert Videos Tips to Detect Scam
      More

      Business
      Events
      Careers About Us Advertising Help Center

      White Label

      Broker API

      Data API

      Web Plug-ins

      Affiliate Program

      Awards Institution Evaluation IB Seminar Salon Event Exhibition
      Vietnam Thailand Singapore Dubai
      Fans Party Investment Sharing Session
      FastBull Summit BrokersView Expo
      Recent Searches
        Top Searches
          Markets
          Analysis
          User
          24/7
          Economic Calendar
          Education
          Data
          • Names
          • Latest
          • Prev

          View All

          No data

          Scan to Download

          Faster Charts, Chat Faster!

          Download
          English
          • English
          • Español
          • العربية
          • Bahasa Indonesia
          • Bahasa Melayu
          • Tiếng Việt
          • ภาษาไทย
          • Français
          • Italiano
          • Türkçe
          • Русский язык
          • 简中
          • 繁中
          Open Account
          Search
          Products
          Charts Free Forever
          Markets
          News
          Signals

          Copy Rankings Latest Signals Become a signal provider AI Rating
          Contests
          Brokers

          Overview Brokers Assessment Rankings Regulators News Claims
          Broker listing Forex Brokers Comparison Tool Live Spread Comparison Scam
          Q&A Complaint Scam Alert Videos Tips to Detect Scam
          More

          Business
          Events
          Careers About Us Advertising Help Center

          White Label

          Broker API

          Data API

          Web Plug-ins

          Affiliate Program

          Awards Institution Evaluation IB Seminar Salon Event Exhibition
          Vietnam Thailand Singapore Dubai
          Fans Party Investment Sharing Session
          FastBull Summit BrokersView Expo

          Japan Election Preview: What A Big LDP Win Could Mean For The Economy, Bonds And The Yen

          ING

          Forex

          Political

          Economic

          Summary:

          Takaichi has called a snap election just three months into the job, taking a high-risk move. It is all about securing a public mandate for her policy.

          Why did Takaichi call a snap election so early?

          Takaichi has called a snap election just three months into the job, taking a high-risk move. It is all about securing a public mandate for her policy.

          She inherited a troubled party and a minority government in October after Ishiba Shigeru, who lost both parliamentary elections, was nearly forced to resign. The LDP lost public support with a cost-of-living crisis and several political funding scandals. Despite only narrowly becoming prime minister, her approval ratings during the first three months were surprisingly strong at around 70%. Now, she seeks to leverage her popularity to secure a sole majority for the LDP and thereby advance her policy agenda later with greater consistency. She supports former Prime Minister Shinzo Abe's policies, advocating pro-stimulus macro policies and a Japan-focused foreign policy. Opposition parties may not fully agree with her policy perspectives. Should the minority government situation persist, she will have to negotiate with other parties on each policy issue. However, if she wins this election, she will interpret it as Japanese voters' endorsement of her pledges and will push her policy agenda much more forcefully.

          Recent polls suggested a landslide victory by the LDP

          According to recent local polls, the LDP leads the campaign for sure. The LDP is expected to well exceed a simple majority of 233 seats (vs its current 198 seats) and the alliance may reach near 300. In contrast, the main opposition, the Centrist Reform Alliance, could lose almost half of its current seats. If the LDP coalition secures a super majority, the government would gain significantly more power. This would allow Takaichi to pass legislation even without having sufficient support in the Upper House.

          The LDP is likely to secure a sole majority in the lower house

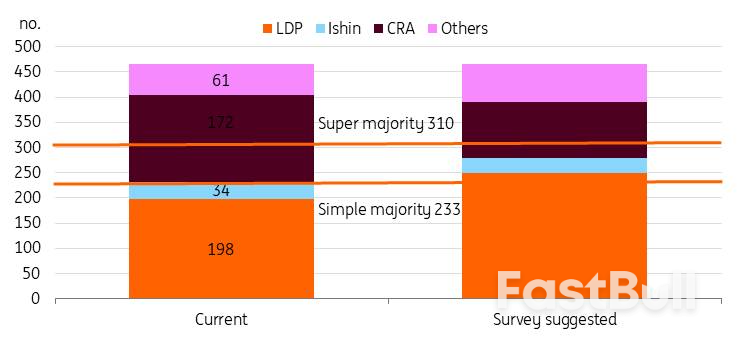
          Source: various news papers and ING estimates

          The tone regarding food tax cuts remained low-key

          Although the food consumption tax cut was a major topic before the campaign, its prominence diminished once the campaign began.

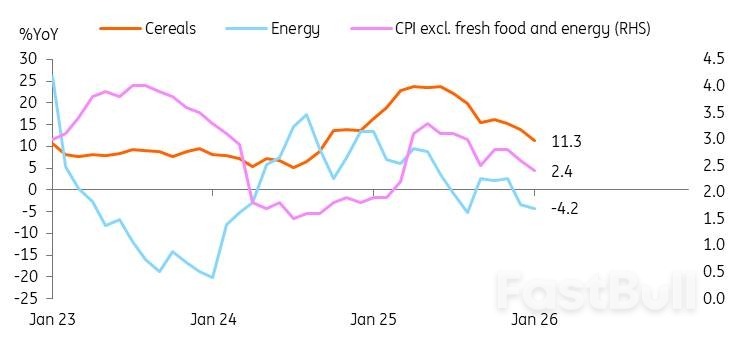
          Japanese inflation has stayed above 2% since April 2022, but wages have lagged behind. The rise in living costs has increased public dissatisfaction. For instance, rice, the primary staple food, gained almost 100% year-on-year by mid-2025, although it came down to the 30% level recently. So, reducing inflation became a primary focus of the election campaign. Takaichi resumed energy subsidies last year via the supplementary budget. We see the impact of the subsidy from the recent sharp decline in inflation readings.

          The focus has now turned to food prices. The food consumption tax rate of 8% is expected to reduce inflation by approximately one percentage point though at a cost of ¥5 trillion revenue loss (6% of total tax revenue). Although households may benefit from lower living costs, markets are worried about fiscal stability due to uncertain funding for the tax cuts.

          However, after experiencing recent market volatility, Takaichi has adopted a more cautious stance on food tax cuts. She has avoided directly addressing the proposal during the campaign, focusing instead on "responsible and proactive public finances". Now she remains vague on implementation timing and prefers to "accelerate the discussion" to keep the agenda neutral.

          Food and energy prices soared, a main source of public dissatisfaction

          Source: CEIC

          Will Takaichi's major win truly have a significant impact on fiscal policy?

          The market seems to have a fear that Takaichi's big victory may hurt fiscal conditions quite badly. We don't fully agree with it. If the LDP secures a majority in the lower house, Takaichi could speed up tax cut talks. She will argue that she has the public mandate. But a consensus still needs to be reached by the national council. The same should apply in case there is a super majority. Other opposition parties now support more expansionary fiscal policies; for instance, the CRA favours abolishing the food tax permanently, while the LDP suggests two-year exemptions. The LDP victory could result in a more balanced spending plan. Under Prime Minister Abe, Japan raised its consumption tax twice to help finance social security programmes for an ageing society, as part of the "Abenomics" reforms. It is expected that Takaichi will similarly focus on securing revenue while also aiming for greater spending.

          As previously stated, the LDP has not specified when the tax cut might take effect. Additionally, the party has made explicit commitments to lowering Japan's debt-to-GDP ratio and implementing fiscal reforms. Therefore, the LDP is anticipated to devise strategies that prevent a sharp increase in the fiscal deficit.

          The Bank of Japan may contribute to alleviating certain fiscal pressures

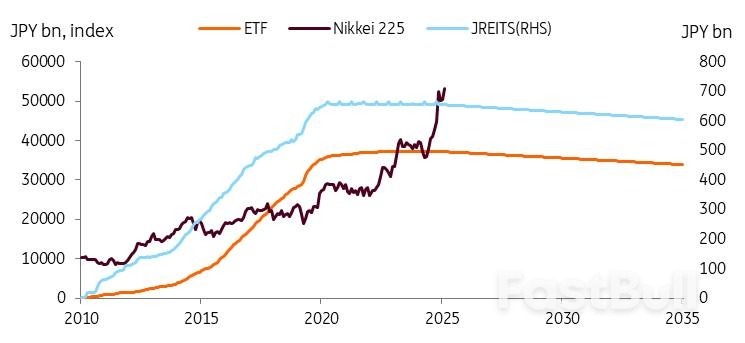
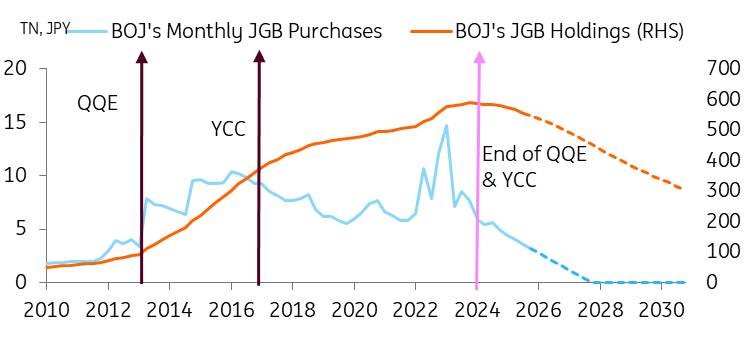
          One potential funding approach involves seeking support from the BoJ. The BoJ commenced its initial asset sales in 2026, targeting an annual reduction of ¥330 billion in ETFs and ¥5 billion in JREITs. According to recent data, the BoJ's ETF and JREIT holdings declined by ¥5.3 billion and ¥0.1 billion respectively from December 2025 to January 2026. While this represents a modest decrease, the BoJ is expected to continue reducing its asset portfolio, a strategy anticipated to provide substantial returns over time. Since 2010, the Nikkei 225 has increased fivefold. With a simple calculation, the BoJ could earn about ¥1.7 trillion from selling an ETF book valued at ¥330 billion. If we suppose the Nikkei increases at the same rate as nominal GDP growth, this income stream has the potential to serve as a stable funding source.

          The BoJ's ETF/JREITs sales will yield substantial returns

          Source: CEIC

          'Return to Normal' will be a key for Japanese economy and JGBs

          'Return to normal' implies higher inflation expectations, less central bank control over Japanese government bond (JGB) markets, increased volatility, and more yield adjustments.

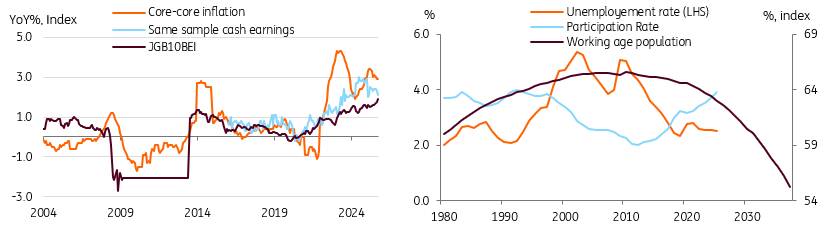
          We expect that the economy will return to a normal state after experiencing many years of deflation. While fiscal sustainability may contribute to higher yields, we think economic normalisation plays a stronger role in driving yields upward. These are reasons behind why we expect JGB yields to hit 3.0% by the end of 2027.

          Returning to a normal state means achieving sustainable inflation growth of around 2%. Higher inflation expectations may explain the rise in JGB rates. The BEI index has been approaching 2%, and we expect inflation expectations to increase and stabilise near 2%, supported by structural labour shortages sustaining wage growth. Over the last three years, spring wage negotiations have resulted in wage growth exceeding 4-5%, and this year, an increase of over 5% is expected. Government subsidies, lowering energy and food prices, are expected to drive positive real wage growth this year, supporting demand-driven inflation and reinforcing progress toward a sustainable 2% target.

          We expect inflation expectations to rise further, supported by solid wage growth

          Source: CEIC, OECD, ING estimates

          Returning to a normal state means that we expect the BoJ's slow and steady monetary policy normalisation via 1) policy rate hikes, a total of 75bp by the end of 2027 and 2) the BoJ's unwinding of unconventional monetary policy measures. As the BoJ buys less, the supply and demand balance shifts, creating upward pressure on JGB yields. While the BoJ will slow its reduction pace in April 2026, we expect the yield curve to steepen further during rate hikes, keeping spreads between the policy rate and 10Y JGBs at 150-175bp (currently 150bp). We believe that history doesn't necessarily predict well the future for JGBs, since past yield spreads happened during the deep disinflation. As quantitative tightening (QT) continues and bonds mature, the BoJ's control over the JGB market will diminish more, leading to more volatile, market-driven bond markets.

          The recent surge in JGB markets has, in some ways, demonstrated better market functioning

          While sudden market movements may cause concern among market participants, they should be seen as part of the economy's return to normal. The BoJ and government must strike a careful balance; if a major sell-off occurs that is not driven by fundamentals, they can adjust the QT pace and bond issuances accordingly.

          At the recent Bank of Japan meetings, following the JGB sell-off, Governor Ueda emphasised the bank's nimble approach to bond operations, which provides the BoJ significant flexibility. Nevertheless, his comments appear that the BoJ doesn't intend to change the path of rising yields; rather, just to smooth market volatility and prefers a more gradual progression. We believe that the BoJ will allow a gradual yield rise.

          Lastly, we anticipate that government spending will rise further to address issues related to an ageing population and increased welfare needs. We expect investment in automation and digital technology to lead to higher expenditures as well. Due to Takaichi's significant spending plan, the goal of achieving a primary budget surplus by fiscal year 2025/2026 was not met and has been postponed. We do not expect an abrupt rise in debt issuance under the Takaichi administration, but we still believe her policy stance should keep pressure on JGB yields.

          Reduced BoJ purchases of JGBs enhance market function

          Source: Bank of Japan, CEIC, ING estimates

          Tokyo set to do battle at JPY160

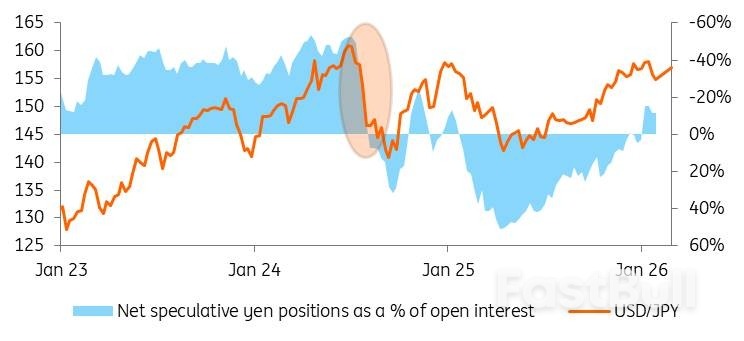
          It has been a volatile start to the year for USD/JPY, and it looks set to continue. The prevailing investment thesis has been that a negative real policy rate in Japan, burgeoning fiscal challenges and global investors favouring pro-cyclical currencies are all weighing on the yen. What seemed to be Japanese FX intervention near 160 and then reports of a Fed rate check late on Friday, 23 January have been the sole positives for the yen. Yet some official denials of US involvement and subsequent Japanese data question whether intervention took place at all. On the subject of intervention, we wonder whether strategic investment decisions from some of the government-influenced pension funds may be playing a role here – as is also the case in Korea when USD/KRW approaches 1500.

          A positive election result for the LDP that would pump more air into the 'Takaichi trade' is a USD/JPY positive. USD/JPY could even approach 160/162 levels again on the back of this. Officials in Tokyo have made it clear they are uncomfortable with those kinds of levels, which, while good for exporters, also stand to increase import prices at a time when the government is trying to ameliorate the cost-of-living crisis. Therefore, FX intervention near 160/162 looks likely.

          Will intervention be effective? Effective intervention requires heavy one-way market positioning and a turn in the fundamentals. Intervention proved effective in July 2024 when the speculative market was extremely short yen and the Fed was about to embark on an easing cycle – which the Fed did with a 50bp cut in September that year. USD/JPY fell from 160 to 140 over that two-month period.

          Today, speculative positions are nowhere near as short yen as they were in 2024. And with the Fed funds rate now much closer to neutral at 3.75%, the prospect of lower short-dated US rates is far less compelling than it was two years ago. In short, the conditions are not in place today for a large correction lower in USD/JPY.

          Instead, it looks like an LDP-inspired push higher in USD/JPY (assuming polls prove correct) will spark a sustained intervention campaign that could potentially last for the remainder of this year. For reference, the BoJ sold $100bn over four separate days between May and July in 2024. And in addition to the yen negatives discussed above, there is also the uncertainty about the timing of Japan's commitment to invest $550bn into the US – and whether that gets funded with dollar instruments (probably) or whether any FX flows are involved.

          In all, we forecast USD/JPY to bounce around in a 155-160 range through the first half of the year and then 50bp of Fed rate cuts to drag it closer to 150 by year-end. But upside risks prevail for the rest of this quarter.

          Speculative yen positions are not as short as they were in 2024

          Source: ING, CFTC

          This USD/JPY narrative adds weight to our preference to receive Tonar and pay SOFR on the cross-currency swap. This is the 'negative carry play', which benefits from fixing USD/JPY at today's rate, and then buying back dollars in a year or two's time at that same rate. It is especially suitable for shorter tenors, ideally 1–2 years. Leave the positive carry play for longer tenors. Or, wait for a better entry point; a lower USD/JPY, with the bliss entry point at 140. See more on that here.

          Implications for interest rate strategies - on the long road to 2%

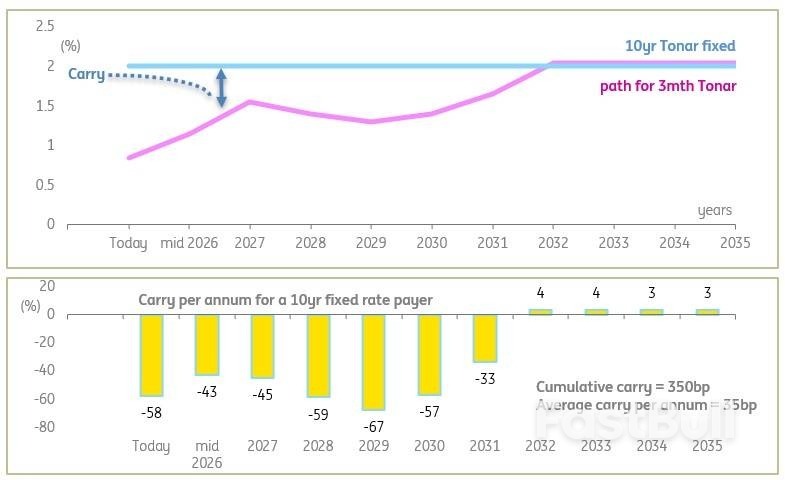
          For corporates looking at the relationship between floating rate exposure and fixed rate exposure post the elections, there are two key observations. First, floating rate Tonar rates are on a long winding path higher, eventually to 2%, although more likely to see a peak at around 1.5% in this current cycle. Still, floating-rate exposures remain the cheaper funding option for the coming few years, when compared with say 10yr Tonar (now at 2%).

          That being said, 10yr Tonar is likely to remain under upward pressure (in line with JGBs), which means that fixed rate payers set today would prove a positive mark-to-market outcome in the intermediate period. Also, we doubt there will be a fall to materially lower-rate lock-in opportunities, so the rate seen on screens today is about as good as it gets (give or take c.20bp, and barring the unexpected). The alternative is to look at lower lock-in levels in shorter tenors, say the 1.5% attainable in the 4yr tenor. We calculate that the average carry cost there per annum is about 20bp, compared with 35bp for the 10yr lock-in.

          For those looking to swap to floating, there is positive impact carry and positive cumulative carry, but it tapers, and is not dramatically high (350bp in the 10yr). The chart below illustrates the profile in the coming 10yrs, and the carry outcome for a 10yr fixed rate payer set today (reverse the signs for the fixed rate receiver).

          The long end is already at 2%, while the BoJ is on a slow path towards it, getting there eventually

          The lower chart shows the spread between 10yr Tonar and the evolution of 3mth Tonar over time

          Source: ING estimates, Macrobond

          Source: ING

          To stay updated on all economic events of today, please check out our Economic calendar
          Risk Warnings and Disclaimers
          You understand and acknowledge that there is a high degree of risk involved in trading. Following any strategies or investment methods may lead to potential losses. The content on the site is provided by our contributors and analysts for information purposes only. You are solely responsible for determining whether any trading assets, securities, strategy, or any other product is suitable for investing based on your own investment objectives and financial situation.
          Add to Favorites
          Share
          FastBull
          Copyright © 2026 FastBull Ltd

          728 RM B 7/F GEE LOK IND BLDG NO 34 HUNG TO RD KWUN TONG KLN HONG KONG

          TelegramInstagramTwitterfacebooklinkedin
          App Store Google Play Android Windows
          Products
          Charts

          Chats

          Q&A with Experts
          Screeners
          Economic Calendar
          Data
          Tools
          Membership
          Features
          Function
          Markets
          Copy Trading
          Latest Signals
          Contests
          24/7
          Analysis
          Education
          Company
          Careers
          About Us
          Contact Us
          Advertising
          Download FastBull
          Help Center
          Feedback
          User Agreement
          Privacy Policy
          Personal Information Protection Statement
          Business

          White Label

          Broker API

          Data API

          Web Plug-ins

          Poster Maker

          Affiliate Program

          Risk Disclosure

          The risk of loss in trading financial instruments such as stocks, FX, commodities, futures, bonds, ETFs and crypto can be substantial. You may sustain a total loss of the funds that you deposit with your broker. Therefore, you should carefully consider whether such trading is suitable for you in light of your circumstances and financial resources.

          No decision to invest should be made without thoroughly conducting due diligence by yourself or consulting with your financial advisors. Our web content might not suit you since we don't know your financial conditions and investment needs. Our financial information might have latency or contain inaccuracy, so you should be fully responsible for any of your trading and investment decisions. The company will not be responsible for your capital loss.

          Without getting permission from the website, you are not allowed to copy the website's graphics, texts, or trademarks. Intellectual property rights in the content or data incorporated into this website belong to its providers and exchange merchants.

          Not Logged In

          Log in to access more features

          Connect Broker
          Become a signal provider
          Help Center
          Customer Service
          Dark Mode
          Price Up/Down Colors

          Log In

          Sign Up

          Position
          Layout
          Fullscreen
          Default to Chart
          The chart page opens by default when you visit fastbull.com