- EURUSD
- XAUUSD
- XAGUSD
- WTI
- USDX
Markets
Analysis
User
24/7
Economic Calendar
Education
Data
- Names
- Latest
- Prev


Signal Accounts for Members
All Signal Accounts
All Contests


The European-Mediterranean Seismological Centre Reports A 5.5-magnitude Earthquake In Western Iran
According To CNN, U.S. Secretary Of State Marco Rubio Stated That Washington Bears The Responsibility For The Safety Of Navigation In The Strait Of Hormuz, Yet Most Ships Do Not Fly The U.S. Flag. Other Countries Should Share The Responsibility Of Protecting Navigation In The Strait, Whether By Providing Equipment Or Funding
Oil Prices Rebounded, And Hedge Funds' Short Positions On The New Zealand Dollar Rose To A Record High
The Main Polyvinyl Chloride (PVC) Futures Contract Surged 4.00% Intraday, Currently Trading At 4698.00 Yuan/ton
The Main Hog Futures Contract Fell By 2.00% During The Day, Currently Trading At 11,590.00 Yuan/ton
The Monetary Authority Of Singapore (MAS) Announced That Its Monetary Policy Statement Will Be Released On July 27
MIIT: Continuously Implement The New Round Of Work Plans To Stabilize Growth In Sectors Such As Machinery, Automobiles, And Power Equipment, Comprehensively Expanding Both High-quality Supply And Effective Demand
According To The China Earthquake Networks Center's Automatic Determination, A Magnitude 3.2 Earthquake Occurred Near Shizong County, Qujing City, Yunnan Province, At 10:27 On July 20. The Final Results Will Be Based On The Official Preliminary Report
Oil-themed LOFs Strengthened In The Morning Session, With Harvest Crude Oil LOF, E Fund Crude Oil LOF, And Southern Crude Oil LOF All Rising By More Than 6%, Oil LOF Rising By More Than 3%, And Oil Fund LOF And Global Oil And Gas Energy LOF Both Rising By More Than 2%
MIIT: In The First Half Of The Year, The Value Added Of Equipment Manufacturing And High-tech Manufacturing Enterprises Above Designated Size Increased By 9.3% And 13.3%, Respectively, Year On Year
The Most Active Liquefied Petroleum Gas (LPG) Futures Contract Surged 8.00% Intraday, Currently Trading At 5654.00 Yuan/ton. The Most Active Paraxylene (PX) Futures Contract Saw Its Intraday Gains Widen To 4.00%, Currently Trading At 8434 Yuan/ton
In 2025, The National Development And Reform Commission's Total Expenditure On Government Centralized Procurement Amounted To RMB 22.4448 Million
The Main Methanol Futures Contract Surged 6.00% Intraday, Currently Trading At 2795.00 Yuan/ton
MIIT: In The First Half Of The Year, The Value Added Of Industrial Enterprises Above Designated Size Increased By 5.4% Year On Year

Euro Zone CPI YoY (Excl. Tobacco) (Jun)--
F: --
P: --
Euro Zone HICP Final YoY (Jun)A:--
F: --
P: --
Euro Zone Core CPI Final YoY (Jun)A:--
F: --
P: --
Euro Zone Core CPI Final MoM (Jun)A:--
F: --
P: --
U.S. Total Building Permits (SA) (Jun)A:--
F: --
P: --
U.S. Annual New Housing Starts (SA) (Jun)A:--
F: --
P: --
U.S. Import Price Index YoY (Jun)A:--
F: --
P: --
U.S. Building Permits MoM (SA) (Jun)A:--
F: --
P: --
U.S. Export Price Index YoY (Jun)A:--
F: --
P: --
U.S. Import Price Index MoM (Jun)A:--
F: --
P: --
U.S. New Housing Starts Annualized MoM (SA) (Jun)A:--
F: --
P: --
U.S. Export Price Index MoM (Jun)A:--
F: --
P: --
U.S. Industrial Output MoM (SA) (Jun)A:--
F: --
P: --
U.S. Manufacturing Output MoM (SA) (Jun)A:--
F: --
P: --
U.S. Capacity Utilization MoM (SA) (Jun)A:--
F: --
P: --
U.S. Industrial Output YoY (Jun)--
F: --
P: --
U.S. Manufacturing Capacity Utilization (Jun)A:--
F: --
P: --
U.S. 5-10 Year-Ahead Inflation Expectations (Jul)A:--
F: --
P: --
U.S. UMich 1-Year-Ahead Inflation Expectations Prelim (Jul)A:--
F: --
P: --
U.S. UMich Consumer Sentiment Index Prelim (Jul)A:--
F: --
P: --
U.S. UMich Current Economic Conditions Index Prelim (Jul)A:--
F: --
P: --
U.S. UMich Consumer Expectations Index Prelim (Jul)A:--
F: --
P: --
Russia PPI YoY (Jun)--
F: --
P: --
Russia PPI MoM (Jun)--
F: --
P: --
U.S. Weekly Total Oil Rig CountA:--
F: --
P: --
U.S. Weekly Total Rig CountA:--
F: --
P: --
U.K. Rightmove House Price Index YoY (Jul)A:--
F: --
P: --
US President Trump delivered a speech
China, Mainland 5-Year Loan Prime RateA:--
F: --
P: --
China, Mainland 1-Year Loan Prime Rate (LPR)A:--
F: --
P: --
Germany PPI YoY (Jun)--
F: --
P: --
Germany PPI MoM (Jun)--
F: --
P: --
Euro Zone Construction Output MoM (SA) (May)--
F: --
P: --
Euro Zone Construction Output YoY (May)--
F: --
P: --
Canada National Economic Confidence Index--
F: --
P: --
Canada Core CPI YoY (Jun)--
F: --
P: --
Canada Core CPI MoM (Jun)--
F: --
P: --
Canada Trimmed CPI YoY (SA) (Jun)--
F: --
P: --
Canada CPI YoY (Jun)--
F: --
P: --
Canada CPI MoM (Jun)--
F: --
P: --
U.S. Conference Board Leading Economic Index MoM (Jun)--
F: --
P: --
U.S. Conference Board Coincident Economic Index MoM (Jun)--
F: --
P: --
U.S. Conference Board Leading Economic Index (Jun)--
F: --
P: --
U.S. Conference Board Lagging Economic Index MoM (Jun)--
F: --
P: --
Argentina Trade Balance (Jun)--
F: --
P: --
U.K. Average Weekly Earnings (3-Month Average, Including Bonuses) YoY (May)--
F: --
P: --
U.K. 3-Month ILO Employment Change (May)--
F: --
P: --
U.K. Average Weekly Earnings (3-Month Average, Excluding Bonuses) YoY (May)--
F: --
P: --
U.K. Unemployment Rate (Jun)--
F: --
P: --
U.K. Unemployment Claimant Count (Jun)--
F: --
P: --
U.K. 3-Month ILO Unemployment Rate (May)--
F: --
P: --
Germany ZEW Current Conditions Index (Jul)--
F: --
P: --
Euro Zone ZEW Economic Sentiment Index (Jul)--
F: --
P: --
Germany ZEW Economic Sentiment Index (Jul)--
F: --
P: --
Euro Zone ZEW Current Conditions Index (Jul)--
F: --
P: --
Mexico Retail Sales MoM (May)--
F: --
P: --
South Korea PPI MoM (Jun)--
F: --
P: --
Japan Exports YoY (Jun)--
F: --
P: --
Japan Goods Trade Balance (SA) (Jun)--
F: --
P: --
Japan Imports YoY (Jun)--
F: --
P: --


No matching data
Internal divisions and leadership questions at the Fed, plus rate cut history, threaten the bull market.
For the better part of seven years, optimists have dominated Wall Street, pushing the S&P 500, Dow Jones Industrial Average, and Nasdaq Composite to new heights. While history suggests major stock indexes trend upward over the long run, the journey is rarely a straight line. Right now, the biggest risk to the ongoing bull market may be the one institution designed to provide stability: the U.S. Federal Reserve.
A perfect storm of internal division, leadership uncertainty, and ominous historical patterns is brewing at the central bank, creating a scenario that could halt the market rally in its tracks.
The Federal Reserve's core mission is to manage U.S. monetary policy to maximize employment and keep prices stable. Its primary tool is the federal funds rate, the overnight lending rate for banks, which influences borrowing costs across the entire economy. These decisions are made by the 12-member Federal Open Market Committee (FOMC), led by Fed Chair Jerome Powell.
Markets can tolerate a policy mistake from a unified central bank. What they historically cannot stand is a central bank at war with itself.

Recently, dissent within the FOMC has become alarmingly common. Each of the last four meetings has seen at least one member disagree with the consensus decision. More significantly, the October and December meetings featured dissents in opposite directions—one member wanting no rate cut while another pushed for a larger 50-basis-point cut instead of the 25-basis-point reduction that was approved.
This is exceptionally rare. In the last 36 years, opposing dissents have occurred in only three FOMC meetings, and two of them happened in the last three months. This level of division erodes confidence and makes the Fed's future actions dangerously unpredictable.
Compounding this problem is a looming leadership change. Jerome Powell's term as Fed chair is set to expire on May 15, 2026. With President Trump's nominee still unknown, this adds another thick layer of uncertainty over a central bank already struggling with its direction.
On the surface, lower interest rates seem like a clear positive for stocks. Cheaper borrowing should encourage businesses to hire, invest, and innovate. However, history tells a different and more cautionary tale.
The Fed doesn't typically begin cutting rates unless it sees significant trouble brewing in the economy. As a result, the start of a rate-easing cycle has often preceded major market downturns, not rallies.
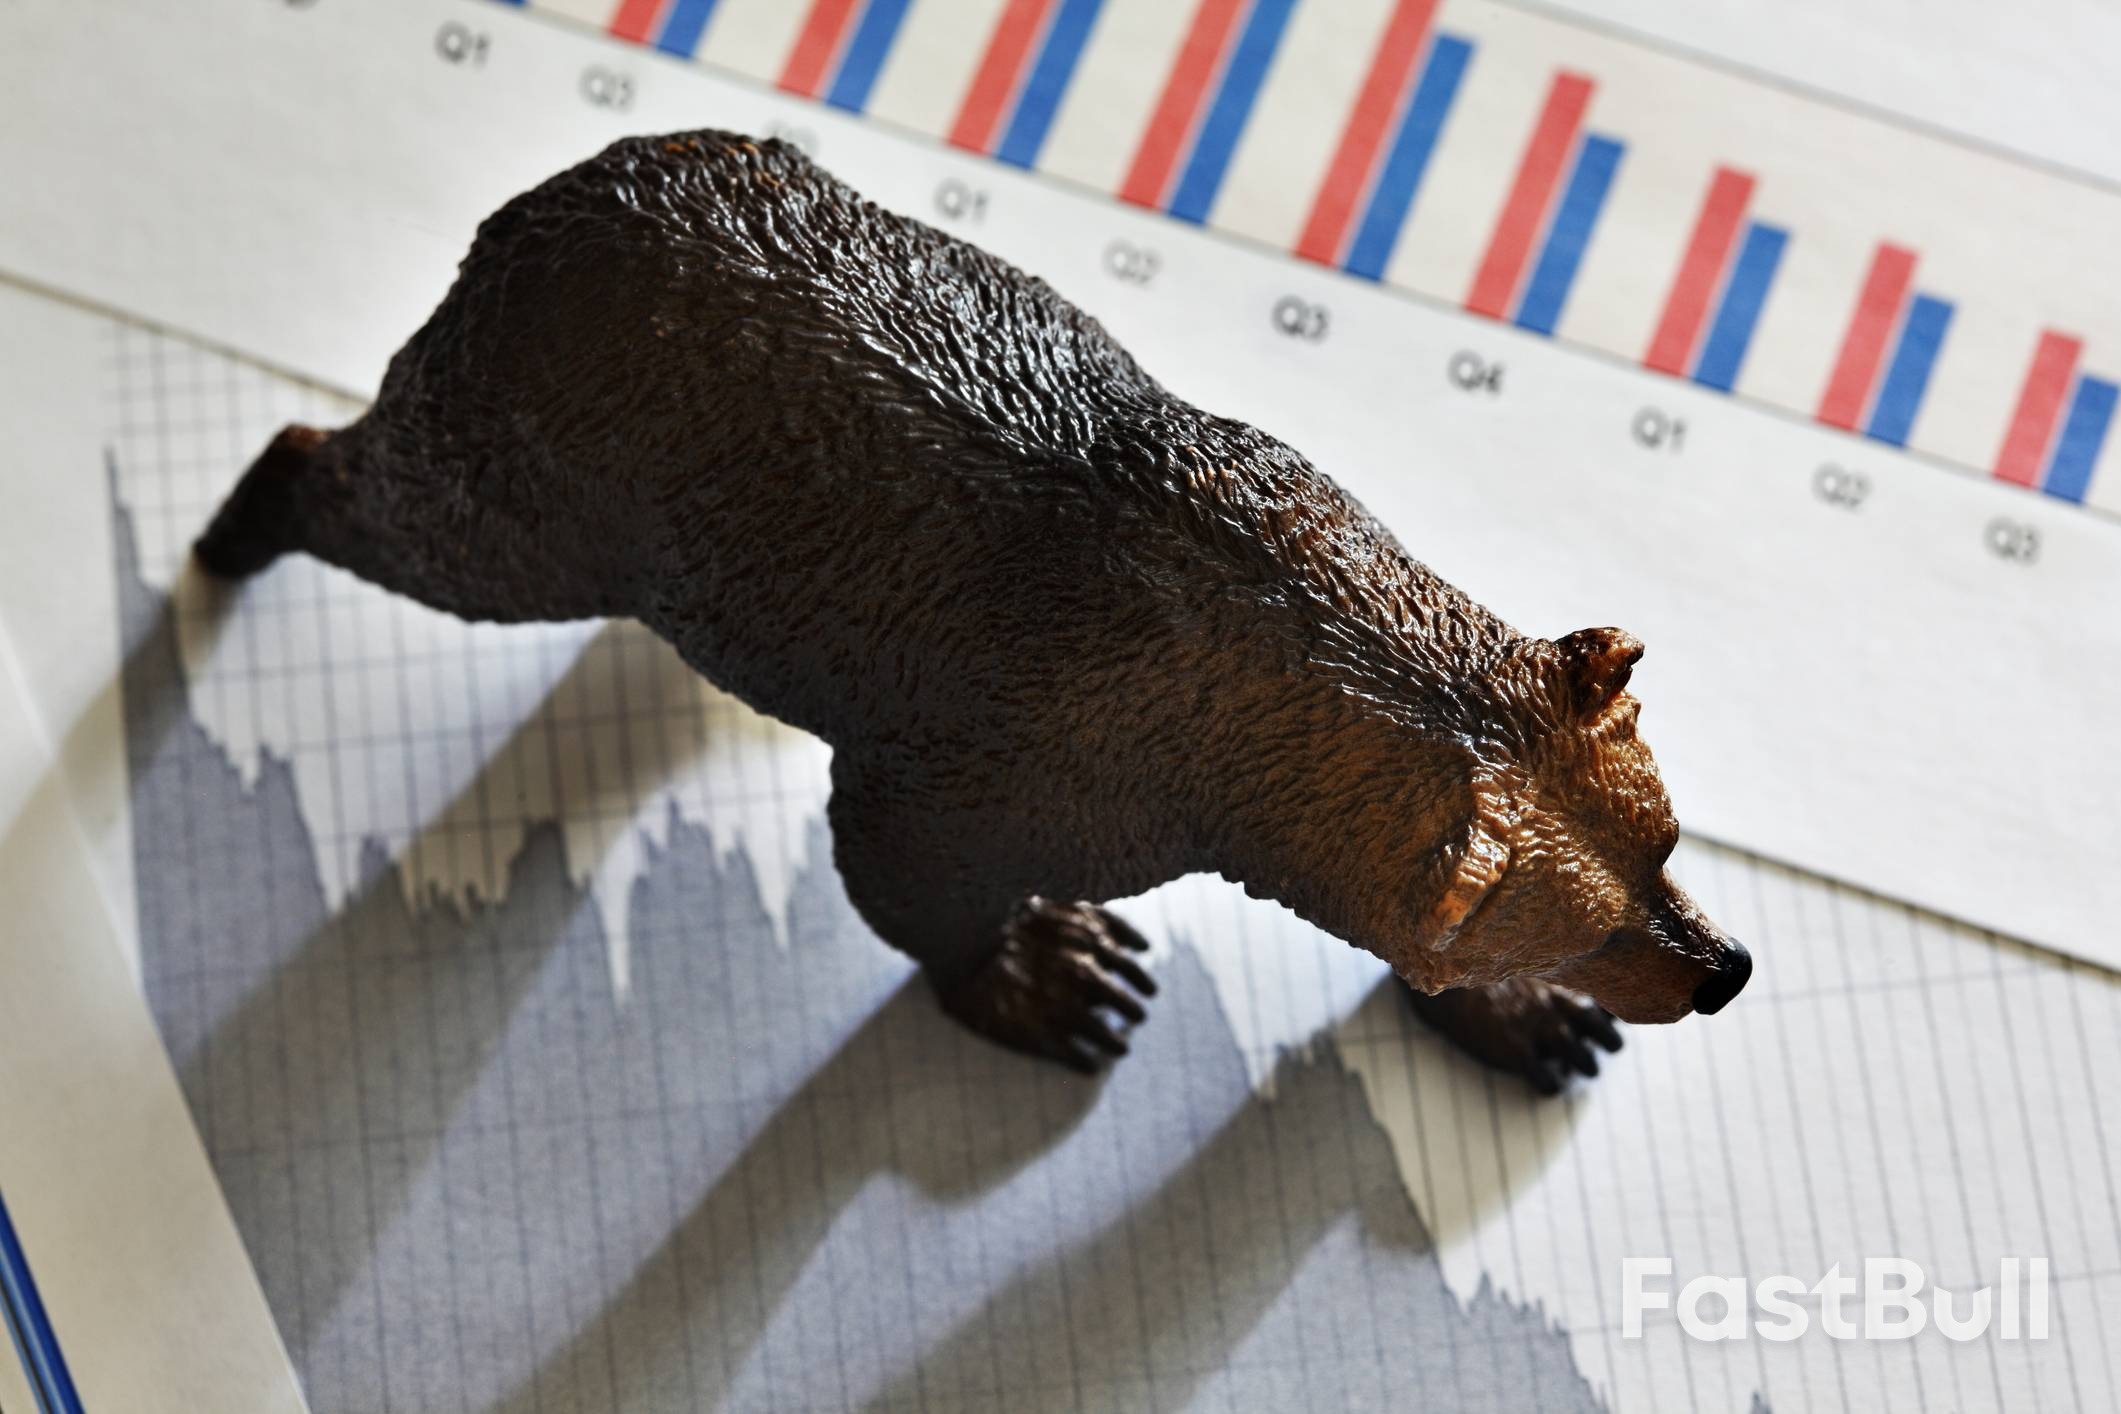
Looking at the last three major rate-cutting cycles this century, a clear pattern emerges where stocks plunged well after the Fed started easing.
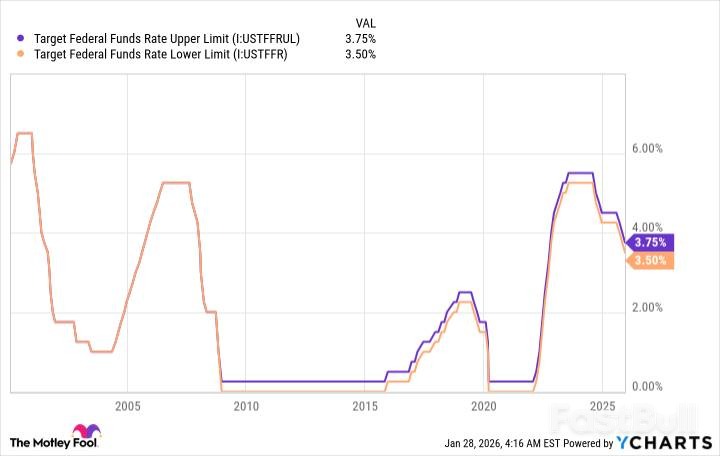
• Dot-Com Bubble (2001): The FOMC began cutting rates on January 3, 2001, eventually slashing them by 475 basis points. The stock market didn't hit its bottom until 645 days after that first cut.
• Financial Crisis (2007): The Fed started easing on September 18, 2007, ultimately taking rates from 5% down to near zero. It took 538 days from that initial cut for the major indexes to find their floor.
• COVID-19 Crash (2019): Before the pandemic-induced crash, the Fed began cutting rates on August 1, 2019. The market bottomed out 236 days later.
This historical precedent, combined with the Fed's internal division and leadership questions, creates a potent mix of risks for investors. While the long-term outlook for stocks remains positive, 2026 is shaping up to be a volatile and potentially vulnerable period for the market.
The risk of loss in trading financial instruments such as stocks, FX, commodities, futures, bonds, ETFs and crypto can be substantial. You may sustain a total loss of the funds that you deposit with your broker. Therefore, you should carefully consider whether such trading is suitable for you in light of your circumstances and financial resources.
No decision to invest should be made without thoroughly conducting due diligence by yourself or consulting with your financial advisors. Our web content might not suit you since we don't know your financial conditions and investment needs. Our financial information might have latency or contain inaccuracy, so you should be fully responsible for any of your trading and investment decisions. The company will not be responsible for your capital loss.
Without getting permission from the website, you are not allowed to copy the website's graphics, texts, or trademarks. Intellectual property rights in the content or data incorporated into this website belong to its providers and exchange merchants.
Not Logged In
Log in to access more features
Log In
Sign Up