- EURUSD
- XAUUSD
- XAGUSD
- WTI
- USDX
Markets
Analysis
User
24/7
Economic Calendar
Education
Data
- Names
- Latest
- Prev


Signal Accounts for Members
All Signal Accounts
All Contests


BOE Technology Group Co., Ltd. (A-share) Recorded A Trading Volume Of RMB 30 Billion And Is Currently Down 6.59%
Shanghai Tin Futures Contract 2608 Rose During The Session, With Gains Widening To 1.94%, And Last Quoted At 403,890 Yuan/ton; The Trading Volume Was Approximately 107.015 Billion Yuan, With An Increase Of Nearly 3,900 Lots In Open Interest During The Day, And Both Trading Volume And Open Interest Activity Increased Simultaneously
Styrene 2608 Futures Rose During The Session, With Gains Widening To 2.40%, And Last Quoted At 7395 Yuan/ton; The Trading Volume Was Approximately 10.01 Billion Yuan, With Nearly 7100 Lots Of Open Interest Decreasing During The Day, Showing A Trend Of Rising Prices With Reduced Open Interest
Citigroup: Oil Prices May Fall To $60 As The Impact Of The Strait Of Hormuz Gradually Subsides
The South Korean Presidential Office Announced That South Korean President Lee Jae-myung Will Visit Mongolia From July 9 To 11
European Central Bank President Lagarde Hinted That She Might Run In The French Presidential Election
The South Korean Presidential Office Announced That South Korean President Lee Jae-myung Will Attend The NATO Summit In Ankara From July 7 To 8
The China Earthquake Networks Center Officially Determined That A Magnitude 3.0 Earthquake Occurred At 12:44 On July 3 In Haixi Prefecture, Qinghai Province (37.86 Degrees North Latitude, 95.40 Degrees East Longitude), With A Focal Depth Of 10 Kilometers
This Year's No. 10 Typhoon, "Maysak," Is Expected To Make Landfall In Hainan, Becoming The First Typhoon To Strike China This Year
Russian News Outlet Vesti Reports That Local Officials Say An Industrial Facility In Russia’s Belgorod Region Caught Fire Following An Attack By Ukraine
The China Earthquake Networks Center Officially Reported That A 6.2-magnitude Earthquake Occurred At 10:31 A.m. On July 3 In The Sea Area Near Halmahera Island, Indonesia (1.85 Degrees North Latitude, 127.40 Degrees East Longitude), With A Focal Depth Of 120 Kilometers

France 10-Year OAT Auction Avg. YieldA:--
F: --
P: --
Euro Zone Unemployment Rate (May)A:--
F: --
U.S. Government Employment (Jun)A:--
F: --
P: --
U.S. Average Hourly Wage MoM (SA) (Jun)A:--
F: --
P: --
U.S. U6 Unemployment Rate (SA) (Jun)A:--
F: --
P: --
U.S. Unemployment Rate (SA) (Jun)A:--
F: --
P: --
U.S. Nonfarm Payrolls (SA) (Jun)A:--
F: --
U.S. Weekly Initial Jobless Claims (SA)A:--
F: --
U.S. Average Hourly Wage YoY (Jun)A:--
F: --
P: --
U.S. Average Weekly Working Hours (SA) (Jun)A:--
F: --
P: --
U.S. Initial Jobless Claims 4-Week Avg. (SA)A:--
F: --
U.S. Weekly Continued Jobless Claims (SA)A:--
F: --
U.S. Private Nonfarm Payrolls (SA) (Jun)A:--
F: --
U.S. Manufacturing Employment (SA) (Jun)A:--
F: --
U.S. Labor Force Participation Rate (SA) (Jun)A:--
F: --
P: --
Canada Manufacturing PMI (SA) (Jun)A:--
F: --
P: --
U.S. Factory Orders MoM (Excl. Defense) (May)A:--
F: --
P: --
U.S. Factory Orders MoM (May)A:--
F: --
U.S. Factory Orders MoM (Excl. Transport) (May)A:--
F: --
U.S. EIA Weekly Natural Gas Stocks ChangeA:--
F: --
P: --
U.S. Weekly Total Oil Rig CountA:--
F: --
P: --
U.S. Weekly Total Rig CountA:--
F: --
P: --
U.S. Weekly Treasuries Held by Foreign Central BanksA:--
F: --
P: --
Japan IHS Markit Composite PMI (Jun)A:--
F: --
P: --
Japan IHS Markit Services PMI (Jun)A:--
F: --
P: --
China, Mainland Caixin Composite PMI (Jun)A:--
F: --
P: --
China, Mainland Caixin Services PMI (Jun)A:--
F: --
P: --
India IHS Markit Composite PMI (Jun)A:--
F: --
P: --
India HSBC Services PMI Final (Jun)A:--
F: --
P: --
Russia IHS Markit Services PMI (Jun)A:--
F: --
P: --
France Industrial Output MoM (SA) (May)--
F: --
P: --
Turkey PPI YoY (Jun)--
F: --
P: --
Turkey CPI YoY (Jun)--
F: --
P: --
South Africa IHS Markit Composite PMI (SA) (Jun)--
F: --
P: --
Italy Composite PMI (Jun)--
F: --
P: --
Italy Services PMI (SA) (Jun)--
F: --
P: --
Germany Composite PMI Final (SA) (Jun)--
F: --
P: --
Italy Retail Sales MoM (SA) (May)--
F: --
P: --
Euro Zone Composite PMI Final (Jun)--
F: --
P: --
Euro Zone Services PMI Final (Jun)--
F: --
P: --
U.K. Composite PMI Prelim (Jun)--
F: --
P: --
U.K. Services PMI Prelim (Jun)--
F: --
P: --
U.K. Official Reserves Changes (Jun)--
F: --
P: --
Turkey Trade Balance (Jun)--
F: --
P: --
Mexico Consumer Confidence Index (Jun)--
F: --
P: --
Brazil IHS Markit Composite PMI (Jun)--
F: --
P: --
Brazil IHS Markit Services PMI (Jun)--
F: --
P: --
Saudi Arabia IHS Markit Composite PMI (Jun)--
F: --
P: --
Germany Construction PMI (SA) (Jun)--
F: --
P: --
Euro Zone Sentix Investor Confidence Index (Jul)--
F: --
P: --
U.K. Markit/CIPS Construction PMI (Jun)--
F: --
P: --
Euro Zone PPI MoM (May)--
F: --
P: --
Euro Zone PPI YoY (May)--
F: --
P: --
Euro Zone Retail Sales MoM (May)--
F: --
P: --
Euro Zone Retail Sales YoY (May)--
F: --
P: --
Canada National Economic Confidence Index--
F: --
P: --
U.S. ISM Non-Manufacturing PMI (Jun)--
F: --
P: --
U.S. ISM Non-Manufacturing Inventories Index (Jun)--
F: --
P: --
U.S. ISM Non-Manufacturing Employment Index (Jun)--
F: --
P: --
U.S. ISM Non-Manufacturing New Orders Index (Jun)--
F: --
P: --


No matching data
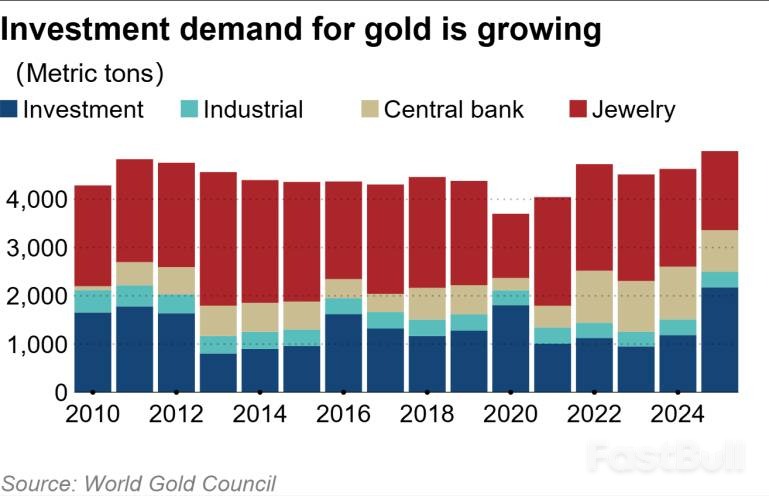
Gold prices hit new highs in 2025, driven by an 84% surge in investor demand amid geopolitical risks.
Investor demand for gold skyrocketed by 84% last year as mounting geopolitical risks and economic turbulence sent investors scrambling for safe-haven assets. According to statistics from the World Gold Council, this surge pushed the average London spot price to a new high of $3,431.5 per troy ounce, a 44% increase from 2024.
While overall gold demand edged up by just 1% to 5,002.3 metric tons, its value soared 45% to a record $555 billion, underscoring the impact of higher prices.
The primary engine behind gold's record-breaking year was investment demand, which climbed to 2,175.3 tons. This figure represents 60% of the 3,671.6 tons mined in 2025, a sharp increase from the roughly 30% share seen between 2021 and 2024.
Several factors fueled this rush into gold:
• Geopolitical Instability: Worsening global tensions prompted a flight to the tangible security of gold.
• Economic Concerns: Uncertainty stemming from U.S. tariff policies drove investors to hedge their portfolios.
• Diversification: Concerns about a weakening U.S. dollar and elevated stock prices made gold an attractive alternative for diversification.
This influx of capital created a self-reinforcing cycle, where daily price highs attracted even more money from investors seeking to capitalize on the upward momentum.

The most dramatic shift occurred in exchange-traded funds (ETFs) backed by physical gold. After seeing a net outflow of 2.9 tons in 2024, these funds experienced a massive net inflow of 801.2 tons last year.
The regional breakdown of ETF inflows was led by North America:
• North America: Funds based in the region accounted for 446 tons, over half of the global total.
• Asia: The region saw the second-largest inflow at 215 tons.
• Europe: Net inflows reached 131 tons, a figure tempered by significant profit-taking in October.
Demand for physical gold bars and coins also saw strong growth, rising 16% to 1,374.1 tons.
This trend was particularly evident in China, a major gold market. While Chinese demand for gold jewelry fell by 25%, demand for bars and coins climbed 28%. This shift reflects a broader global pattern, as worldwide jewelry demand dropped 18% to 1,542.3 tons, largely due to slowing consumption in both India and China.
Central banks, which had been buying over 1,000 tons of gold annually for the previous three years, slowed their pace in 2025. Purchases fell by 20% to 863 tons, as record-high prices likely prompted a more cautious approach.
However, this level of buying is still significantly higher than the annual average of 473 tons recorded between 2010 and 2021. This indicates that the strategic appetite for gold among the world's central banks remains strong, even at elevated prices.
The risk of loss in trading financial instruments such as stocks, FX, commodities, futures, bonds, ETFs and crypto can be substantial. You may sustain a total loss of the funds that you deposit with your broker. Therefore, you should carefully consider whether such trading is suitable for you in light of your circumstances and financial resources.
No decision to invest should be made without thoroughly conducting due diligence by yourself or consulting with your financial advisors. Our web content might not suit you since we don't know your financial conditions and investment needs. Our financial information might have latency or contain inaccuracy, so you should be fully responsible for any of your trading and investment decisions. The company will not be responsible for your capital loss.
Without getting permission from the website, you are not allowed to copy the website's graphics, texts, or trademarks. Intellectual property rights in the content or data incorporated into this website belong to its providers and exchange merchants.
Not Logged In
Log in to access more features
Log In
Sign Up