• Trade
  • Markets
  • Copy
  • Contests
  • News
  • 24/7
  • Calendar
  • Q&A
  • Chats
Trending
Screeners
SYMBOL
LAST
BID
ASK
HIGH
LOW
NET CHG.
%CHG.
SPREAD
SPX
S&P 500 Index
6870.39
6870.39
6870.39
6895.79
6858.28
+13.27
+ 0.19%
--
DJI
Dow Jones Industrial Average
47954.98
47954.98
47954.98
48133.54
47871.51
+104.05
+ 0.22%
--
IXIC
NASDAQ Composite Index
23578.12
23578.12
23578.12
23680.03
23506.00
+72.99
+ 0.31%
--
USDX
US Dollar Index
98.930
99.010
98.930
98.960
98.730
-0.020
-0.02%
--
EURUSD
Euro / US Dollar
1.16490
1.16498
1.16490
1.16717
1.16341
+0.00064
+ 0.05%
--
GBPUSD
Pound Sterling / US Dollar
1.33157
1.33165
1.33157
1.33462
1.33136
-0.00155
-0.12%
--
XAUUSD
Gold / US Dollar
4211.86
4212.20
4211.86
4218.85
4190.61
+13.95
+ 0.33%
--
WTI
Light Sweet Crude Oil
59.267
59.297
59.267
60.084
59.160
-0.542
-0.91%
--

Community Accounts

Signal Accounts
--
Profit Accounts
--
Loss Accounts
--
View More

Become a signal provider

Sell trading signals to earn additional income

View More

Guide to Copy Trading

Get started with ease and confidence

View More

Signal Accounts for Members

All Signal Accounts

Best Return
  • Best Return
  • Best P/L
  • Best MDD
Past 1W
  • Past 1W
  • Past 1M
  • Past 1Y

All Contests

  • All
  • Trump Updates
  • Recommend
  • Stocks
  • Cryptocurrencies
  • Central Banks
  • Featured News
Top News Only
Share

S.Africa's Eskom Says Regulator Nersa Is Processing An Application For An Interim Tariff Adjustment For The Smelters, While Government Is Working On A Complementary Mechanism To Support A More Competitive Pricing Path For The Sector

Share

SEBI: Modalities For Migration To Ai Only Schemes And Relaxations To Large Value Funds For Accredited Investors

Share

All 6 Bank Of Israel Monetary Policy Committee Members Voted To Lower Benchmark Interest Rate 25 Bps To 4.25% On Nov 24

Share

India Government: Cancellations Are On Account Of Developer Delays And Not Due To Transmission Side Delays

Share

Fitch: We See Moderation Of Export Performance In China In 2026

Share

India Government: Revokes Grid Access Permissions For Renewable Energy Projects

Share

Stats Office - Tanzania Inflation At 3.4% Year-On-Year In November

Share

Temasek CEO Dilhan Pillay: We Are Taking A Conservative Stance On Allocating Capital

Share

Brazil Economists See Brazilian Real At 5.40 Per Dollar By Year-End 2025 Versus 5.40 In Previous Estimate - Central Bank Poll

Share

Brazil Economists See Year-End 2026 Interest Rate Selic At 12.25% Versus 12.00% In Previous Estimate - Central Bank Poll

Share

Brazil Economists See Year-End 2025 Interest Rate Selic At 15.00% Versus 15.00% In Previous Estimate - Central Bank Poll

Share

EU Commission Says Meta Has Committed To Give EU Users Choice On Personalised Ads

Share

Sources Revealed That The Bank Of England Has Invited Employees To Voluntarily Apply For Layoffs

Share

The Bank Of England Plans To Cut Staff Due To Budget Pressures

Share

Traders Believe There Is Less Than A 10% Chance That The European Central Bank Will Cut Interest Rates By 25 Basis Points In 2026

Share

Egypt, European Bank For Reconstruction And Development Sign $100 Million Financing Agreement

Share

Israel Budget Deficit 4.5% Of GDP In November Over Past 12 Months Versus 4.9% Deficit In October

Share

JPMorgan - Council Chaired By Jamie Dimon Includes Jeff Bezos

Share

UK Government: UK Health Security Agency Identified New Recombinant Mpox Virus In England In Individual Who Had Recently Travelled To Asia

Share

European Central Bank Governing Council Member Kazimir: I See No Reason To Change Rates In The Coming Months, Definitely No In December

TIME
ACT
FCST
PREV
France Industrial Output MoM (SA) (Oct)

A:--

F: --

P: --
France Trade Balance (SA) (Oct)

A:--

F: --

P: --
Euro Zone Employment YoY (SA) (Q3)

A:--

F: --

P: --
Canada Part-Time Employment (SA) (Nov)

A:--

F: --

P: --

Canada Unemployment Rate (SA) (Nov)

A:--

F: --

P: --

Canada Full-time Employment (SA) (Nov)

A:--

F: --

P: --

Canada Labor Force Participation Rate (SA) (Nov)

A:--

F: --

P: --

Canada Employment (SA) (Nov)

A:--

F: --

P: --

U.S. PCE Price Index MoM (Sept)

A:--

F: --

P: --

U.S. Personal Income MoM (Sept)

A:--

F: --

P: --

U.S. Core PCE Price Index MoM (Sept)

A:--

F: --

P: --

U.S. PCE Price Index YoY (SA) (Sept)

A:--

F: --

P: --

U.S. Core PCE Price Index YoY (Sept)

A:--

F: --

P: --

U.S. Personal Outlays MoM (SA) (Sept)

A:--

F: --

P: --
U.S. 5-10 Year-Ahead Inflation Expectations (Dec)

A:--

F: --

P: --

U.S. Real Personal Consumption Expenditures MoM (Sept)

A:--

F: --

P: --
U.S. Weekly Total Rig Count

A:--

F: --

P: --

U.S. Weekly Total Oil Rig Count

A:--

F: --

P: --

U.S. Consumer Credit (SA) (Oct)

A:--

F: --

P: --
China, Mainland Foreign Exchange Reserves (Nov)

A:--

F: --

P: --

Japan Trade Balance (Oct)

A:--

F: --

P: --

Japan Nominal GDP Revised QoQ (Q3)

A:--

F: --

P: --

China, Mainland Imports YoY (CNH) (Nov)

A:--

F: --

P: --

China, Mainland Exports (Nov)

A:--

F: --

P: --

China, Mainland Imports (CNH) (Nov)

A:--

F: --

P: --

China, Mainland Trade Balance (CNH) (Nov)

A:--

F: --

P: --

China, Mainland Exports YoY (USD) (Nov)

A:--

F: --

P: --

China, Mainland Imports YoY (USD) (Nov)

A:--

F: --

P: --

Germany Industrial Output MoM (SA) (Oct)

A:--

F: --

P: --
Euro Zone Sentix Investor Confidence Index (Dec)

A:--

F: --

P: --

Canada National Economic Confidence Index

--

F: --

P: --

U.K. BRC Like-For-Like Retail Sales YoY (Nov)

--

F: --

P: --

U.K. BRC Overall Retail Sales YoY (Nov)

--

F: --

P: --

Australia Overnight (Borrowing) Key Rate

--

F: --

P: --

RBA Rate Statement
RBA Press Conference
Germany Exports MoM (SA) (Oct)

--

F: --

P: --

U.S. NFIB Small Business Optimism Index (SA) (Nov)

--

F: --

P: --

Mexico 12-Month Inflation (CPI) (Nov)

--

F: --

P: --

Mexico Core CPI YoY (Nov)

--

F: --

P: --

Mexico PPI YoY (Nov)

--

F: --

P: --

U.S. Weekly Redbook Index YoY

--

F: --

P: --

U.S. JOLTS Job Openings (SA) (Oct)

--

F: --

P: --

China, Mainland M1 Money Supply YoY (Nov)

--

F: --

P: --

China, Mainland M0 Money Supply YoY (Nov)

--

F: --

P: --

China, Mainland M2 Money Supply YoY (Nov)

--

F: --

P: --

U.S. EIA Short-Term Crude Production Forecast For The Year (Dec)

--

F: --

P: --

U.S. EIA Natural Gas Production Forecast For The Next Year (Dec)

--

F: --

P: --

U.S. EIA Short-Term Crude Production Forecast For The Next Year (Dec)

--

F: --

P: --

EIA Monthly Short-Term Energy Outlook
U.S. API Weekly Gasoline Stocks

--

F: --

P: --

U.S. API Weekly Cushing Crude Oil Stocks

--

F: --

P: --

U.S. API Weekly Crude Oil Stocks

--

F: --

P: --

U.S. API Weekly Refined Oil Stocks

--

F: --

P: --

South Korea Unemployment Rate (SA) (Nov)

--

F: --

P: --

Japan Reuters Tankan Non-Manufacturers Index (Dec)

--

F: --

P: --

Japan Reuters Tankan Manufacturers Index (Dec)

--

F: --

P: --

Japan Domestic Enterprise Commodity Price Index MoM (Nov)

--

F: --

P: --

Japan Domestic Enterprise Commodity Price Index YoY (Nov)

--

F: --

P: --

China, Mainland PPI YoY (Nov)

--

F: --

P: --

China, Mainland CPI MoM (Nov)

--

F: --

P: --

Q&A with Experts
    • All
    • Chatrooms
    • Groups
    • Friends
    Connecting
    .
    .
    .
    Type here...
    Add Symbol or Code

      No matching data

      All
      Trump Updates
      Recommend
      Stocks
      Cryptocurrencies
      Central Banks
      Featured News
      • All
      • Russia-Ukraine Conflict
      • Middle East Flashpoint
      • All
      • Russia-Ukraine Conflict
      • Middle East Flashpoint
      Search
      Products

      Charts Free Forever

      Chats Q&A with Experts
      Screeners Economic Calendar Data Tools
      Membership Features
      Data Warehouse Market Trends Institutional Data Policy Rates Macro

      Market Trends

      Market Sentiment Order Book Forex Correlations

      Top Indicators

      Charts Free Forever
      Markets

      News

      News Analysis 24/7 Columns Education
      From Institutions From Analysts
      Topics Columnists

      Latest Views

      Latest Views

      Trending Topics

      Top Columnists

      Latest Update

      Signals

      Copy Rankings Latest Signals Become a signal provider AI Rating
      Contests
      Brokers

      Overview Brokers Assessment Rankings Regulators News Claims
      Broker listing Forex Brokers Comparison Tool Live Spread Comparison Scam
      Q&A Complaint Scam Alert Videos Tips to Detect Scam
      More

      Business
      Events
      Careers About Us Advertising Help Center

      White Label

      Data API

      Web Plug-ins

      Affiliate Program

      Awards Institution Evaluation IB Seminar Salon Event Exhibition
      Vietnam Thailand Singapore Dubai
      Fans Party Investment Sharing Session
      FastBull Summit BrokersView Expo
      Recent Searches
        Top Searches
          Markets
          News
          Analysis
          User
          24/7
          Economic Calendar
          Education
          Data
          • Names
          • Latest
          • Prev

          View All

          No data

          Scan to Download

          Faster Charts, Chat Faster!

          Download App
          English
          • English
          • Español
          • العربية
          • Bahasa Indonesia
          • Bahasa Melayu
          • Tiếng Việt
          • ภาษาไทย
          • Français
          • Italiano
          • Türkçe
          • Русский язык
          • 简中
          • 繁中
          Open Account
          Search
          Products
          Charts Free Forever
          Markets
          News
          Signals

          Copy Rankings Latest Signals Become a signal provider AI Rating
          Contests
          Brokers

          Overview Brokers Assessment Rankings Regulators News Claims
          Broker listing Forex Brokers Comparison Tool Live Spread Comparison Scam
          Q&A Complaint Scam Alert Videos Tips to Detect Scam
          More

          Business
          Events
          Careers About Us Advertising Help Center

          White Label

          Data API

          Web Plug-ins

          Affiliate Program

          Awards Institution Evaluation IB Seminar Salon Event Exhibition
          Vietnam Thailand Singapore Dubai
          Fans Party Investment Sharing Session
          FastBull Summit BrokersView Expo

          German Industrial Production Jumps, Supporting Economic Rebound

          Olivia Brooks

          Economic

          Summary:

          German industrial production rose much more than anticipated, supporting assumptions that the economy will return to growth in the final quarter of 2025.

          German industrial production rose much more than anticipated, supporting assumptions that the economy will return to growth in the final quarter of 2025.

          Output increased 1.8% from the previous month in October, up from a revised 1.1% in September, Destatis said in a statement. That surpassed analyst estimates for a 0.3% gain.

          The advance was driven by construction, machinery and electronics products, though output in the car industry fell, the statistics agency said.

          Europe's largest economy was boosted by trade at the start of the year as companies rushed to avoid US tariffs. A reversal of that effect weighed on output in the following months, almost tipping the country into another recession.

          Germany may see slight growth in the fourth quarter as exports and the manufacturing sector in general "stabilize," the Bundesbank said last month. A significant pickup is forecast next year thanks to government spending on infrastructure on defense.

          Factory orders also rose in October, driven by large-scale orders — in particular a 87% jump in the transport category that includes aircraft, ships, trains and military vehicles, data Friday showed.

          Industrial firms have still rung the alarm due to their worsening competitive position. The influential BDI business lobby said last week that every month without effective structural reforms will cost more jobs and prosperity.

          Surveys by S&P Global last month confirmed the important manufacturing sector still faces significant challenges, with an activity index falling to a nine-month low. Firms have frequently complained about excessive red tape, high labor costs and growing competition from China.

          Source: Bloomberg Europe

          To stay updated on all economic events of today, please check out our Economic calendar
          Risk Warnings and Disclaimers
          You understand and acknowledge that there is a high degree of risk involved in trading. Following any strategies or investment methods may lead to potential losses. The content on the site is provided by our contributors and analysts for information purposes only. You are solely responsible for determining whether any trading assets, securities, strategy, or any other product is suitable for investing based on your own investment objectives and financial situation.
          Add to Favorites
          Share

          China’s Chip IPO Frenzy Heats Up as Moore Threads Ignites Retail Investor Mania

          Gerik

          Economic

          Moore Threads’ Breakout Debut Fuels Semiconductor IPO Rush

          China’s domestic chip industry is experiencing a dramatic surge in investor enthusiasm, as evidenced by overwhelming retail participation in two upcoming semiconductor IPOs. Following Moore Threads Technology Co.’s sensational 425% surge on its trading debut last Friday, retail investors poured into offerings from MetaX Integrated Circuits Shanghai Co. and Beijing Onmicro Electronics Co., resulting in subscription rates of 2,986 and 2,899 times, respectively. These figures reflect an extraordinary level of retail optimism tied closely to China’s broader push to cultivate a self-reliant semiconductor ecosystem.
          Moore Threads’ market debut acted as a key trigger, with investors interpreting its skyrocketing price performance as both a vote of confidence in Chinese chipmaking capability and a sign of strong upside potential for similar firms. Prior to listing, Moore Threads’ own IPO was oversubscribed by around 2,750 times, already signaling the level of anticipation building within retail segments. The post-listing 425% spike further validated the bullish narrative, amplifying sentiment around peers like MetaX and Onmicro.
          The causal relationship here is direct: Moore Threads’ successful market entry significantly influenced demand for subsequent IPOs, creating a cascading effect of investor enthusiasm across the sector. The timing of the MetaX and Onmicro subscription windows both coinciding with Moore’s debut reinforces the momentum-driven nature of these investments.

          Policy Support and Regulatory Constraints Shape Market Dynamics

          This fervent activity is not occurring in a vacuum. Beijing’s policy directive to achieve technological independence, especially in semiconductors, has positioned domestic chipmakers as strategic national assets. Companies like Moore Threads, MetaX, and Onmicro are seen as key participants in this mission, particularly as Western export controls tighten access to advanced chips and manufacturing tools.
          Furthermore, China’s IPO market is tightly regulated, with authorities limiting the number of new listings to avoid draining secondary market liquidity. This regulatory bottleneck creates scarcity, which in turn enhances the perceived value of each approved offering. Consequently, investors are driven to aggressively pursue the limited opportunities available, especially in high-profile sectors like AI and semiconductor manufacturing.
          Additionally, a recent downturn in China’s secondary market has led investors to seek returns from primary market opportunities, including IPOs. With risk appetite subdued elsewhere, the IPO channel is emerging as a focal point for capital deployment among retail participants.

          MetaX Aims for Massive Raise Amid High Valuation

          Founded in 2020, MetaX is preparing to raise approximately $585.8 million through its Shanghai debut. The company specializes in graphics processing unit (GPU) chips, operating in a space increasingly critical to AI and data-intensive applications. At an offer price of 104.66 yuan per share, MetaX is set to trade at a price-to-sales ratio of 56.4 times, which, while high, is still significantly below the peer average of 127.4 times projected for 2024. This discount has added to the appeal for investors who see Moore Threads’ success as a benchmark.
          This valuation gap may represent both an opportunity and a risk. On one hand, MetaX is entering the market with relative affordability compared to its peers, which could support a strong first-day performance. On the other, it reflects investor caution about the company’s ability to match Moore Threads’ scale, speed of innovation, or policy alignment in the short term.
          The extraordinary demand for MetaX and Onmicro IPOs underscores a new wave of retail investor confidence in China’s semiconductor sector, driven by Moore Threads’ breakout success and the country’s aggressive drive for technological autonomy. With a tight regulatory environment and heightened geopolitical stakes, Chinese chipmakers are positioned as both financial opportunities and strategic symbols. However, the sector’s sustainability will depend on more than investor sentiment; it must be underpinned by real innovation, competitive performance, and policy clarity as China continues to reshape its role in the global tech supply chain.

          Source: Bloomberg

          To stay updated on all economic events of today, please check out our Economic calendar
          Risk Warnings and Disclaimers
          You understand and acknowledge that there is a high degree of risk involved in trading. Following any strategies or investment methods may lead to potential losses. The content on the site is provided by our contributors and analysts for information purposes only. You are solely responsible for determining whether any trading assets, securities, strategy, or any other product is suitable for investing based on your own investment objectives and financial situation.
          Add to Favorites
          Share

          EUR/USD Holds Firm At Support, Raising Odds Of Additional Gains

          Blue River

          Forex

          Economic

          Technical Analysis

          Key Highlights

          EUR/USD gained pace for a move above the 1.1620 resistance.
          A key bullish trend line is forming with support at 1.1630 on the 4-hour chart.
          GBP/USD started consolidating gains above 1.3300.
          USD/JPY might start a fresh increase if it clears the 156.00 resistance.

          EUR/USD Technical Analysis

          The Euro started a decent increase above 1.1550 against the US Dollar. EUR/USD cleared the key barrier at 1.1600 to enter a positive zone.

          Looking at the 4-hour chart, the pair gained pace for a move above 1.1620. It traded as high as 1.1681 and settled above the 100 simple moving average (red, 4-hour) and the 200 simple moving average (green, 4-hour).

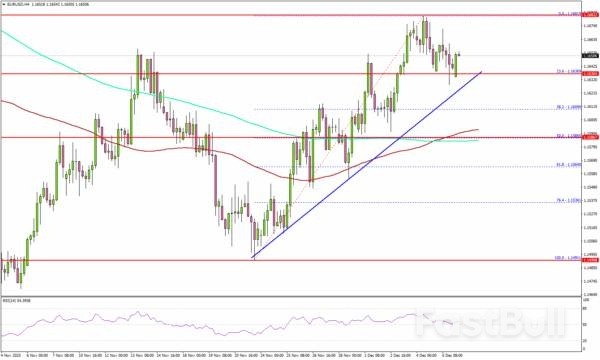
          It is now consolidating gains above 1.1620. There is also a key bullish trend line forming with support at 1.1630. Immediate resistance sits near 1.1660. The first key hurdle is seen near 1.1680.

          A close above 1.1680 could open the doors for a move toward 1.1725. Any more gains could set the pace for a steady increase toward 1.1780.

          On the downside, there is key support at 1.1630 and the trend line at 1.1620. The next support is 1.1580 and the 100 simple moving average (red, 4-hour). A close below the 100 simple moving average (red, 4-hour) could spark a bearish move and send the pair to 1.1510. Any more losses might call for a test of 1.1465.

          Looking at GBP/USD, the pair rallied above 1.3300 and recently started a consolidation phase. The main support sits at 1.3260.

          Source: ACTIONFOREX

          To stay updated on all economic events of today, please check out our Economic calendar
          Risk Warnings and Disclaimers
          You understand and acknowledge that there is a high degree of risk involved in trading. Following any strategies or investment methods may lead to potential losses. The content on the site is provided by our contributors and analysts for information purposes only. You are solely responsible for determining whether any trading assets, securities, strategy, or any other product is suitable for investing based on your own investment objectives and financial situation.
          Add to Favorites
          Share

          China’s Export Recovery Overshadowed by Continued U.S. Trade Weakness Despite Tariff Truce

          Gerik

          Economic

          Export Rebound Masks Deepening U.S. Trade Weakness

          China’s export performance in November 2025 painted a mixed picture. On the surface, total outbound shipments rose 5.9% year-on-year in U.S. dollar terms, significantly outperforming expectations of 3.8% and reversing a contraction seen in October. However, this overall recovery conceals a strikingly poor performance in U.S.-bound trade, with exports to the world’s largest consumer market plummeting 28.6%. This marks the eighth consecutive month of double-digit decline in exports to the U.S., highlighting that the recent tariff truce has yet to restore trade flows between the two economic superpowers.
          Despite the diplomatic breakthrough between President Xi Jinping and President Donald Trump in late October where both sides agreed to suspend several trade restrictions for one year China’s trade with the U.S. continued to deteriorate. Not only did exports collapse, but imports from the U.S. also shrank by 19% compared to a year earlier. These figures suggest that the deal’s impact has not yet materialized in transactional terms, potentially due to residual tariffs still in place (47.5% average on U.S. goods to China and 32% vice versa) and lagged implementation of commitments such as soybean purchases and rare earth access.
          By contrast, China’s exports to other major partners have flourished. Shipments to ASEAN and the EU rose by over 8% and nearly 15%, respectively. This disparity reflects a likely causal relationship between geopolitical alignment and supply chain diversification, as Chinese exporters prioritize regions where policy friction is lower and logistical efficiency is more stable. The substitution effect is further validated by the growth in China’s rare earth exports, which rose 24% year-on-year in November, hinting at an active redirection of critical materials to non-U.S. destinations.

          Trade Surplus Rises While Domestic Demand Falters

          Even as exports recovered, domestic conditions remained fragile. Imports rose only 1.9%, underperforming expectations of 3%, suggesting that weak domestic demand largely attributed to a persistent housing downturn and labor market uncertainty continues to undermine consumption. Compared to the same period in 2024, imports for the first 11 months of 2025 dropped 0.6%, while exports rose 5.4%, pushing the trade surplus to a massive $1.076 trillion, up 21.6% year-on-year. This stark imbalance indicates that external demand not internal consumption remains the primary engine of economic growth.
          Trade categories such as soybeans and rare earths, central to the U.S.-China agreement, showed early signs of increased activity. Soybean imports climbed 13% year-on-year to 8.1 million metric tons in November, though still below October levels. China’s commitment to purchase 12 million metric tons of U.S. soybeans by year-end may still fall short, reflecting a lag in implementation. Meanwhile, the rare earth sector benefited from a 24% year-on-year volume surge, aided by a new licensing regime aimed at accelerating exports. While these developments represent partial compliance with the trade deal, they remain insufficient to reverse the declining trajectory of overall bilateral trade.

          Domestic Manufacturing Under Pressure Despite External Gains

          Although November’s export rebound offered relief to Chinese manufacturers, internal indicators showed ongoing stress. Official data confirmed that factory activity contracted for the eighth consecutive month, while private surveys focusing on export-oriented manufacturers also slipped back into contraction territory. This suggests a weak correlation between headline export numbers and actual industrial health, as a limited set of commodity exports (such as rare earths) may be masking broader stagnation in manufacturing orders.
          With the Central Economic Work Conference scheduled for later this month, attention is now turning to Beijing’s next fiscal and monetary strategies. While the government is expected to retain the 2026 growth target of “around 5%,” analysts including Goldman Sachs anticipate more aggressive easing in early 2026. Potential measures include expanding the fiscal deficit cap by 1 percentage point of GDP and reducing policy interest rates by at least 20 basis points. These policy responses are designed to offset the effects of weak domestic consumption and a sluggish fourth quarter.
          The strengthening yuan, which appreciated nearly 5% since April to 7.0669 per dollar, has not yet hindered export performance. However, as Weijian Shan of PAG argued, a stronger yuan could play a positive role in boosting household purchasing power and consumption’s contribution to GDP which has slipped to 53%, down from 86% in 2023. The implicit suggestion is that China’s long-term economic sustainability hinges on rebalancing growth away from export dependency and toward internal demand, a structural shift that remains largely unaddressed.
          China’s trade data for November 2025 reveals a complex narrative of selective resilience. While exports to the rest of the world have surged, the continuing collapse in trade with the United States indicates that bilateral tensions and structural frictions run deeper than a single-year tariff suspension can resolve. Moreover, internal vulnerabilities persist despite impressive external figures. As Beijing prepares for 2026, policymakers must grapple with not only maintaining external momentum but also delivering domestic reforms that can unlock sustainable, consumption-led growth.

          Source: CNBC

          To stay updated on all economic events of today, please check out our Economic calendar
          Risk Warnings and Disclaimers
          You understand and acknowledge that there is a high degree of risk involved in trading. Following any strategies or investment methods may lead to potential losses. The content on the site is provided by our contributors and analysts for information purposes only. You are solely responsible for determining whether any trading assets, securities, strategy, or any other product is suitable for investing based on your own investment objectives and financial situation.
          Add to Favorites
          Share

          Gold Outlook: $4,250 Resistance Tests Ahead Of Volatile FOMC Week

          Pepperstone

          Commodity

          Forex

          This week, market attention turns to the Fed's final rate decision of the year. Updates to the dot plot, adjustments to economic projections, and Powell's remarks could all be key factors influencing gold's year-end trajectory.

          Technical Observation: Consolidation Near Highs, $4,250 Resistance Stands Out

          Looking at the XAUUSD daily chart, gold has been trading in a tight range between $4,180 and $4,250. Bulls face clear resistance near $4,250, with multiple attempts failing to hold above this level. Although the uptrend formed at the end of October remains intact, buying momentum has been limited, keeping supply and demand relatively balanced.

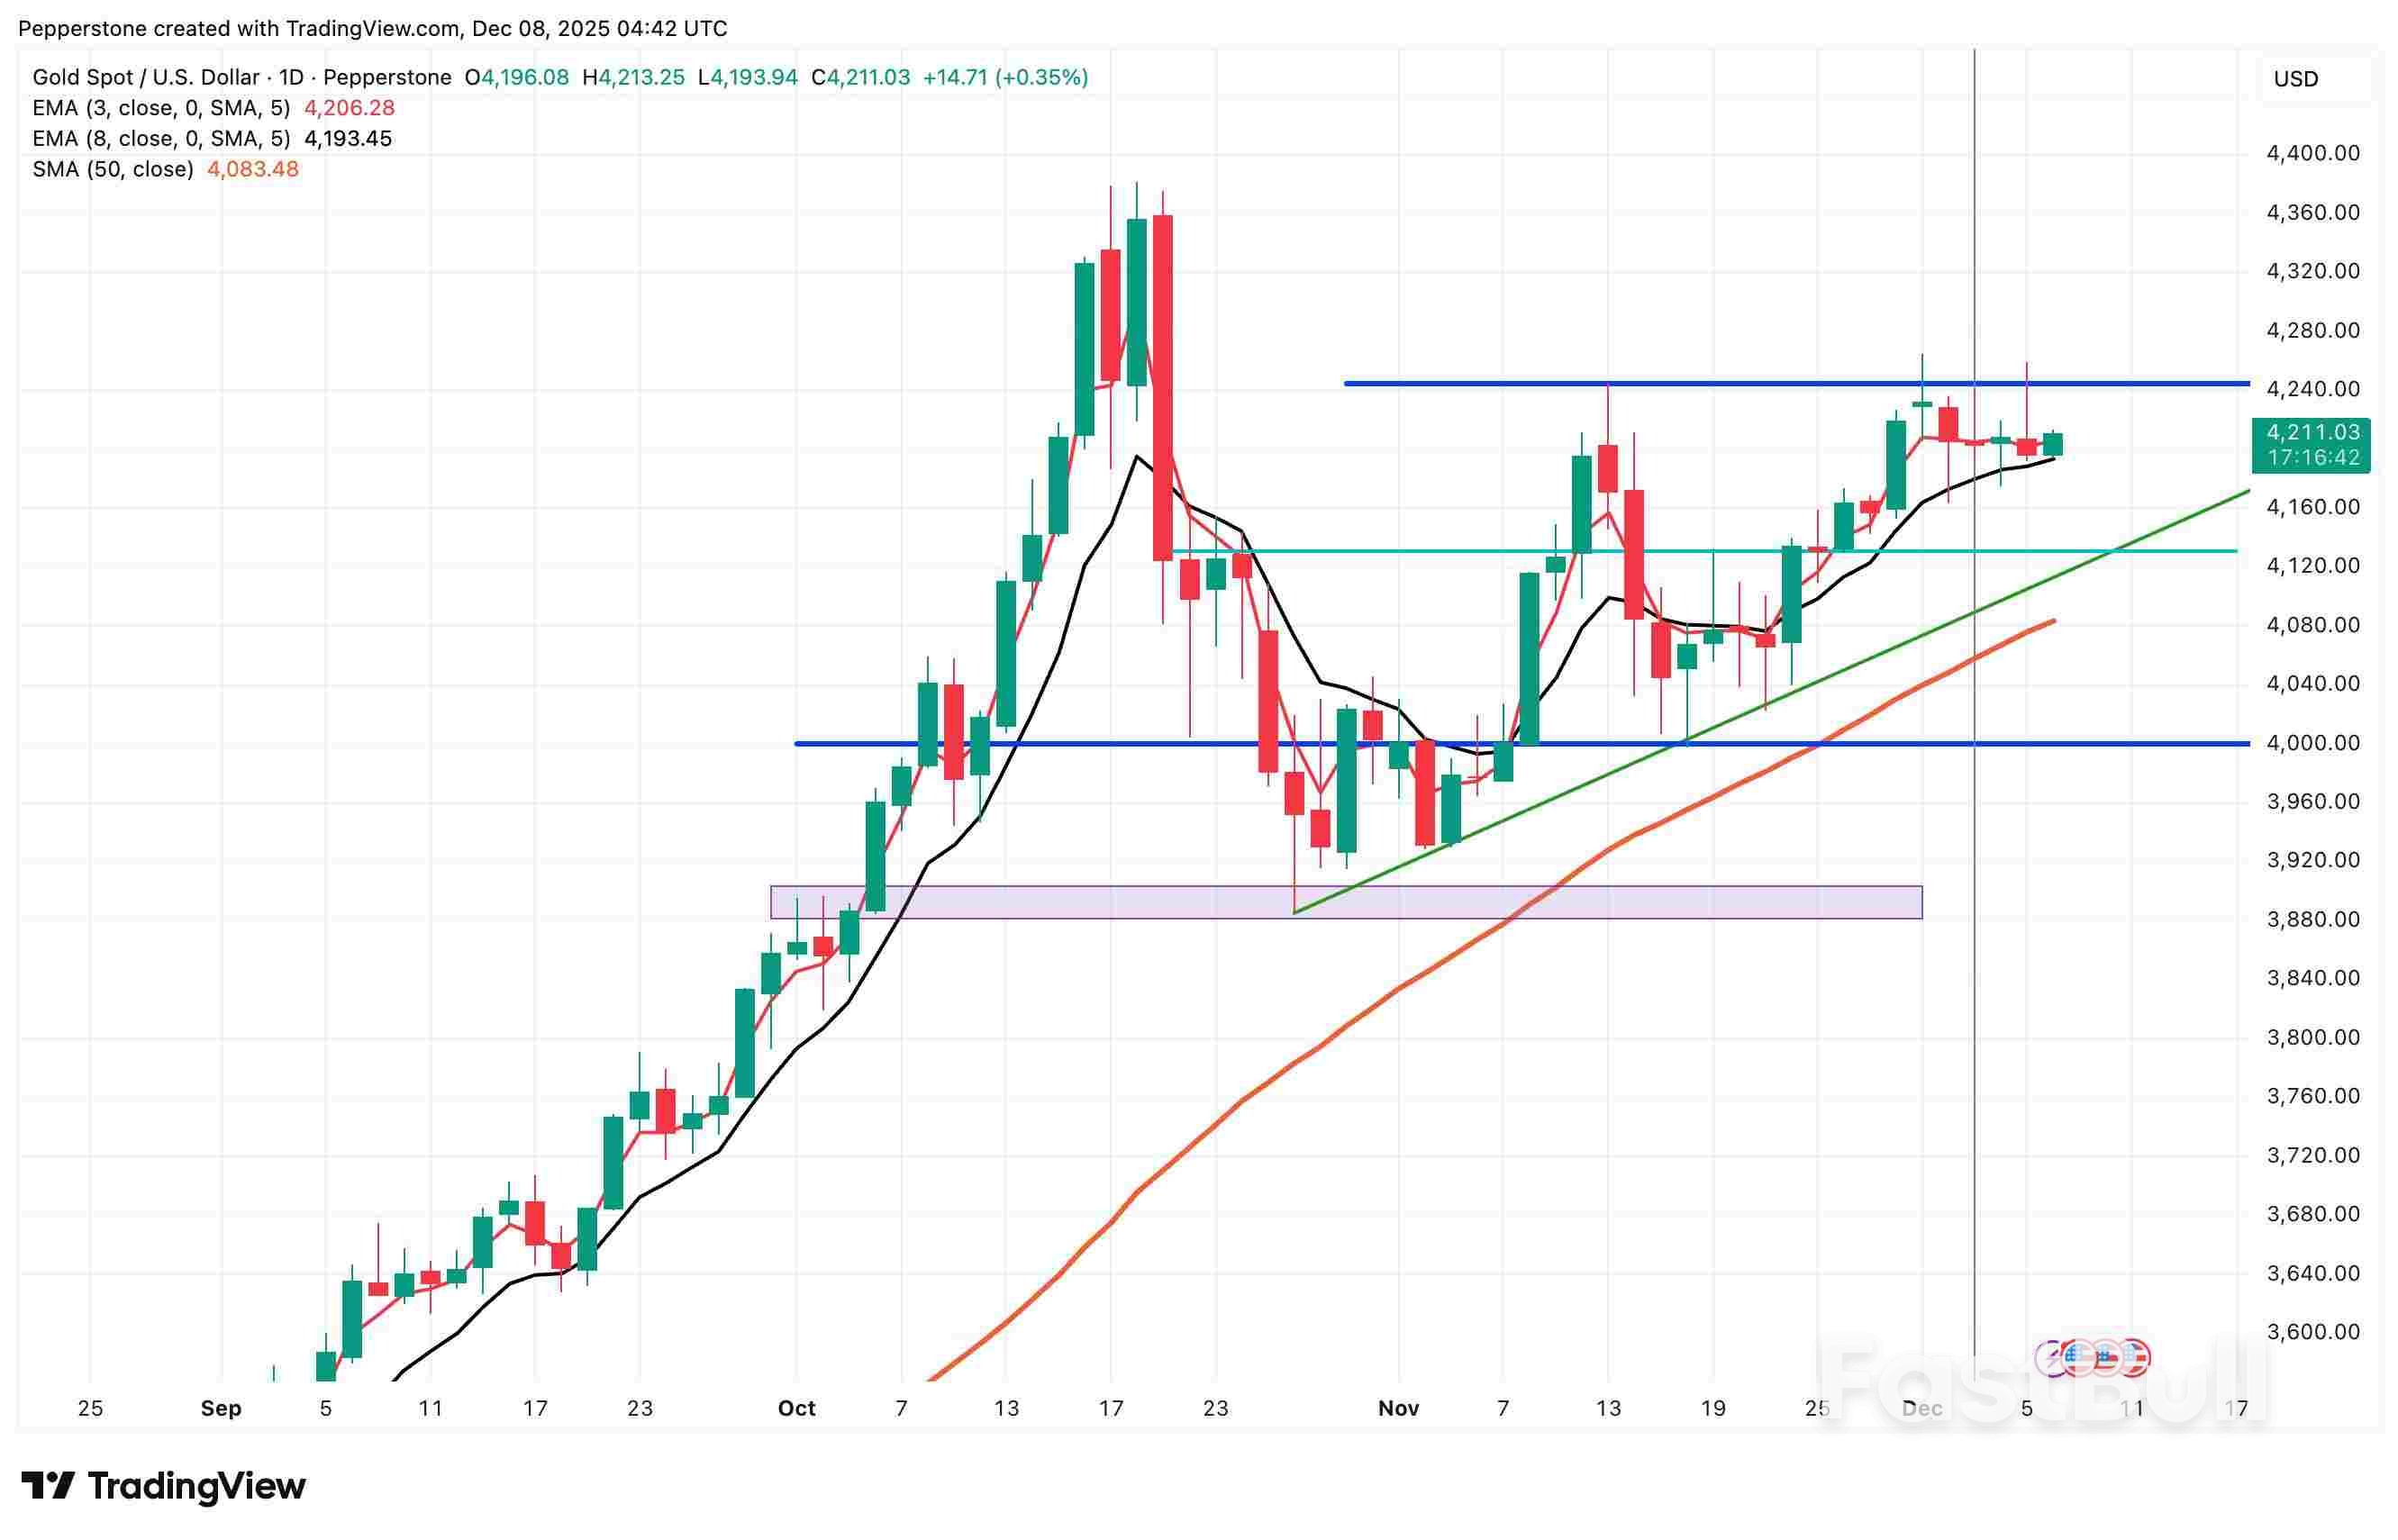
          On Monday morning, gold traded near $4,200. To the upside, $4,250 is a critical level for resuming the uptrend. A sustained break above this level, accompanied by higher volume, could reignite bullish momentum, pushing toward $4,300 and ultimately the record high of $4,381.

          To the downside, a drop below last week's $4,180 low would shift focus to the October uptrend line near the 50-day moving average, likely attracting buying interest and prompting a short-term rebound.

          FOMC Decision in Focus: Gold Awaits Guidance

          Bullish factors remain dominant for gold. In the U.S., the December rate cut is priced at nearly 90%, the dollar is weak, and internal Fed divisions over the path of future easing have grown, all supporting gold. Meanwhile, China's central bank increased its gold holdings for the 13th consecutive month in November, reinforcing price support. Yet, last week's economic data only reinforced existing bullish narratives without providing new momentum.

          At the same time, U.S. Treasuries faced continued selling, with yields rising, reflecting cautious expectations for a "hawkish cut," which adds some pressure to the non-yielding asset.

          The market's focus is squarely on the Fed's decision this week. Beyond the rate cut itself, traders are watching dot plot updates, Powell's tone, and guidance on the 2026 rate cut path. Unlike Powell's previous emphasis on internal consensus, committee members now differ significantly in both policy direction and magnitude. Even minor adjustments by a few members could lead to notable dot plot shifts and rate path changes.

          The baseline scenario for traders is that the U.S. labor market faces downside risks, unemployment forecasts may be slightly revised higher, and Powell may acknowledge internal Fed divisions while using moderately hawkish language on the rate cut. With dot plot uncertainty intact, this policy risk hedging could provide some support to gold.

          If the Fed's outcome and comments are clearly dovish, gold's upside momentum could strengthen further. Conversely, if economic forecasts show persistent inflation and some Fed members lean hawkish, delaying 2026 rate cuts, profit-taking could intensify, putting short-term pressure on gold prices.

          Beyond the Fed: Other Key Events This Week

          Overall, gold remains in high-level consolidation, and market confidence in its long-term bullish outlook stays firm. In the short term, "range trading and trend-following" remains the preferred strategy. Until $4,250 is decisively breached, chasing positions carries risk. Any reasonable pullback is likely to attract buying interest and support prices.

          Aside from the Fed, the market will also monitor policy meetings from the RBA, Bank of Canada, and Swiss National Bank. The market's main tension has shifted from simply validating economic data to pre-pricing potential divergences in major central bank policies. Greater volatility in interest rates and currencies could further enhance gold's appeal as a safe-haven asset.

          On Tuesday, the U.S. will release October JOLTS job openings, expected at 7.15 million. This will be the first data reflecting the true labor market post-government shutdown, potentially shaping expectations for Fed policy.

          If the figure falls below consensus, it may reinforce expectations of a weaker labor market, increase the probability of rate cuts, and provide additional support for gold.

          Source: Pepperstone

          Risk Warnings and Disclaimers
          You understand and acknowledge that there is a high degree of risk involved in trading. Following any strategies or investment methods may lead to potential losses. The content on the site is provided by our contributors and analysts for information purposes only. You are solely responsible for determining whether any trading assets, securities, strategy, or any other product is suitable for investing based on your own investment objectives and financial situation.
          Add to Favorites
          Share

          Oil Prices Stabilize as India-Russia Trade Deepens and Geopolitical Risks Rise

          Gerik

          Economic

          Commodity

          Oil Prices Hover Amid Conflicting Forces of Demand and Geopolitical Instability

          Brent crude prices remained below the $64 per barrel threshold on Monday, showing signs of stabilization after achieving consecutive weekly gains for the first time since August. West Texas Intermediate hovered around $60, signaling a temporary equilibrium in global oil markets. This price movement reflects a fragile balance between geopolitical tensions, specifically the Ukraine-Russia conflict, and shifting trade dynamics, notably India’s increasing engagement with Russian oil supplies.
          A key driver of this price stability is India's sustained interest in Russian crude. Russian President Vladimir Putin recently pledged to ensure uninterrupted fuel shipments to India, a gesture seen as reinforcing bilateral energy ties. This commitment arrives just as US negotiators land in New Delhi for broader trade discussions. India’s growing role as a key buyer of sanctioned Russian oil appears to have softened some of the downward pressure on prices, at least in the short term. The causality here stems from India’s willingness to purchase discounted Russian crude, which provides a steady demand stream that supports market prices even as other variables suggest bearish conditions.

          Ukraine’s Military Strategy Targets Russian Energy Infrastructure

          Simultaneously, Ukraine has intensified attacks on Russian energy infrastructure, notably the Caspian Pipeline Consortium (CPC) terminal on the Black Sea, a vital hub for Russian oil exports. These offensives have disrupted loadings and driven up physical crude premiums. Kyiv’s broader targeting of energy-related assets within Russia is adding a layer of volatility to supply expectations. The effect of these strikes is not necessarily linear in its impact on pricing, but they do create a correlation between rising geopolitical risk and short-term support for oil benchmarks.
          Despite these developments, broader market fundamentals suggest a bearish outlook. Rising output from OPEC+ nations and non-OPEC producers such as the US, Brazil, and Guyana is projected to outpace lukewarm global demand growth. The market’s oversupply condition is not yet fully priced in but is increasingly acknowledged by analysts. Vivek Dhar from the Commonwealth Bank of Australia noted that as Russia successfully redirects its oil flows around sanctions, the impact of supply resilience will weigh more heavily on the market. His projection indicates that Brent could trend downwards toward $60 per barrel through 2026, implying that the current price stability may be fleeting.

          Outlook Hinges on Major Energy Reports

          Market participants await new forecasts this week from the Energy Information Administration (EIA), the International Energy Agency (IEA), and OPEC. These reports are expected to provide updated insights into global inventory levels, production forecasts, and demand projections. Their release could shift current sentiment by validating oversupply concerns or revising growth outlooks depending on emerging data.
          In summary, oil prices are currently supported by India’s energy diplomacy and the disruptive impact of Ukrainian strikes on Russian export capacity. However, this support exists in tension with structural market concerns over increasing global supply. The interaction of these variables some directly causal, others correlative will likely determine the trajectory of oil prices heading into 2026. Without a significant uptick in demand or a sustained supply shock, bearish pressures may gradually override short-term stabilizing forces.

          Source: Bloomberg

          To stay updated on all economic events of today, please check out our Economic calendar
          Risk Warnings and Disclaimers
          You understand and acknowledge that there is a high degree of risk involved in trading. Following any strategies or investment methods may lead to potential losses. The content on the site is provided by our contributors and analysts for information purposes only. You are solely responsible for determining whether any trading assets, securities, strategy, or any other product is suitable for investing based on your own investment objectives and financial situation.
          Add to Favorites
          Share

          Asia Markets Mixed as Investors Eye China Trade Data and RBA Decision

          Gerik

          Economic

          Stocks

          Markets Await China Trade Recovery as Sentiment Remains Cautious

          Asia-Pacific equities traded without clear direction as investors focused on the upcoming release of China’s November trade data, with expectations of an export recovery. According to a Reuters poll, China’s exports are forecast to grow 3.8% year-over-year in November, reversing October’s 1.1% decline. Imports are also expected to rise 3%, up from 1% previously. A better-than-expected print could strengthen confidence in China’s manufacturing and global trade momentum heading into 2026.
          Meanwhile, Hong Kong’s Hang Seng Index futures pointed to a higher open, and the index rose 0.24% during the session. Mainland China’s CSI 300 added 0.43%, with markets drawing support from optimism around a trade rebound.
          However, the excitement from Moore Threads’ massive IPO debut last week waned, as the Beijing-based GPU maker saw its shares drop more than 5% following Friday’s 400% surge on Shanghai’s STAR Market. Despite the slip, the stock remains well above its IPO price of 114.28 yuan, closing at 600.50 yuan.

          Japan’s Growth Disappoints, Raises Concerns About Economic Momentum

          Japan’s economic outlook dimmed as revised data showed a sharper contraction in Q3. The economy shrank at an annualized rate of 2.3% between July and September, worse than both the initial estimate of a 1.8% fall and economists’ forecast of a 2.0% decline. The downward revision underscores persistent domestic weaknesses amid sluggish consumption and global headwinds.
          Japan’s Nikkei 225 slipped 0.14%, while the broader Topix managed a modest 0.25% gain, suggesting some sector rotation even as growth concerns deepened.

          Australia Awaits RBA Decision Amid Rate Hold Expectations

          The Reserve Bank of Australia (RBA) began its two-day policy meeting, with a decision due Tuesday. Economists widely expect the central bank to maintain its cash rate at 3.60% and hold steady through 2026. Market participants are closely watching for any shifts in the RBA’s tone regarding inflation risks or labor market trends.
          The S&P/ASX 200 edged 0.17% lower as investors turned cautious ahead of the announcement. Some analysts suggest that with inflation moderating and household consumption under pressure, the RBA is likely to retain its current stance, though market-implied pricing still leaves the door open for cuts later in 2026.

          Regional Performance Snapshot

          As of the latest updates, major indexes across Asia-Pacific displayed diverging trends. South Korea’s Kospi rose 0.78% to 4,132.22, supported by gains in technology stocks, while the Kosdaq added 0.45%. India’s Nifty 50 fell 0.39% to 26,083.70, tracking broader concerns over global economic growth and domestic valuations.
          China’s Shanghai Composite gained 0.62% to close at 3,927.19, reflecting moderate optimism ahead of the trade data. The Nikkei ended slightly positive at 50,525.59 (+0.07%), rebounding from earlier losses.

          U.S. Markets Set the Tone with Cautious Optimism

          Investor sentiment in Asia was also influenced by Wall Street’s Friday performance. All three major U.S. indexes posted gains despite mixed economic data. The S&P 500 rose 0.19% to 6,870.40, achieving its fourth consecutive winning session and moving within 0.7% of its all-time intraday high.
          The Nasdaq Composite climbed 0.31% to 23,578.13, while the Dow Jones Industrial Average added 104.05 points (+0.22%) to finish at 47,954.99. The modest gains suggest resilient investor confidence amid hopes for a soft landing and potential rate cuts in 2026.
          As markets await China’s November trade report and the RBA’s rate decision, the region remains in a holding pattern. A positive surprise from China could lift sentiment and fuel momentum in Asia-Pacific equities. However, recent disappointments such as Japan’s weaker GDP highlight the fragile recovery still underway across the region. Investors will be watching closely for signals that could shift monetary policy expectations or reveal new insights into global demand trends.

          Source: CNBC

          To stay updated on all economic events of today, please check out our Economic calendar
          Risk Warnings and Disclaimers
          You understand and acknowledge that there is a high degree of risk involved in trading. Following any strategies or investment methods may lead to potential losses. The content on the site is provided by our contributors and analysts for information purposes only. You are solely responsible for determining whether any trading assets, securities, strategy, or any other product is suitable for investing based on your own investment objectives and financial situation.
          Add to Favorites
          Share
          FastBull
          Copyright © 2025 FastBull Ltd

          728 RM B 7/F GEE LOK IND BLDG NO 34 HUNG TO RD KWUN TONG KLN HONG KONG

          TelegramInstagramTwitterfacebooklinkedin
          App Store Google Play Google Play
          Products
          Charts

          Chats

          Q&A with Experts
          Screeners
          Economic Calendar
          Data
          Tools
          Membership
          Features
          Function
          Markets
          Copy Trading
          Latest Signals
          Contests
          News
          Analysis
          24/7
          Columns
          Education
          Company
          Careers
          About Us
          Contact Us
          Advertising
          Help Center
          Feedback
          User Agreement
          Privacy Policy
          Business

          White Label

          Data API

          Web Plug-ins

          Poster Maker

          Affiliate Program

          Risk Disclosure

          The risk of loss in trading financial instruments such as stocks, FX, commodities, futures, bonds, ETFs and crypto can be substantial. You may sustain a total loss of the funds that you deposit with your broker. Therefore, you should carefully consider whether such trading is suitable for you in light of your circumstances and financial resources.

          No decision to invest should be made without thoroughly conducting due diligence by yourself or consulting with your financial advisors. Our web content might not suit you since we don't know your financial conditions and investment needs. Our financial information might have latency or contain inaccuracy, so you should be fully responsible for any of your trading and investment decisions. The company will not be responsible for your capital loss.

          Without getting permission from the website, you are not allowed to copy the website's graphics, texts, or trademarks. Intellectual property rights in the content or data incorporated into this website belong to its providers and exchange merchants.

          Not Logged In

          Log in to access more features

          FastBull Membership

          Not yet

          Purchase

          Become a signal provider
          Help Center
          Customer Service
          Dark Mode
          Price Up/Down Colors

          Log In

          Sign Up

          Position
          Layout
          Fullscreen
          Default to Chart
          The chart page opens by default when you visit fastbull.com