• Trade
  • Markets
  • Copy
  • Contests
  • News
  • 24/7
  • Calendar
  • Q&A
  • Chats
Trending
Screeners
SYMBOL
LAST
BID
ASK
HIGH
LOW
NET CHG.
%CHG.
SPREAD
SPX
S&P 500 Index
6854.89
6854.89
6854.89
6861.30
6847.07
+27.48
+ 0.40%
--
DJI
Dow Jones Industrial Average
48598.09
48598.09
48598.09
48679.14
48557.21
+140.05
+ 0.29%
--
IXIC
NASDAQ Composite Index
23304.68
23304.68
23304.68
23345.56
23265.18
+109.52
+ 0.47%
--
USDX
US Dollar Index
97.850
97.930
97.850
98.070
97.810
-0.100
-0.10%
--
EURUSD
Euro / US Dollar
1.17540
1.17547
1.17540
1.17596
1.17262
+0.00146
+ 0.12%
--
GBPUSD
Pound Sterling / US Dollar
1.33924
1.33932
1.33924
1.33961
1.33546
+0.00217
+ 0.16%
--
XAUUSD
Gold / US Dollar
4329.51
4329.85
4329.51
4350.16
4294.68
+30.12
+ 0.70%
--
WTI
Light Sweet Crude Oil
56.883
56.913
56.883
57.601
56.789
-0.350
-0.61%
--

Community Accounts

Signal Accounts
--
Profit Accounts
--
Loss Accounts
--
View More

Become a signal provider

Sell trading signals to earn additional income

View More

Guide to Copy Trading

Get started with ease and confidence

View More

Signal Accounts for Members

All Signal Accounts

Best Return
  • Best Return
  • Best P/L
  • Best MDD
Past 1W
  • Past 1W
  • Past 1M
  • Past 1Y

All Contests

  • All
  • Trump Updates
  • Recommend
  • Stocks
  • Cryptocurrencies
  • Central Banks
  • Featured News
Top News Only
Share

The Nasdaq Golden Dragon China Index Fell 0.9% In Early Trading

Share

The S&P 500 Opened 32.78 Points Higher, Or 0.48%, At 6860.19; The Dow Jones Industrial Average Opened 136.31 Points Higher, Or 0.28%, At 48594.36; And The Nasdaq Composite Opened 134.87 Points Higher, Or 0.58%, At 23330.04

Share

Miran: Goods Inflation Could Be Settling In At A Higher Level Than Was Normal Before The Pandemic, But That Will Be More Than Offset By Housing Disinflation

Share

Miran, Who Dissented In Favor Of A Larger Cut At Last Fed Meeting, Repeats Keeping Policy Too Tight Will Lead To Job Losses

Share

Miran: Does Not Think Higher Goods Inflation Is Mostly From Tariffs, But Acknowledges Does Not Have A Full Explanation For It

Share

Toronto Stock Index .GSPTSE Rises 67.16 Points, Or 0.21 Percent, To 31594.55 At Open

Share

Miran: Excluding Housing And Non-Market Based Items, Core Pce Inflation May Be Below 2.3%, “Within Noise” Of The Fed's 2% Target

Share

Polish State Assets Minister Balczun Says Jsw Needs Over USD 830 Million Financing To Keep Liquidity For A Year

Share

Miran: Prices Are “Once Again Stable” And Monetary Policy Should Reflect That

Share

Fed's Miran: Current Excess Inflation Is Not Reflective Of Underlying Supply And Demand In The Economy

Share

Portugal Treasury Puts 2026 Net Financing Needs At 13 Billion Euros, Up From 10.8 Billion In 2025

Share

Portugal Treasury Expects 2026 Net Financing Needs At 29.4 Billion Euros, Up From 25.8 Billion In 2025

Share

Bank Of America Says With Indonesia's Smelter Now Ramping Up, It Expects Aluminium Supply Growth To Accelerate To 2.6% Year On Year In 2026

Share

Bank Of America Expects A Deficit In Aluminium Next Year And Sees Prices Pushing Above $3000/T

Share

Fed Data - USA Effective Federal Funds Rate At 3.64 Percent On 12 December On $102 Billion In Trades Versus 3.64 Percent On $99 Billion On 11 December

Share

Brazil's Petrobras Says No Impact Seen On Oil, Petroleum Products Output As Workers Start Planned Strike

Share

Statement: US Travel Group Warns New Proposed Trump Administration Requirements For Foreign Tourists To Provide Social Media Histories Could Mean Millions Of People Opting Not To Visit

Share

Blackrock: Kerry White Will Become Head Of Citi Investment Management At Citi Wealth

Share

Blackrock: Rob Jasminski, Head Of Citi Investment Management, Has Joined With Team

Share

Blackrock: Effective Dec 15, Citi Investment Management Employees Will Join Blackrock

TIME
ACT
FCST
PREV
Japan Tankan Small Manufacturing Outlook Index (Q4)

A:--

F: --

P: --

Japan Tankan Large Non-Manufacturing Outlook Index (Q4)

A:--

F: --

P: --

Japan Tankan Large Manufacturing Outlook Index (Q4)

A:--

F: --

P: --

Japan Tankan Small Manufacturing Diffusion Index (Q4)

A:--

F: --

P: --

Japan Tankan Large Manufacturing Diffusion Index (Q4)

A:--

F: --

P: --

Japan Tankan Large-Enterprise Capital Expenditure YoY (Q4)

A:--

F: --

P: --

U.K. Rightmove House Price Index YoY (Dec)

A:--

F: --

P: --

China, Mainland Industrial Output YoY (YTD) (Nov)

A:--

F: --

P: --

China, Mainland Urban Area Unemployment Rate (Nov)

A:--

F: --

P: --

Saudi Arabia CPI YoY (Nov)

A:--

F: --

P: --

Euro Zone Industrial Output YoY (Oct)

A:--

F: --

P: --

Euro Zone Industrial Output MoM (Oct)

A:--

F: --

P: --

Canada Existing Home Sales MoM (Nov)

A:--

F: --

P: --

Canada National Economic Confidence Index

A:--

F: --

P: --

Canada New Housing Starts (Nov)

A:--

F: --

P: --
U.S. NY Fed Manufacturing Employment Index (Dec)

A:--

F: --

P: --

U.S. NY Fed Manufacturing Index (Dec)

A:--

F: --

P: --

Canada Core CPI YoY (Nov)

A:--

F: --

P: --

Canada Manufacturing Unfilled Orders MoM (Oct)

A:--

F: --

P: --

U.S. NY Fed Manufacturing Prices Received Index (Dec)

A:--

F: --

P: --

U.S. NY Fed Manufacturing New Orders Index (Dec)

A:--

F: --

P: --

Canada Manufacturing New Orders MoM (Oct)

A:--

F: --

P: --

Canada Core CPI MoM (Nov)

A:--

F: --

P: --

Canada Trimmed CPI YoY (SA) (Nov)

A:--

F: --

P: --

Canada Manufacturing Inventory MoM (Oct)

A:--

F: --

P: --

Canada CPI YoY (Nov)

A:--

F: --

P: --

Canada CPI MoM (Nov)

A:--

F: --

P: --

Canada CPI YoY (SA) (Nov)

A:--

F: --

P: --

Canada Core CPI MoM (SA) (Nov)

A:--

F: --

P: --

Canada CPI MoM (SA) (Nov)

A:--

F: --

P: --

Federal Reserve Board Governor Milan delivered a speech
U.S. NAHB Housing Market Index (Dec)

--

F: --

P: --

Australia Composite PMI Prelim (Dec)

--

F: --

P: --

Australia Services PMI Prelim (Dec)

--

F: --

P: --

Australia Manufacturing PMI Prelim (Dec)

--

F: --

P: --

Japan Manufacturing PMI Prelim (SA) (Dec)

--

F: --

P: --

U.K. 3-Month ILO Employment Change (Oct)

--

F: --

P: --

U.K. Unemployment Claimant Count (Nov)

--

F: --

P: --

U.K. Unemployment Rate (Nov)

--

F: --

P: --

U.K. 3-Month ILO Unemployment Rate (Oct)

--

F: --

P: --

U.K. Average Weekly Earnings (3-Month Average, Including Bonuses) YoY (Oct)

--

F: --

P: --

U.K. Average Weekly Earnings (3-Month Average, Excluding Bonuses) YoY (Oct)

--

F: --

P: --

France Services PMI Prelim (Dec)

--

F: --

P: --

France Composite PMI Prelim (SA) (Dec)

--

F: --

P: --

France Manufacturing PMI Prelim (Dec)

--

F: --

P: --

Germany Services PMI Prelim (SA) (Dec)

--

F: --

P: --

Germany Manufacturing PMI Prelim (SA) (Dec)

--

F: --

P: --

Germany Composite PMI Prelim (SA) (Dec)

--

F: --

P: --

Euro Zone Composite PMI Prelim (SA) (Dec)

--

F: --

P: --

Euro Zone Services PMI Prelim (SA) (Dec)

--

F: --

P: --

Euro Zone Manufacturing PMI Prelim (SA) (Dec)

--

F: --

P: --

U.K. Services PMI Prelim (Dec)

--

F: --

P: --

U.K. Manufacturing PMI Prelim (Dec)

--

F: --

P: --

U.K. Composite PMI Prelim (Dec)

--

F: --

P: --

Euro Zone ZEW Economic Sentiment Index (Dec)

--

F: --

P: --

Germany ZEW Current Conditions Index (Dec)

--

F: --

P: --

Germany ZEW Economic Sentiment Index (Dec)

--

F: --

P: --

Euro Zone Trade Balance (Not SA) (Oct)

--

F: --

P: --

Euro Zone ZEW Current Conditions Index (Dec)

--

F: --

P: --

Euro Zone Trade Balance (SA) (Oct)

--

F: --

P: --

U.S. Retail Sales MoM (Excl. Automobile) (SA) (Oct)

--

F: --

P: --

Q&A with Experts
    • All
    • Chatrooms
    • Groups
    • Friends
    Connecting
    .
    .
    .
    Type here...
    Add Symbol or Code

      No matching data

      All
      Trump Updates
      Recommend
      Stocks
      Cryptocurrencies
      Central Banks
      Featured News
      • All
      • Russia-Ukraine Conflict
      • Middle East Flashpoint
      • All
      • Russia-Ukraine Conflict
      • Middle East Flashpoint
      Search
      Products

      Charts Free Forever

      Chats Q&A with Experts
      Screeners Economic Calendar Data Tools
      Membership Features
      Data Warehouse Market Trends Institutional Data Policy Rates Macro

      Market Trends

      Market Sentiment Order Book Forex Correlations

      Top Indicators

      Charts Free Forever
      Markets

      News

      News Analysis 24/7 Columns Education
      From Institutions From Analysts
      Topics Columnists

      Latest Views

      Latest Views

      Trending Topics

      Top Columnists

      Latest Update

      Signals

      Copy Rankings Latest Signals Become a signal provider AI Rating
      Contests
      Brokers

      Overview Brokers Assessment Rankings Regulators News Claims
      Broker listing Forex Brokers Comparison Tool Live Spread Comparison Scam
      Q&A Complaint Scam Alert Videos Tips to Detect Scam
      More

      Business
      Events
      Careers About Us Advertising Help Center

      White Label

      Data API

      Web Plug-ins

      Affiliate Program

      Awards Institution Evaluation IB Seminar Salon Event Exhibition
      Vietnam Thailand Singapore Dubai
      Fans Party Investment Sharing Session
      FastBull Summit BrokersView Expo
      Recent Searches
        Top Searches
          Markets
          News
          Analysis
          User
          24/7
          Economic Calendar
          Education
          Data
          • Names
          • Latest
          • Prev

          View All

          No data

          Scan to Download

          Faster Charts, Chat Faster!

          Download App
          English
          • English
          • Español
          • العربية
          • Bahasa Indonesia
          • Bahasa Melayu
          • Tiếng Việt
          • ภาษาไทย
          • Français
          • Italiano
          • Türkçe
          • Русский язык
          • 简中
          • 繁中
          Open Account
          Search
          Products
          Charts Free Forever
          Markets
          News
          Signals

          Copy Rankings Latest Signals Become a signal provider AI Rating
          Contests
          Brokers

          Overview Brokers Assessment Rankings Regulators News Claims
          Broker listing Forex Brokers Comparison Tool Live Spread Comparison Scam
          Q&A Complaint Scam Alert Videos Tips to Detect Scam
          More

          Business
          Events
          Careers About Us Advertising Help Center

          White Label

          Data API

          Web Plug-ins

          Affiliate Program

          Awards Institution Evaluation IB Seminar Salon Event Exhibition
          Vietnam Thailand Singapore Dubai
          Fans Party Investment Sharing Session
          FastBull Summit BrokersView Expo

          EURUSD Weekly Forecast: Euro Has More Strength Than The US Dollar

          Blue River

          Forex

          Economic

          Summary:

          Expectations of a Fed rate cut by the end of the year remain after weak US labour market data, which limits the dollar’s potential. At the same time, macroeconomic statistics from the eurozone remain weak, with GDP up only 0.1%, and business activity under pressure. However, the decline in US Treasury yields and profit-taking on the USD allow the pair to hold above 1.1650.

          Expectations of a Fed rate cut by the end of the year remain after weak US labour market data, which limits the dollar’s potential. At the same time, macroeconomic statistics from the eurozone remain weak, with GDP up only 0.1%, and business activity under pressure. However, the decline in US Treasury yields and profit-taking on the USD allow the pair to hold above 1.1650.

          The overall picture in EURUSD is still determined by the balance of monetary policy expectations and external trade risks. If the Fed continues to signal its readiness to ease policy, the euro may maintain its recovery.

          In this article, we analyse what to expect for the EURUSD pair in the new week of August.

          EURUSD forecast for this week: quick overview

          ● Market focus:

          The EURUSD pair is hovering near monthly highs amid dollar weakness and moderate recovery in risk appetite. Pressure on the USD came from weak US labour market data as initial jobless claims exceeded expectations, while the total number of continuing claims hit a three-year high.

          Additional pressure came from political uncertainty: Donald Trump confirmed changes to the Federal Reserve Board and is considering replacing current chairman Jerome Powell. These signals boosted expectations of a rate cut as early as September.

          In the eurozone, economic statistics remain weak, but the euro received short-term support amid the general weakening of the US dollar and persistent divergence in monetary policy expectations.

          ● Current trend:

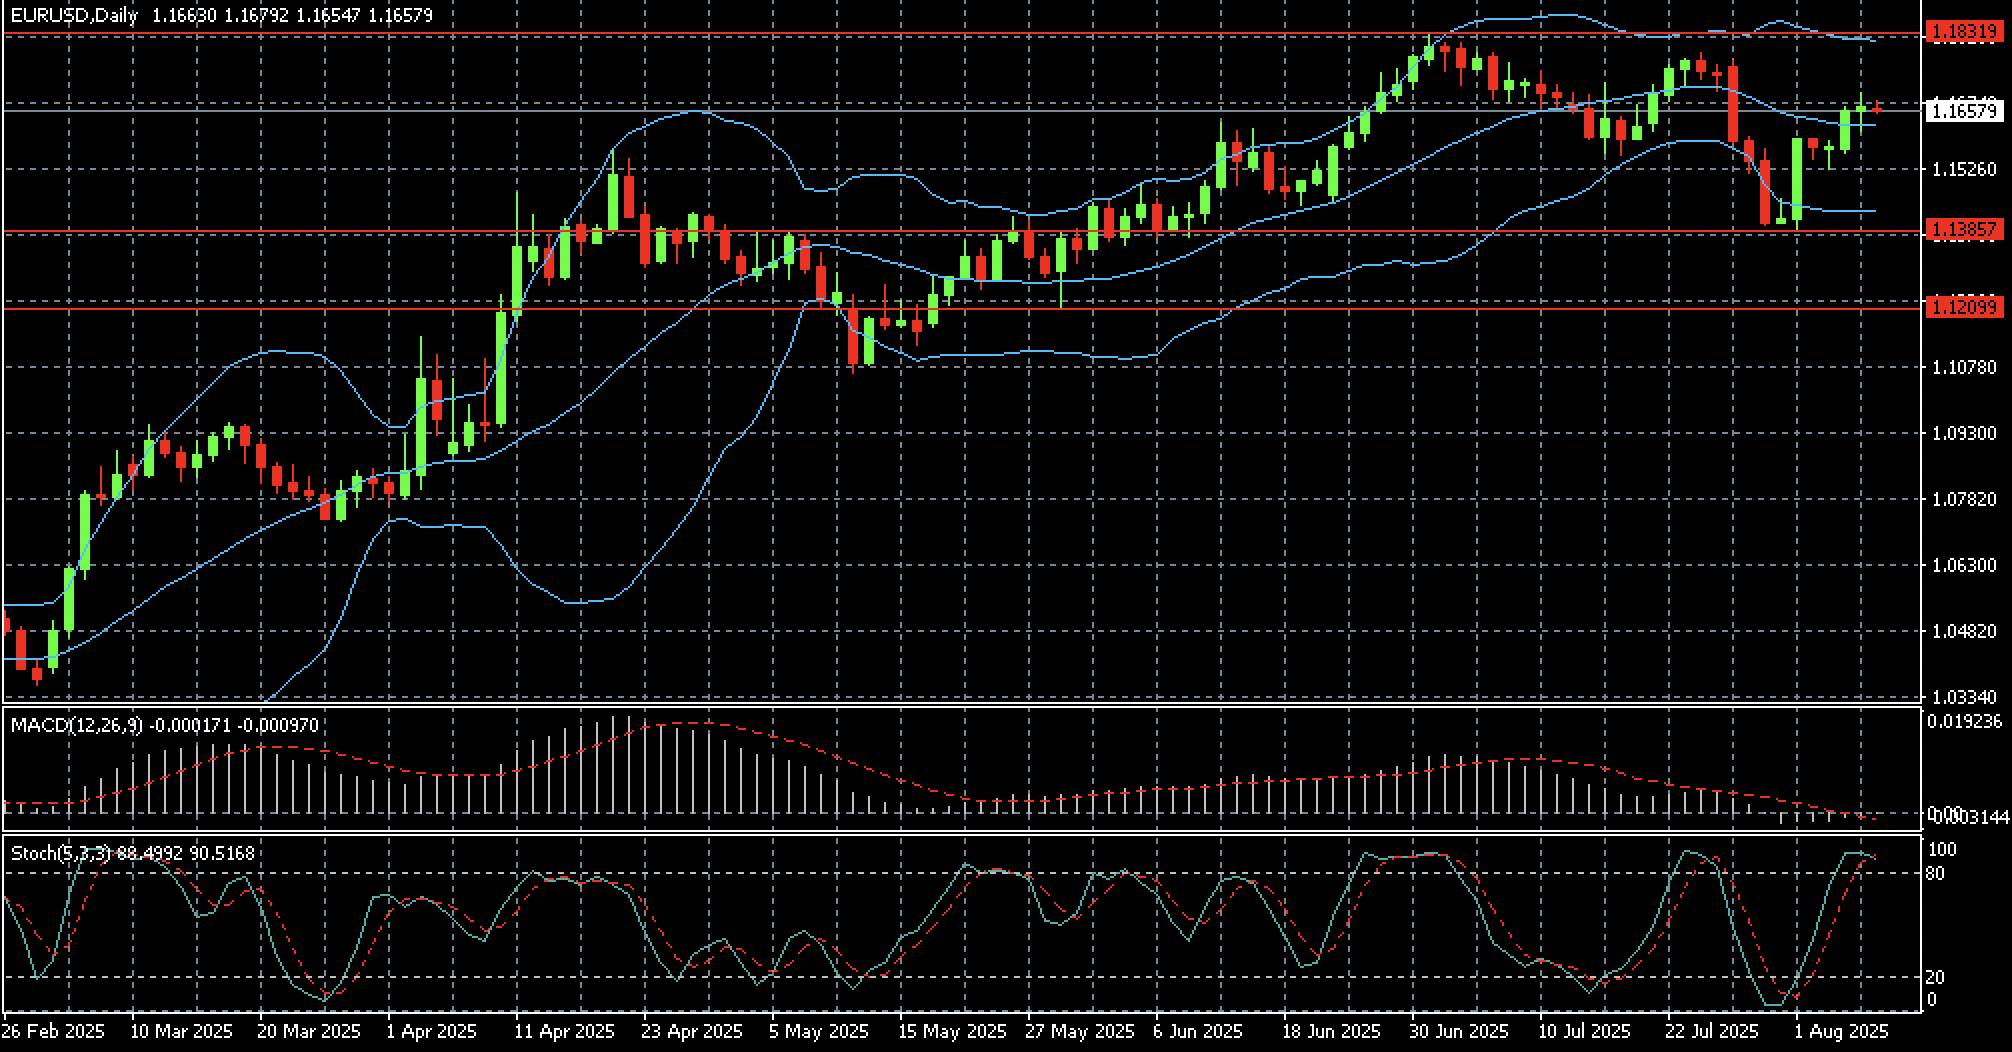
          The EURUSD pair ended the week higher, around 1.1670, hitting a two-week high. The pair consolidated above the key 1.1550 level and remains in a medium-term upward channel. While MACD and the Stochastic Oscillator confirm the positive momentum, they are both in overbought territory, which may indicate a short-term correction.

          The drivers of growth remain dollar weakness and expectations of Fed policy easing.

          ● EUR/USD forecast for 11-15 August 2025:

          The baseline scenario suggests a movement in the 1.1550-1.1730 range with attempts to test the upper boundary if dollar pressure persists. Steady growth is possible in the case of weak inflation and retail sales data from the US.

          The downside scenario will activate if the pair drops below 1.1550; then it may return to 1.1380.

          EURUSD fundamental analysis

          The EURUSD pair ended the week higher at two-week highs. The euro was supported by weak US macroeconomic data and rising expectations of a Federal Reserve rate cut in September. The dollar index fell below 98 points, posting a weekly decline of 0.5%.

          The key factor of the week was the US labour market data. Initial jobless claims totalled 226 thousand, above the forecast of 221 thousand, and continuing claims reached 1.974 million, the highest since 2021. This strengthened expectations of monetary policy easing, with markets pricing in more than a 90% chance of a rate cut this autumn.

          Additional impact on the dollar came from the political agenda. President Donald Trump nominated Stephen Miran to the Federal Reserve Board of Governors and is also considering Christopher Waller for the post of Fed chair. This increased expectations of a softer policy line in the future.

          The market is still watching the development of US trade policy. Broad tariffs ranging from 10% to 50% on goods from dozens of countries came into effect during the week. Particularly tough measures hit semiconductors and Indian imports. The threat of new duties on China adds tension to global markets and affects dollar dynamics.

          The overall sentiment remains moderately positive for the euro amid dollar weakness and rising political uncertainty in the US. The market is focused on upcoming inflation data and new signals from the Fed.

          EURUSD technical analysis

          On the daily timeframe, the EURUSD pair has continued to trade in an uptrend since March 2025. The chart shows a consolidation phase in June and July, followed by a recovery in early August.

          The pair is holding in the upper part of the Bollinger channel, confirming the bullish momentum. However, the Stochastic has entered the overbought zone (above 90), which may indicate a short-term slowdown in growth or a pullback.

          The MACD indicator remains near zero, reflecting weak momentum dynamics and a possible transition to sideways movement.

          The nearest resistance level is at 1.1830, the late June high. The support level is located at 1.1385, with the key level at 1.1210. A breakout above 1.1700 will open the way to new highs, while a move below 1.1550 will increase correction risks.

          EURUSD trading scenarios

          The outlook for the EURUSD pair for the new week is neutral to positive.

          Pressure on the US dollar increased after weak jobless claims data and rising expectations of a Federal Reserve rate cut as early as September. The appointment of Stephen Miran to the Board of Governors and discussions of Christopher Waller as a possible Fed chair intensified political uncertainty.

          Against this backdrop, the euro strengthened despite sluggish eurozone economic indicators. The positive sentiment for EUR/USD remains, but in overbought market conditions, a local correction is possible.

          ● Buy scenario (long):

          Buying is justified if the pair holds above 1.1620-1.1650. This will be confirmed by consolidation near weekly highs and stabilisation in the US labour market.

          Targets are 1.1730 and, with favourable fundamentals, 1.1830.

          Stop-loss is below 1.1580: a breakout below this area would strengthen sellers’ pressure.

          ● Sell scenario (short):

          Short-term selling is possible if the pair returns below 1.1580 amid profit-taking and weak European data. The MACD and Stochastic indicators signal overbought conditions.

          Targets are 1.1500 and 1.1385 if the downward momentum strengthens.

          Stop-loss is above 1.1675: a move beyond this level would confirm the continuation of the uptrend.

          Summary

          Positive sentiment in the EURUSD pair is supported by signs of a cooling US economy and rising expectations of a Fed rate cut towards the end of the year. An additional boost came from profit-taking on the dollar and easing fears over trade policy. In Europe, the picture remains mixed, but the euro is stable: weak GDP growth is offset by stabilising inflation expectations and moderate optimism over trade talks.

          Overall sentiment is cautiously positive. The market awaits new drivers: key events include US inflation reports and comments from Fed officials. If tensions on the trade front do not escalate, the euro may continue to rise.

          Source: RoboForex

          To stay updated on all economic events of today, please check out our Economic calendar
          Risk Warnings and Disclaimers
          You understand and acknowledge that there is a high degree of risk involved in trading. Following any strategies or investment methods may lead to potential losses. The content on the site is provided by our contributors and analysts for information purposes only. You are solely responsible for determining whether any trading assets, securities, strategy, or any other product is suitable for investing based on your own investment objectives and financial situation.
          Add to Favorites
          Share

          The Week Ahead – Week Commencing 11August 2025

          IC Markets

          Economic

          Political

          The Week Ahead

          Global markets finished off last week on a high, with indices across the world again touching fresh record levels, and investors will be hoping for more of the same in the days ahead. However, it is a busier week on the macroeconomic calendar, with some key data and central bank updates ahead of us.

          Australian and Chinese markets will be in focus across the week in the Asian sessions, and there may be some moves on the open on Monday after Chinese CPI data came out slightly higher over the weekend, while the PPI numbers were lower than expected. There are key US inflation numbers out through the week as well, which could prove pivotal for September rate expectations, and we are set to hear from several members of the FOMC.Adding the high propensity of geopolitical updates, including a meeting between Presidents Trump and Putin, it could be a lively trading week ahead of us.

          Here is our usual day-by-day breakdown of the major risk events this week:

          Highlights:

          ● Reserve Bank of Australia Interest Rate Decision – AUD
          ● US CPI Data – USD
          ● UK Employment Data – GBP

          Monday – It is a quiet start to the week on Monday, with little on the event calendar to move the dial. Japanese markets are on holiday again, which may see a decrease in liquidity in the Asian session, but the main focus will be on Chinese markets, with new loans data due out during the session. There is nothing of note on the calendar in either the London or New York sessions, and traders are expecting a relatively quiet day.

          Tuesday – It is a busier day on Tuesday, with key updates due across all three sessions. Australian markets will be in focus in the first session of the day, with the Reserve Bank of Australia set to announce its latest interest rate decision. The London session will see the initial focus on UK markets, with key employment data due out before attention jumps across the channel for the German ZEW Economic Sentiment numbers. Probably the biggest data release of the week then hits early in the New York session, with the US CPI data due out. We will also hear from the Fed’s Thomas Barkin later in the day.

          Wednesday – The Asian session will again see the initial focus on Australian markets, with the Quarterly Wage Price Index numbers due out. There is little scheduled during the latter two sessions, although we do have the weekly US Oil Inventory numbers out in the New York session, and Fed members Goolsbee and Bostic are due to speak.

          Thursday – It’s another busy day on Thursday. Once again, Australian markets will be in focus in the Asian session, with employment data due out. The European session sees the focus on UK markets again, with GDP numbers out early in the piece, and we have more inflation data due out of the US in the New York session — this time, the PPI numbers are set to drop alongside the weekly unemployment claims data.

          Friday – The data continues to come in on the final trading day of the week, with a big data drop due out of China in the Asian session, with traders expected to focus on the Industrial Production and Retail Sales numbers in particular. There is nothing scheduled in the European day; however, holidays in both France and Italy may affect liquidity. Key US numbers are due out again in the New York session, with retail sales data out alongside the Empire State Manufacturing Index. Preliminary University of Michigan Consumer Sentiment and Inflation Expectations numbers are also due out later in the day.

          Source: IC Markets

          To stay updated on all economic events of today, please check out our Economic calendar
          Risk Warnings and Disclaimers
          You understand and acknowledge that there is a high degree of risk involved in trading. Following any strategies or investment methods may lead to potential losses. The content on the site is provided by our contributors and analysts for information purposes only. You are solely responsible for determining whether any trading assets, securities, strategy, or any other product is suitable for investing based on your own investment objectives and financial situation.
          Add to Favorites
          Share

          Debt Market Weakness Flashes Early Warning for Overvalued Stocks

          Gerik

          Economic

          Credit Markets at Extreme Valuations

          Corporate bond spreads the extra yield over government debt fell on July 29 to just one basis point above their 1998 low, signaling investor complacency. UBS strategist Matthew Mish noted that investment-grade pricing now implies nearly 5% global GDP growth, far above the IMF’s 3% projection. Russell Investments’ Van Luu called this scenario unrealistic and has moved underweight credit.
          High-yield bonds, concentrated in economically vital sectors, are viewed as most exposed. Amundi’s Guy Stear expects refinancing costs and default rates to climb as early as October, driven by tariff-related expenses and weaker cash flows pressures that could trigger cuts to jobs, investment, and economic activity.

          Hedging Signals a Shift in Sentiment

          Institutional demand for derivatives that short corporate credit or junk bond indices has surged. Citi’s Stuart Kaiser said this reflects both macro traders taking outright bearish positions and portfolio managers hedging equity exposure. Historically, weakness in high-grade credit ETFs has preceded major equity downturns, as seen before the 2018 trade war slump, the 2022 rate shock, and the 2023 sell-off.
          Lombard Odier’s Florian Ielpo highlighted that the share of corporate bonds with tightening spreads dropped sharply from 80% to 60% in early August a notable breadth deterioration beneath stable headline prices.

          Macro Risks Loom Over “Risk-On” Sentiment

          While European stocks have just posted their strongest week since April and Wall Street trades near all-time highs, the credit market’s caution stands in contrast. If the dollar’s recent weakness reverses, the IMF warns it could exacerbate economic stress in export-led economies, compounding the drag from higher financing costs.
          The current divergence with equities pricing in optimism and credit markets flashing early warnings raises the risk that a credit-led correction could spill into stocks within the next quarter. As Stear put it, “When credit markets come under pressure, eventually equity markets come under pressure as well.”

          Source: Reuters

          To stay updated on all economic events of today, please check out our Economic calendar
          Risk Warnings and Disclaimers
          You understand and acknowledge that there is a high degree of risk involved in trading. Following any strategies or investment methods may lead to potential losses. The content on the site is provided by our contributors and analysts for information purposes only. You are solely responsible for determining whether any trading assets, securities, strategy, or any other product is suitable for investing based on your own investment objectives and financial situation.
          Add to Favorites
          Share

          $3 Billion Foreign Outflow Pushes India’s Stock Market Further Behind China

          Gerik

          Economic

          Stocks

          Market Performance and China Comparison

          The market capitalization gap between India and China has now widened to $6.3 trillion, the largest since March. In the current quarter, the MSCI India Index has lagged the MSCI China Index by 10 percentage points and is on track for its worst annual underperformance since 2017. Goldman Sachs has reiterated a “neutral” stance on Indian equities while upgrading its 12-month target for MSCI China and maintaining a “strong buy” call on Chinese stocks.
          The reversal is striking. Just a few years ago, China was considered “uninvestable” due to regulatory crackdowns and geopolitical risk, driving investors toward India as a safer alternative. Now, India is facing the same headwinds trade tensions, slowing corporate earnings, and stretched valuations that are prompting global funds to reassess their exposure.

          Drivers of Outflows and Macro Headwinds

          The U.S. tariff escalation has weighed heavily on market sentiment, especially given that half of the measure directly targets India’s Russian oil purchases. Notably, China also imports large volumes of Russian oil, yet its ongoing efforts to extend a trade truce with Washington have kept investor sentiment more stable.
          Valuations are a key sticking point. The MSCI India Index is trading at a forward P/E ratio above 21, nearly double the 11.9 times seen in MSCI China. For many global funds, this imbalance between price and expected returns makes India less appealing in the current risk environment.

          Outlook and Diverging Views

          While the near-term picture is challenging, many strategists remain optimistic about India’s long-term growth prospects. Morgan Stanley forecasts Indian equities will hit new record highs in the coming decades, driven by rapid population growth and improving infrastructure. Veteran investor Mark Mobius has suggested that any deep pullbacks should be seen as buying opportunities.
          Domestic capital also provides a cushion: local institutions have invested about $50 billion into Indian stocks, holding a larger share of the $5.2 trillion market than foreign funds. Still, analysts like Chetan Seth of Nomura warn that as long as the trade dispute persists, Indian equities are unlikely to be prioritized in Asia portfolios, and foreign selling pressure could continue.
          Prolonged U.S.-India trade friction could undermine New Delhi’s ambitions to position itself as a manufacturing hub alternative to China a cornerstone of Prime Minister Narendra Modi’s economic agenda. Conversely, any signs of de-escalation in the coming months could quickly improve sentiment, given India’s solid structural growth story.
          To stay updated on all economic events of today, please check out our Economic calendar
          Risk Warnings and Disclaimers
          You understand and acknowledge that there is a high degree of risk involved in trading. Following any strategies or investment methods may lead to potential losses. The content on the site is provided by our contributors and analysts for information purposes only. You are solely responsible for determining whether any trading assets, securities, strategy, or any other product is suitable for investing based on your own investment objectives and financial situation.
          Add to Favorites
          Share

          US Treasury Signals Tariff Relief Possible if Trade Deficits Narrow

          Gerik

          Economic

          Tariffs as Both Leverage and Temporary Measure

          In an exclusive interview with Nikkei, Bessent likened tariffs to “a melting stone,” suggesting that the current elevated rates averaging 18.6%, the highest since World War II are not necessarily permanent. The latest round of increases, announced on August 7, raised tariffs on Japanese imports from 10% to 15%, part of a broader strategy to address the US’s $1.18 trillion current account deficit in 2024. This imbalance, the largest among major economies, is seen by Bessent as a potential trigger for a financial crisis.
          The underlying condition for tariff reduction is clear: if more production shifts back to the US, imports would decline, narrowing the trade gap. This approach aligns with the administration’s “rebalancing” objective, using trade policy not only to protect domestic industries and increase fiscal revenue but also to exert geopolitical pressure.

          Complex Negotiations with China and Japan

          Talks with China remain “difficult,” according to Bessent, who criticized Beijing’s overcapacity and low-cost export model, which he views as driven more by employment and output targets than by profitability. He also reiterated that tariffs are being used to influence broader foreign policy stances, citing the threat of an additional 25% tariff on Indian imports to pressure New Delhi to stop buying Russian oil raising total tariffs to 50%.
          Negotiations with Japan have made more headway. Tokyo has agreed to the 15% tariff and pledged a $550 billion investment and loan package. The US currently runs a $69 billion goods trade deficit with Japan. Bessent expressed optimism that balance could be achieved over time, but noted delays in implementing a key part of the deal the reduction of US tariffs on Japanese automobiles from 27.5% to 15%. He expects mid-September as a feasible start date, comparing it to the UK’s 53-day implementation period for a similar automotive agreement.

          October Deadline and Trade Monitoring

          Bessent expects trade talks with nations lacking formal agreements to wrap up by late October, though he has not committed to a fixed schedule for evaluating compliance with deals. The Treasury’s approach appears to blend ongoing tariff pressure with selective incentives, signaling that market access improvements will be contingent on measurable trade balance gains.
          In a notable aside, Bessent addressed the upcoming succession for Federal Reserve Chair Jerome Powell, whose term ends in May next year. He listed three criteria for the role: market trust, strong economic data analysis skills, and the ability to build consensus among the 12 voting members. While expressing concern about threats to the Fed’s monetary independence citing mission creep beyond its core mandates Bessent emphasized that the institution remains independent despite political commentary from figures like President Trump and Senator Elizabeth Warren.
          Bessent’s comments suggest that while the current tariff regime is aggressive, it is strategically designed to be reversible if trade conditions improve. With late October emerging as a critical milestone for trade negotiations, markets and foreign governments alike will be watching for signs of genuine tariff relief or confirmation that the US intends to keep using high duties as a long-term bargaining chip.

          Source: Nikkei Asia

          To stay updated on all economic events of today, please check out our Economic calendar
          Risk Warnings and Disclaimers
          You understand and acknowledge that there is a high degree of risk involved in trading. Following any strategies or investment methods may lead to potential losses. The content on the site is provided by our contributors and analysts for information purposes only. You are solely responsible for determining whether any trading assets, securities, strategy, or any other product is suitable for investing based on your own investment objectives and financial situation.
          Add to Favorites
          Share

          Market navigator: week of 11 August 2025

          IG

          Economic

          Forex

          Stocks

          Summary

          What happened last week:US reciprocal tariffs took effect, while the Bank of England delivered a cautious 25 bp cut and China demonstrated export resilience.
          Markets in focus:Nasdaq 100 reached new highs, Japanese markets neared historical peaks, while crude oil faced pressure from weak demand and Russia-US diplomatic developments.
          The week ahead:Key focus on RBA rate decision and US inflation data, plus GDP releases from UK and Japan and earnings from Chinese tech giants.

          What happened last week

          Reciprocal tariffs now effective: The US implemented country-specific tariffs effective 7 August, with Switzerland unable to secure concessions on the assigned 39% levy. India faces potential tariff escalation from 25% to 50% beginning 27 August for Russian oil purchases. Market participants remain cautiously optimistic that the China trade truce deadline of 12 August will receive another 90-day extension.
          Bank of England's undecisive cut: The committee narrowly approved a 25 basis point rate cut from 4.25% to 4.00% after two voting rounds, balancing inflation risks potentially rising to 4% against labour market weakness. Bond futures markets reduced probability estimates for additional 2025 rate cuts to 60%, while GBP/USD strengthened 0.6% to 1.3448.
          China maintains robust trade momentum: Export performance exceeded expectations with a 7.2% surge in July to $322 billion despite declining US shipments. Strong flows to the European Union, Southeast Asia, and Australia offset a 22% US contraction. Imports rose 4.1%, with integrated circuits hitting four-year highs and commodities like copper and crude oil posting gains, though sustainability concerns persist given China's property sector challenges.
          Geopolitical developments influence energy markets: The scheduled Trump-Putin meeting in Alaska on Friday reflects Russia's softened diplomatic stance ahead of the Russia-Ukraine war truce deadline, following US threats of additional sanctions. West Texas Intermediate (WTI) crude oil futures declined more than 5% during the week, reaching an eight-week low.

          Markets in focus

          Tech-powered advance drives US equities to new highs

          Following the previous week's sharp correction triggered by deteriorating labour market conditions, equity markets demonstrated remarkable resilience. Investors largely dismissed disappointing Institute for Supply Management (ISM) data indicating manufacturing sector weakness at levels last seen in October 2024.
          Despite Trump's announcement of 100% tariffs on semiconductor imports, exemptions for companies committing to US production shifts provided market reassurance. The Nasdaq 100 index achieved a new record closing high on Friday, generating 4.2% weekly returns. Apple shares surged 13% following CEO Tim Cook's announcement of expanded US manufacturing plans during his Oval Office meeting with Trump.
          Data analytics company Palantir delivered record-breaking $1 billion quarterly revenues, raising full-year guidance above Wall Street expectations, driving share prices up 16%. Conversely, construction equipment manufacturer Caterpillar missed estimates, citing tariff-related concerns potentially costing $1.3-$1.5 billion, with shares declining 4.0%.
          The US Tech 100 bounced from the ascending trend channel's lower boundary established in mid-May, targeting the all-time high of 23,711. This suggests Elliott Wave Theory's Wave 3 remains incomplete, with a 200% Fibonacci extension from the 21 April base potentially driving the index toward 24,718 before Wave 4 correction materialises. The ascending channel's lower boundary provides support around 22,920.
          Market navigator: week of 11 August 2025_1

          TradingView, as of 9 August 2025. Past performance is not a reliable indicator of future performance.

          Nikkei approaches historical record

          Japanese equities surged last Friday, with the Nikkei 225 advancing 2% while the Topix achieved a record close above 3,000. Performance was driven by robust corporate earnings and expectations that the US would not stack tariffs on goods that are subject to a levy higher than the broad-based 15% agreed in July.SoftBank Group rallied over 13% as its artificial intelligence investment portfolio delivered substantial returns, generating net profits of 422 billion yen last quarter compared to losses in the corresponding period last year. Sony gained 8% following earnings outperformance and upward full-year guidance revisions.
          However, some Japanese corporations face headwinds from elevated tariffs and yen strength. Car giant Toyota surpassed both revenue and earnings forecasts but reduced its full-year operating income forecast by 600 billion yen to 3.2 trillion yen for the current financial year.The Japan 225 index trades just 0.9% below its historical peak established 13 months ago. Technical analysis indicates strong potential for new high achievement if the index can sustainably penetrate the current resistance level at 42,000. Failure to breakthrough could trigger a retreat to 40,180, with major support positioned around 38,164.
          Market navigator: week of 11 August 2025_2

          Source: TradingView, as of 8 August 2025. Past performance is not a reliable indicator of future performance.

          Crude oil faces mounting pressure

          Oil market fundamentals exhibit increasing bearish characteristics as multiple supply and demand challenges converge. US crude demand has deteriorated while inventory drawdown pace has significantly decelerated according to US Energy Information Administration (EIA) data. OPEC+'s decision at last Sunday's meeting to increase production by 547,000 barrels per day in September adds substantial supply pressure to an already weakening demand environment.
          Geopolitical developments compound these fundamental headwinds, with recent media reports suggesting imminent Putin-Trump summit discussions regarding Ukraine war resolution. A potential ceasefire agreement between Russia and Ukraine could prompt relaxation of US sanctions on Russian oil exports, further increasing global supply amid ongoing OPEC+ production increases.
          Technical analysis presents a challenging outlook for US crude oil. Medium-term price movement remains constrained by the downward trend established in September 2023. Since the Israel-Iran conflict conclusion, US crude oil futures have declined 17%, rapidly breaching the 200-day simple moving average (SMA), 50-day SMA, and 20-day SMA in the past week. Current price levels at $63 receive critical support from late June local troughs. Failure to maintain these levels could trigger further decline towards $58.75.
          Market navigator: week of 11 August 2025_3

          Source: Trading View, as of 9 August 2025. Past performance is not a reliable indicator of future performance.

          The week ahead

          The week ahead presents critical monetary policy and economic growth assessments across major economies. The Reserve Bank of Australia's (RBA) interest rate decision coincides with US consumer price readings on Tuesday. The inflation print carry heightened significance following disappointing employment data two weeks ago, which amplified expectations for accelerated and deeper Federal Reserve (Fed) rate cuts.
          During July's meeting, the RBA surprised markets by halting rate cuts, citing requirements for sustained evidence of inflation moderating to 2.5% or below. Latest quarterly data revealing consumer price inflation further declined to 2.1% in the second quarter, representing the lowest level since Q1 2021. We anticipate the central bank will deliver a 25 basis point cut, bringing the target cash rate to 3.60% to support the Australian economy amid global uncertainties.
          Economic growth comes into sharp focus with preliminary Q2 gross domestic product (GDP) releases from both the UK and Japan, while China's industrial production and retail sales data will assess the sustainability of government stimulus measure effect.Corporate earnings dynamics shift notably as US reporting activity winds down, while China's earnings season intensifies with technology giants Tencent, JD.com, and NetEase providing crucial insights into China's digital economy health and consumer spending patterns.
          Market navigator: week of 11 August 2025_4

          Source: LSEG Datastream

          Source:IG

          To stay updated on all economic events of today, please check out our Economic calendar
          Risk Warnings and Disclaimers
          You understand and acknowledge that there is a high degree of risk involved in trading. Following any strategies or investment methods may lead to potential losses. The content on the site is provided by our contributors and analysts for information purposes only. You are solely responsible for determining whether any trading assets, securities, strategy, or any other product is suitable for investing based on your own investment objectives and financial situation.
          Add to Favorites
          Share

          RBA’s New Policy Board Adds Market Uncertainty Amid Global Volatility

          Gerik

          Economic

          Communication Shift Leaves Investors in the Dark

          In April, the RBA transferred rate-setting authority entirely to its newly formed Monetary Policy Board (MPB), comprising two RBA officials, one senior Treasury representative, and six part-time external members appointed by the Treasurer. The change has significantly affected the central bank’s communication style. At its May meeting, the MPB cut the cash rate to 3.85% a more dovish move than expected while even briefly considering a larger 50-basis-point reduction due to US tariff uncertainty. The lack of pushback against market rate-cut bets in the following months encouraged traders to price in further easing.
          However, July’s decision shocked markets when the board, in a rare 6–3 split, opted to hold rates steady. This reversal caused widespread investor losses and highlighted the RBA’s new approach avoiding pre-meeting signals that could be seen as “front-running” the full board’s decision. As Westpac chief economist Luci Ellis noted, this makes Australian rate calls inherently more prone to surprises compared to central banks like the US Federal Reserve, which deliberately tries to avoid jolting markets.

          Board Structure Raises Decision-Making Risks

          The MPB’s composition means external members hold a clear numerical advantage over internal RBA voices, raising the possibility that the governor could be outvoted on policy. Since individual votes are not disclosed, investors may not know when or if the governor’s stance was overridden. Jonathan Kearns of Challenger suggested this dynamic could embolden members to challenge internal recommendations, especially if they see policy risks differently.
          In contrast, other major central banks either keep boards exclusively within the central bank (Fed, ECB) or, like the Bank of England, disclose voting records to improve transparency. The RBA’s model makes it harder for markets to gauge internal consensus, with external members expected to speak publicly only once a year.

          Market Implications Ahead of August Meeting

          Following a benign inflation report, markets are again betting heavily on an August rate cut to 3.60%, partly in the belief that the MPB would avoid delivering back-to-back surprises. Yet, Deputy Governor Andrew Hauser admitted the July decision was less predictable than intended and stressed that while unpredictability wouldn’t become the norm, “shocks from time to time” should be expected.
          This evolving governance structure puts Australia in a unique position among developed economies, introducing a layer of political appointment influence and communication opacity. For investors, the lack of consistent guidance means positioning ahead of rate announcements now carries greater risk and potentially larger swings in currency and bond markets.
          The August 12 meeting will test whether the MPB is settling into a more predictable rhythm or if market participants must permanently adjust to higher policy uncertainty. If the board continues to avoid signalling its intentions, Australia could become one of the least transparent major central banks, forcing traders to rely more heavily on economic data rather than central bank commentary to anticipate moves.

          Source: Reuters

          To stay updated on all economic events of today, please check out our Economic calendar
          Risk Warnings and Disclaimers
          You understand and acknowledge that there is a high degree of risk involved in trading. Following any strategies or investment methods may lead to potential losses. The content on the site is provided by our contributors and analysts for information purposes only. You are solely responsible for determining whether any trading assets, securities, strategy, or any other product is suitable for investing based on your own investment objectives and financial situation.
          Add to Favorites
          Share
          FastBull
          Copyright © 2025 FastBull Ltd

          728 RM B 7/F GEE LOK IND BLDG NO 34 HUNG TO RD KWUN TONG KLN HONG KONG

          TelegramInstagramTwitterfacebooklinkedin
          App Store Google Play Google Play
          Products
          Charts

          Chats

          Q&A with Experts
          Screeners
          Economic Calendar
          Data
          Tools
          Membership
          Features
          Function
          Markets
          Copy Trading
          Latest Signals
          Contests
          News
          Analysis
          24/7
          Columns
          Education
          Company
          Careers
          About Us
          Contact Us
          Advertising
          Help Center
          Feedback
          User Agreement
          Privacy Policy
          Business

          White Label

          Data API

          Web Plug-ins

          Poster Maker

          Affiliate Program

          Risk Disclosure

          The risk of loss in trading financial instruments such as stocks, FX, commodities, futures, bonds, ETFs and crypto can be substantial. You may sustain a total loss of the funds that you deposit with your broker. Therefore, you should carefully consider whether such trading is suitable for you in light of your circumstances and financial resources.

          No decision to invest should be made without thoroughly conducting due diligence by yourself or consulting with your financial advisors. Our web content might not suit you since we don't know your financial conditions and investment needs. Our financial information might have latency or contain inaccuracy, so you should be fully responsible for any of your trading and investment decisions. The company will not be responsible for your capital loss.

          Without getting permission from the website, you are not allowed to copy the website's graphics, texts, or trademarks. Intellectual property rights in the content or data incorporated into this website belong to its providers and exchange merchants.

          Not Logged In

          Log in to access more features

          FastBull Membership

          Not yet

          Purchase

          Become a signal provider
          Help Center
          Customer Service
          Dark Mode
          Price Up/Down Colors

          Log In

          Sign Up

          Position
          Layout
          Fullscreen
          Default to Chart
          The chart page opens by default when you visit fastbull.com