• Trade
  • Markets
  • Copy
  • Contests
  • News
  • 24/7
  • Calendar
  • Q&A
  • Chats
Trending
Screeners
SYMBOL
LAST
BID
ASK
HIGH
LOW
NET CHG.
%CHG.
SPREAD
SPX
S&P 500 Index
6827.42
6827.42
6827.42
6899.86
6801.80
-73.58
-1.07%
--
DJI
Dow Jones Industrial Average
48458.04
48458.04
48458.04
48886.86
48334.10
-245.98
-0.51%
--
IXIC
NASDAQ Composite Index
23195.16
23195.16
23195.16
23554.89
23094.51
-398.69
-1.69%
--
USDX
US Dollar Index
97.920
98.000
97.920
98.070
97.810
-0.030
-0.03%
--
EURUSD
Euro / US Dollar
1.17448
1.17456
1.17448
1.17596
1.17262
+0.00054
+ 0.05%
--
GBPUSD
Pound Sterling / US Dollar
1.33843
1.33851
1.33843
1.33961
1.33546
+0.00136
+ 0.10%
--
XAUUSD
Gold / US Dollar
4331.01
4331.35
4331.01
4350.16
4294.68
+31.62
+ 0.74%
--
WTI
Light Sweet Crude Oil
56.843
56.873
56.843
57.601
56.789
-0.390
-0.68%
--

Community Accounts

Signal Accounts
--
Profit Accounts
--
Loss Accounts
--
View More

Become a signal provider

Sell trading signals to earn additional income

View More

Guide to Copy Trading

Get started with ease and confidence

View More

Signal Accounts for Members

All Signal Accounts

Best Return
  • Best Return
  • Best P/L
  • Best MDD
Past 1W
  • Past 1W
  • Past 1M
  • Past 1Y

All Contests

  • All
  • Trump Updates
  • Recommend
  • Stocks
  • Cryptocurrencies
  • Central Banks
  • Featured News
Top News Only
Share

Portugal Treasury Expects 2026 Net Financing Needs At 29.4 Billion Euros, Up From 25.8 Billion In 2025

Share

Bank Of America Says With Indonesia's Smelter Now Ramping Up, It Expects Aluminium Supply Growth To Accelerate To 2.6% Year On Year In 2026

Share

Bank Of America Expects A Deficit In Aluminium Next Year And Sees Prices Pushing Above $3000/T

Share

Fed Data - USA Effective Federal Funds Rate At 3.64 Percent On 12 December On $102 Billion In Trades Versus 3.64 Percent On $99 Billion On 11 December

Share

Brazil's Petrobras Says No Impact Seen On Oil, Petroleum Products Output As Workers Start Planned Strike

Share

Statement: US Travel Group Warns New Proposed Trump Administration Requirements For Foreign Tourists To Provide Social Media Histories Could Mean Millions Of People Opting Not To Visit

Share

Blackrock: Kerry White Will Become Head Of Citi Investment Management At Citi Wealth

Share

Blackrock: Rob Jasminski, Head Of Citi Investment Management, Has Joined With Team

Share

Blackrock: Effective Dec 15, Citi Investment Management Employees Will Join Blackrock

Share

Blackrock: Formally Launch Citi Portfolio Solutions Powered By Blackrock

Share

According To Data From The Federal Reserve Bank Of New York, The Secured Overnight Funding Rate (Sofr) Was 3.67% On The Previous Trading Day (December 15), Compared To 3.66% The Day Before

Share

Peru Energy And Mines Ministry: Copper Production Up 4.8% Year-On-Year In October To 248192 Metric Tons

Share

Security Source: Ukrainian Drones Hits Russian Oil Infrastructure In Caspian Sea For Third Time

Share

Spot Palladium Extends Gains, Last Up 5% To $1562.7/Oz

Share

Mexico's Economy Ministry Announces Start Of Anti-Dumping Investigation And Anti-Subsidy Investigations Into USA Pork Imports

Share

Canada Nov CPI Common +2.8%, CPI Median +2.8%, CPI Trim +2.8% On Year

Share

NY Fed's Empire State Prices Paid Index +37.6 In December Versus+49.0 In November

Share

Canada Nov Consumer Prices +0.1% On Month, +2.2% On Year

Share

Canada Nov CPI Core -0.1% On Month, +2.9% On Year

Share

Canada Nov Core CPI, Seasonally Adjusted +0.2% On Month, Oct +0.3% (Unrevised)

TIME
ACT
FCST
PREV
Japan Tankan Small Manufacturing Outlook Index (Q4)

A:--

F: --

P: --

Japan Tankan Large Non-Manufacturing Outlook Index (Q4)

A:--

F: --

P: --

Japan Tankan Large Manufacturing Outlook Index (Q4)

A:--

F: --

P: --

Japan Tankan Small Manufacturing Diffusion Index (Q4)

A:--

F: --

P: --

Japan Tankan Large Manufacturing Diffusion Index (Q4)

A:--

F: --

P: --

Japan Tankan Large-Enterprise Capital Expenditure YoY (Q4)

A:--

F: --

P: --

U.K. Rightmove House Price Index YoY (Dec)

A:--

F: --

P: --

China, Mainland Industrial Output YoY (YTD) (Nov)

A:--

F: --

P: --

China, Mainland Urban Area Unemployment Rate (Nov)

A:--

F: --

P: --

Saudi Arabia CPI YoY (Nov)

A:--

F: --

P: --

Euro Zone Industrial Output YoY (Oct)

A:--

F: --

P: --

Euro Zone Industrial Output MoM (Oct)

A:--

F: --

P: --

Canada Existing Home Sales MoM (Nov)

A:--

F: --

P: --

Canada National Economic Confidence Index

A:--

F: --

P: --

Canada New Housing Starts (Nov)

A:--

F: --

P: --
U.S. NY Fed Manufacturing Employment Index (Dec)

A:--

F: --

P: --

U.S. NY Fed Manufacturing Index (Dec)

A:--

F: --

P: --

Canada Core CPI YoY (Nov)

A:--

F: --

P: --

Canada Manufacturing Unfilled Orders MoM (Oct)

A:--

F: --

P: --

U.S. NY Fed Manufacturing Prices Received Index (Dec)

A:--

F: --

P: --

U.S. NY Fed Manufacturing New Orders Index (Dec)

A:--

F: --

P: --

Canada Manufacturing New Orders MoM (Oct)

A:--

F: --

P: --

Canada Core CPI MoM (Nov)

A:--

F: --

P: --

Canada Trimmed CPI YoY (SA) (Nov)

A:--

F: --

P: --

Canada Manufacturing Inventory MoM (Oct)

A:--

F: --

P: --

Canada CPI YoY (Nov)

A:--

F: --

P: --

Canada CPI MoM (Nov)

A:--

F: --

P: --

Canada CPI YoY (SA) (Nov)

A:--

F: --

P: --

Canada Core CPI MoM (SA) (Nov)

A:--

F: --

P: --

Canada CPI MoM (SA) (Nov)

A:--

F: --

P: --

Federal Reserve Board Governor Milan delivered a speech
U.S. NAHB Housing Market Index (Dec)

--

F: --

P: --

Australia Composite PMI Prelim (Dec)

--

F: --

P: --

Australia Services PMI Prelim (Dec)

--

F: --

P: --

Australia Manufacturing PMI Prelim (Dec)

--

F: --

P: --

Japan Manufacturing PMI Prelim (SA) (Dec)

--

F: --

P: --

U.K. 3-Month ILO Employment Change (Oct)

--

F: --

P: --

U.K. Unemployment Claimant Count (Nov)

--

F: --

P: --

U.K. Unemployment Rate (Nov)

--

F: --

P: --

U.K. 3-Month ILO Unemployment Rate (Oct)

--

F: --

P: --

U.K. Average Weekly Earnings (3-Month Average, Including Bonuses) YoY (Oct)

--

F: --

P: --

U.K. Average Weekly Earnings (3-Month Average, Excluding Bonuses) YoY (Oct)

--

F: --

P: --

France Services PMI Prelim (Dec)

--

F: --

P: --

France Composite PMI Prelim (SA) (Dec)

--

F: --

P: --

France Manufacturing PMI Prelim (Dec)

--

F: --

P: --

Germany Services PMI Prelim (SA) (Dec)

--

F: --

P: --

Germany Manufacturing PMI Prelim (SA) (Dec)

--

F: --

P: --

Germany Composite PMI Prelim (SA) (Dec)

--

F: --

P: --

Euro Zone Composite PMI Prelim (SA) (Dec)

--

F: --

P: --

Euro Zone Services PMI Prelim (SA) (Dec)

--

F: --

P: --

Euro Zone Manufacturing PMI Prelim (SA) (Dec)

--

F: --

P: --

U.K. Services PMI Prelim (Dec)

--

F: --

P: --

U.K. Manufacturing PMI Prelim (Dec)

--

F: --

P: --

U.K. Composite PMI Prelim (Dec)

--

F: --

P: --

Euro Zone ZEW Economic Sentiment Index (Dec)

--

F: --

P: --

Germany ZEW Current Conditions Index (Dec)

--

F: --

P: --

Germany ZEW Economic Sentiment Index (Dec)

--

F: --

P: --

Euro Zone Trade Balance (Not SA) (Oct)

--

F: --

P: --

Euro Zone ZEW Current Conditions Index (Dec)

--

F: --

P: --

Euro Zone Trade Balance (SA) (Oct)

--

F: --

P: --

U.S. Retail Sales MoM (Excl. Automobile) (SA) (Oct)

--

F: --

P: --

Q&A with Experts
    • All
    • Chatrooms
    • Groups
    • Friends
    Connecting
    .
    .
    .
    Type here...
    Add Symbol or Code

      No matching data

      All
      Trump Updates
      Recommend
      Stocks
      Cryptocurrencies
      Central Banks
      Featured News
      • All
      • Russia-Ukraine Conflict
      • Middle East Flashpoint
      • All
      • Russia-Ukraine Conflict
      • Middle East Flashpoint
      Search
      Products

      Charts Free Forever

      Chats Q&A with Experts
      Screeners Economic Calendar Data Tools
      Membership Features
      Data Warehouse Market Trends Institutional Data Policy Rates Macro

      Market Trends

      Market Sentiment Order Book Forex Correlations

      Top Indicators

      Charts Free Forever
      Markets

      News

      News Analysis 24/7 Columns Education
      From Institutions From Analysts
      Topics Columnists

      Latest Views

      Latest Views

      Trending Topics

      Top Columnists

      Latest Update

      Signals

      Copy Rankings Latest Signals Become a signal provider AI Rating
      Contests
      Brokers

      Overview Brokers Assessment Rankings Regulators News Claims
      Broker listing Forex Brokers Comparison Tool Live Spread Comparison Scam
      Q&A Complaint Scam Alert Videos Tips to Detect Scam
      More

      Business
      Events
      Careers About Us Advertising Help Center

      White Label

      Data API

      Web Plug-ins

      Affiliate Program

      Awards Institution Evaluation IB Seminar Salon Event Exhibition
      Vietnam Thailand Singapore Dubai
      Fans Party Investment Sharing Session
      FastBull Summit BrokersView Expo
      Recent Searches
        Top Searches
          Markets
          News
          Analysis
          User
          24/7
          Economic Calendar
          Education
          Data
          • Names
          • Latest
          • Prev

          View All

          No data

          Scan to Download

          Faster Charts, Chat Faster!

          Download App
          English
          • English
          • Español
          • العربية
          • Bahasa Indonesia
          • Bahasa Melayu
          • Tiếng Việt
          • ภาษาไทย
          • Français
          • Italiano
          • Türkçe
          • Русский язык
          • 简中
          • 繁中
          Open Account
          Search
          Products
          Charts Free Forever
          Markets
          News
          Signals

          Copy Rankings Latest Signals Become a signal provider AI Rating
          Contests
          Brokers

          Overview Brokers Assessment Rankings Regulators News Claims
          Broker listing Forex Brokers Comparison Tool Live Spread Comparison Scam
          Q&A Complaint Scam Alert Videos Tips to Detect Scam
          More

          Business
          Events
          Careers About Us Advertising Help Center

          White Label

          Data API

          Web Plug-ins

          Affiliate Program

          Awards Institution Evaluation IB Seminar Salon Event Exhibition
          Vietnam Thailand Singapore Dubai
          Fans Party Investment Sharing Session
          FastBull Summit BrokersView Expo

          Dollar Hedges Bloom

          Warren Takunda

          Economic

          Summary:

          A key driver of U.S. Dollar weakness remains intact: hedging against USD weakness.

          According to a much-watched survey of fund managers from Bank of America, 38% of respondents reported they are looking to increase hedges against a weaker dollar.
          This is up from 33% in August and the highest level since Jun 2025.
          The findings confirm investors are selling dollars as they engage in trades that provide a hedge against further USD weakness.
          Why hedge? A falling dollar means lower returns for foreign investors holding U.S. equities, as the value of repatriated funds declines due to currency movement.
          When the dollar was in a multi-year bull run this wasn't a problem; in fact being unhedged increased your returns as the USD value rises against your home currency.
          This all changed this year when the U.S. dollar slumped in the face of U.S. President Donald Trump's new agenda on trade and his desire to meddle in U.S. institutions.
          The need to hedge against a lower dollar fuels that decline as investors take out the trades that profit on USD weakness to cover for currency-adjusted losses on their portfolios. In short, this hedging behaviour fuels USD weakness and adds impetus to the selloff.
          Bank of America's findings tell us investors look to increase hedges, which suggests this source of USD weakness has space to run.
          Another interesting takeaway from the survey is that 26% of respondents view a 2nd wave of inflation as the biggest tail risk, followed by 24% saying "Fed loses independence & US dollar debasement" is the biggest tail risk.
          Trump's efforts to mould the Fed in his image are well underway, while the Fed is about to cut rates tomorrow, as inflation looks anchored well above 2.0%. This is what the foundations of a debasement are built on.
          One problem for euro bulls, however, is that the rotation into European assets appears to have stalled.
          The survey finds "the view of EU exceptionalism has been dented, with the EU equity overweight slipping further and the gap to the continued US equity underweight falling to the lowest level since February."
          If a rotation into European equities underpinned outright euro support in H1, its demise could imply slower going for euro-dollar in H2.

          Source: Poundsterlinglive

          To stay updated on all economic events of today, please check out our Economic calendar
          Risk Warnings and Disclaimers
          You understand and acknowledge that there is a high degree of risk involved in trading. Following any strategies or investment methods may lead to potential losses. The content on the site is provided by our contributors and analysts for information purposes only. You are solely responsible for determining whether any trading assets, securities, strategy, or any other product is suitable for investing based on your own investment objectives and financial situation.
          Add to Favorites
          Share

          US Retail Sales Beat Forecasts in Sign of Solid Summer Spending

          Glendon

          Economic

          Forex

          US retail sales rose in August for a third month in a broad advance, rounding out a resilient summer of spending.

          The value of retail purchases, not adjusted for inflation, increased 0.6% after a similar gain in July, Commerce Department data showed Tuesday. That beat all estimates in a Bloomberg survey of economists. Excluding cars, sales climbed 0.7%.

          Nine out of 13 categories posted increases, led by online retailers, clothing stores and sporting goods, likely reflecting back-to-school shopping. Motor vehicle sales rose at a slower pace.

          Tuesday’s report adds to evidence that consumers are still spending even as tariffs boost the cost of some goods, sentiment remains subdued and the labor market shows signs of faltering. Though wage growth has cooled, many workers’ pay gains continue to outpace inflation, and others, particularly the wealthy, are benefiting from a stock market rally.

          Federal Reserve officials are closely tracking consumer spending — which supports two-thirds of US economic activity — as they decide the trajectory of interest rates. While they’re still assessing the impact President Donald Trump’s tariffs will ultimately have on prices, they’re widely expected to cut rates at the end of their two-day meeting Wednesday in an effort to shield the labor market from further deterioration.

          Stock futures remained higher and Treasury yields rose after the report.

          The retail sales report showed so-called control-group sales — which feed into the government’s calculation of goods spending for gross domestic product — climbed 0.7% in August, so far indicating a healthy third quarter. The measure excludes food services, auto dealers, building materials stores and gasoline stations.

          The retail sales figures largely reflect purchases of goods, which comprise roughly a third of overall consumer outlays. Because the data are not adjusted for inflation, an advance could also reflect the impact of higher prices. A report on real spending on goods and services for August will be released later this month.

          Spending at restaurants and bars, the only service-sector category in the retail report, advanced 0.7% after declining in the prior month.

          Inflation data out last week suggested companies largely refrained from price hikes last month, as many firms have been wary that steep markups could push customers away.

          Source: Bloomberg Europe

          To stay updated on all economic events of today, please check out our Economic calendar
          Risk Warnings and Disclaimers
          You understand and acknowledge that there is a high degree of risk involved in trading. Following any strategies or investment methods may lead to potential losses. The content on the site is provided by our contributors and analysts for information purposes only. You are solely responsible for determining whether any trading assets, securities, strategy, or any other product is suitable for investing based on your own investment objectives and financial situation.
          Add to Favorites
          Share

          Canada's Annual Inflation Rate in August Rises Lower Than Expected

          Michelle

          Economic

          Forex

          Canada's annual inflation rate rose 1.9% in August as petrol prices on a yearly basis fell at a slower pace than the previous month and food prices were up slightly, data showed on Tuesday.

          The annual inflation rate has been largely distorted by the cancellation of the carbon levy on petrol sale which has helped bring down the cost of the fuel on a yearly basis, and economists have focused on core inflation measures to gauge the trend of prices.

          On a monthly basis, the consumer price index was down 0.1% in August, Statistics Canada said.

          Analysts polled by Reuters had forecast the annual inflation rate at 2% in August from 1.7% in July, and on a month-on-month basis to increase by 0.1% from 0.3% in the prior month.

          The lower than expected rise in inflation is likely to bolster chances of a rate cut on Wednesday by the Bank of Canada, even though there are still concerns that underlying inflation was still high.

          Money markets are expecting almost 87% chances of a 25 basis point rate cut on Sept. 17. (0#CADIRPR)

          The BoC has kept its benchmark policy rate on hold since March at 2.75% but a slew of data in the last few weeks have propped up the case for restarting the rate reduction cycle.

          Petrol prices were the biggest contributor to the rise in inflation in August and rose 1.4% on a monthly basis. However on a yearly basis, the price of fuel dropped 12.7% in August from 16.1% decline in July, the statistics agency noted. This helped in bringing down transportation costs by 0.5% in August.

          Excluding gasoline, the CPI rose 2.4% in August, after increasing 2.5% in each of the previous three months, StatsCan said.

          One of the core measures of inflation, the CPI-median, or the centermost component of the CPI basket, mirrored the prior month's 3.1% rise in August. The other core measure CPI-trim, which excludes the most extreme price changes, fell to 3% from 3.1% in July.

          The share of the CPI basket which is above 3% rose to 39.1% in August from 37.3% in July, indicating resilient underling inflation.

          Prices for shelter, which accounts for almost 30% of the CPI basket, rose by 2.6% in August from 3% in July as costs for both mortgage costs and rents eased.

          Food prices rose by 3.4% in August as prices for meat rose 7.2% year over year, following a 4.7% increase in July, StatsCan said.

          Source: TradingView

          To stay updated on all economic events of today, please check out our Economic calendar
          Risk Warnings and Disclaimers
          You understand and acknowledge that there is a high degree of risk involved in trading. Following any strategies or investment methods may lead to potential losses. The content on the site is provided by our contributors and analysts for information purposes only. You are solely responsible for determining whether any trading assets, securities, strategy, or any other product is suitable for investing based on your own investment objectives and financial situation.
          Add to Favorites
          Share

          London Midday: FTSE Falls Further as Investors Mull Jobs Data

          Warren Takunda

          Economic

          Stocks

          London stocks had fallen a little further by midday on Tuesday as the latest UK jobs data cemented expectations there will be no more rate cuts from the Bank of England this year.
          The FTSE 100 was down 0.3% at 9,250.63, while sterling was up 0.3% against the dollar at 1.3637 amid expectations of a US interest rate cut on Wednesday.
          Matt Britzman, senior equity analyst at Hargreaves Lansdown, said stocks were in "a holding pattern with investors scanning the horizon for a catalyst as central bank decisions loom large".
          He continued: "With the Fed expected to cut and the Bank of England likely to stay put, traders are watching for cues that could shift sentiment.
          "Meanwhile, UK-US tech and AI talks are drawing attention, as American giants pledge billions to support Britain’s ambitions in the sector - planting the early seeds for much-needed economic growth.
          "Signs of cooling are emerging in the UK labour market, but wage growth remains stubbornly high, still well above levels consistent with the Bank of England’s inflation target. The slight dip in pay growth and falling payrolls suggest momentum is easing, yet services inflation remains sticky, keeping rate cut hopes firmly on ice. With UK rates likely on hold as we move into 2026, markets may need to recalibrate expectations around the timing and pace of policy easing."
          Figures from the Office for National Statistics showed the unemployment rate was unchanged in July, in line with expectations, while wage growth cooled.
          The rate was estimated to be 4.7% in May to July. The employment rate was 75.2%.
          The number of payrolled employees softened, however, by 142,000 year-on-year in July, and by 6,000 month-on-month.
          On a three-month basis, the number of payrolled employees eased 0.4% over the year, and by 0.2% over the quarter.
          Looking to August, the ONS said provisional estimates indicated that payrolled employees fell by 0.4% year-on-year but were flat month-on-month.
          Earnings, meanwhile, ticked lower. Annual growth in employees’ average earnings, excluding bonuses, was 4.8%, down slightly on June’s 5% although it was in line with expectations.
          Including bonuses, and average earnings ticked higher to 4.7% from 4.6%, also in line with consensus.
          Pay rose faster in the public sector, up 5.6% on the year, compared to a 4.7% uplift in the private sector.
          Liz McKeown, director of economic statistics at the ONS, said: "The labour market continues to cool, with the number of people on payroll falling again, while firms also told us there were fewer jobs in the latest period.
          "This weakness is reflected in a slight increase on the quarter in the unemployment rate. The number of vacancies also fell, though the rate of decline appears to be slowing.
          "Wage growth excluding bonuses edged down further in cash terms, though it remains strong by historic standards."
          In equity markets, SThree tumbled as the recruiter maintained its profit outlook for FY25 but cut guidance for FY26 as it reported a drop in third-quarter net fees and said overall new business activity was set to remain challenging.
          Peers Hays and PageGroup also suffered heavy losses.
          Unilever lost ground as it announced that acting finance lead Srinivas Phatak has been appointed as its permanent chief financial officer, having "performed strongly" since stepping into the position seven months ago.
          On the upside, precious metals miner Fresnillo shone as gold prices hovered near $3,700 on a weaker dollar and mounting expectations the Federal Reserve will cut interest rates this week.
          Hochschild Mining gained after saying it has appointed Vale veteran Cassio Diedrich as its new chief operating officer.
          Trustpilot shot higher as it boosted its full-year outlook after a strong first half saw earnings beat expectations.
          Infrastructure and construction group Kier surged as it said trading at the start of its current financial year was slightly ahead of expectations, reporting a 15% jump in profit for the 12 months to June 30.
          In broker note action, Ashtead was lifted by an upgrade to ‘outperform’ at BNP Paribas Exane.
          Haleon was in the red after a downgrade to ‘equalweight’ from ‘overweight’ at Barclays, while easyJet fell after a downgrade to ‘neutral’ from ‘overweight’ by JPMorgan.
          Domino’s Pizza was knocked lower by a downgrade to ‘hold’ from ‘buy’ at Deutsche Bank, which cut the price target to 235p from 309p.

          Source: Sharecast

          To stay updated on all economic events of today, please check out our Economic calendar
          Risk Warnings and Disclaimers
          You understand and acknowledge that there is a high degree of risk involved in trading. Following any strategies or investment methods may lead to potential losses. The content on the site is provided by our contributors and analysts for information purposes only. You are solely responsible for determining whether any trading assets, securities, strategy, or any other product is suitable for investing based on your own investment objectives and financial situation.
          Add to Favorites
          Share

          GBP/USD Technical: Sterling Rallied to A New 4-Week High, Eyeing Next Resistance at 1.3715/3750 As FOMC Looms

          Blue River

          Technical Analysis

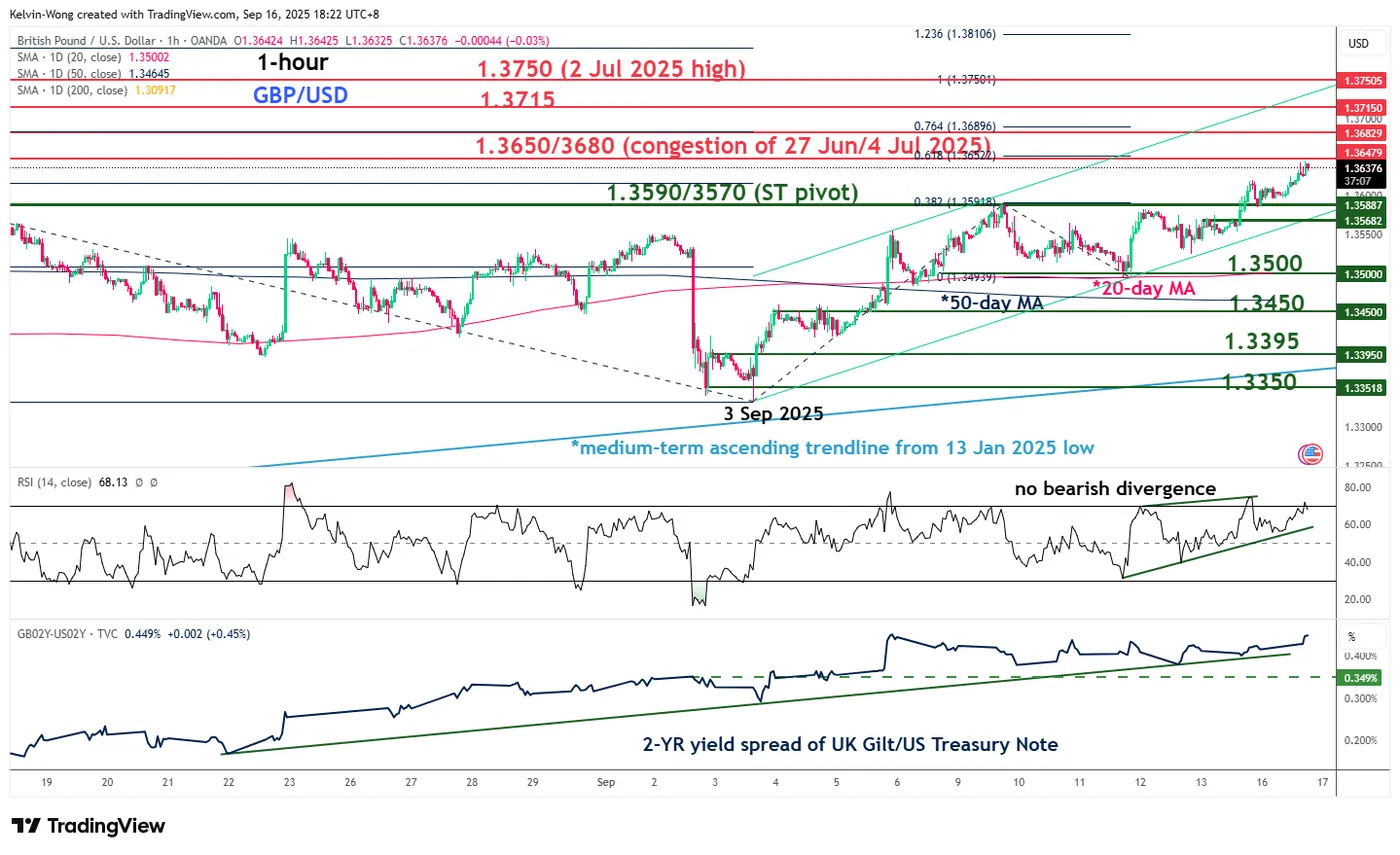
          The price actions of the sterling have staged the expected recovery against the US dollar, as the GBP/USD has rallied by 1.2% and almost hit the lower limit of our highlighted resistance zone of 1.3650/1.3680 (printed an intraday high of 1.3645 on Tuesday, 16 September 2025, at the time of writing).

          Today’s stellar performance of the GBP/USD (+0.3% has also been reinforced by better-than-expected July’s employment change data for the UK, which came in at 232,000, above the consensus of 222,000, while the unemployment rate remained steady for the third consecutive month at 4.7%, in line with expectations.

          Let’s now update the short-term (1 to 3 days) trajectory and key technical elements of the GBP/USD ahead of tomorrow’s FOMC monetary policy decision outcome and the release of the latest Fed economic projections (dot plot).

          Fig. 1: GBP/USD minor trend as of 16 Sep 2025 (Source: TradingView)

          Preferred trend bias (1-3 days)

          A new minor bullish impulsive up move sequence is likely to have kicked off for the GBP/USD from its 3 September 2025 minor bullish reversal low of 1.3333 on the onset of the intraday spike up of the 30-year UK gilt yield over fiscal policy fears.

          Maintain bullish bias above a tightened short-term pivotal support of 1.3590/1.3570 on the GBP/USD, with the next intermediate resistances to come in at 1.3715 and 1.3750 (also a Fibonacci extension).

          Key elements

          • The latest price actions of the GBP/USD since 3 September 2025 have evolved into a minor ascending channel, with its upper boundary now standing at around 1.3750.
          • The GBP/USD has traded above its 20-day and 50-day moving averages since 5 September 2025, which reinforces the potential ongoing minor bullish impulsive up move sequence.
          • The hourly RSI momentum indicator of the GBP/USD has continued to evolve in a bullish momentum condition as it manages to hold above its ascending support.
          • The 2-year yield spread premium between the UK gilt and US Treasury note has continued to expand (inched higher) since the 3 September 2025 level of 0.29% to a current level of 0.45% at the time of writing.
          • These observations indicate that short-term UK gilts remain relatively more attractive than US Treasuries due to their yield premium, creating a positive feedback loop that supports further strength in the GBP/USD.

          Alternative trend bias (1 to 3 days)

          A break below 1.3570 key short-term support in GBP/USD will negate the bullish tone for a deeper minor corrective decline to expose the next intermediate supports at 1.3500 (also the 20-day moving average) and 1.3450 (also the 50-day moving average)

          Source: ACTIONFOREX

          Risk Warnings and Disclaimers
          You understand and acknowledge that there is a high degree of risk involved in trading. Following any strategies or investment methods may lead to potential losses. The content on the site is provided by our contributors and analysts for information purposes only. You are solely responsible for determining whether any trading assets, securities, strategy, or any other product is suitable for investing based on your own investment objectives and financial situation.
          Add to Favorites
          Share

          Fed Rate Cut Playbook: Where Markets Could Shine

          SAXO

          Forex

          Political

          Economic

          Key points:

          ● The Fed is expected to cut rates this week, marking the start of an easing cycle after softer labor and inflation data. Equity leadership could broaden, with lower rates extending gains beyond mega-cap tech into small caps, utilities, financials, and emerging markets.
          ● Bonds and real assets regain their role, as medium-duration Treasuries and quality credit offer diversification while gold becomes more compelling with falling funding costs.
          ● Cash is no longer king. With money-market yields set to fade, idle cash risks underperforming. Investors can redeploy liquidity into bonds for yield, equities for growth, or real assets like gold and infrastructure for diversification.

          The Fed looks set to cut rates this week after a string of softer data. Job growth has slowed, unemployment has edged up, producer prices turned negative in August, and consumer inflation was broadly in line. This marks the start of an easing cycle.For long-term investors, the key is not the size of the cut, but how different asset classes and segments might respond.

          Equities: Leadership broadens

          Equities often benefit from easier monetary policy because lower rates reduce financing costs and improve valuations. The opportunity set is also expanding beyond mega-cap technology.

          ● Tech stocks: Lower discount rates help growth names, but the real story is in structural AI themes — semiconductors, cloud, and power-hungry data centres.Saxo’s AI value chain shortlist captures these areas, which continue to show earnings strength even as valuations in mega-cap tech look stretched.
          ● Utilities: Utilities are traditionally viewed as bond proxies, benefiting from lower yields through more attractive dividend payouts. This time, however, they also sit at the centre of the AI power boom, as electricity demand and grid investment rise. The sector could therefore benefit both from falling rates and from structural demand for power.
          ● Banks: Lower policy rates squeeze net interest margins (NIMs), especially if loan yields reset lower faster than deposit costs. That’s why banks sometimes lag when rate cuts begin. But if cuts extend the cycle and keep credit conditions healthy, banks can benefit from higher loan growth and lower default risk. Large U.S. banks may be more resilient, while EM banks often benefit more directly from a weaker USD and stronger capital inflows.
          ● Real Estate & Homebuilders: REITs gain from lower yields, but U.S. homebuilders are more nuanced - financing costs ease, yet oversupply risks could limit upside.
          ● Small caps: Smaller companies suffered under high borrowing costs, but cuts could ease the pressure and open the door for a catch-up trade. Valuations are attractive compared with history, though balance sheet strength will be critical in separating potential winners from over-leveraged firms, as highlighted in this article. The scope for relative outperformance is highest if economic growth stabilises rather than stalls.
          ● Emerging markets: A weaker dollar generally attracts flows into EM, easing external debt burdens and supporting equity performance. Asia’s exporters and commodity-linked economies stand out, but positioning remains nuanced. Countries with solid external balances and reform momentum are better placed, while fragile economies remain vulnerable to volatility if the dollar rebounds. We recently outlined 15 EM stocks in our article to show how investors can gain exposure to this theme.

          In summary, any sector where large upfront capital spending meets long-dated cash flows — such as miners, utilities, renewables, infrastructure, pipelines, and REITs — stands to gain more than average when financing costs ease. Pairing these capital-heavy sectors with structural demand themes like AI power, electrification, and the energy transition makes the case even stronger.

          Bonds: Quality as a diversifier

          Quality fixed income offers attractive risk-reward and diversification benefits. Lower policy rates are likely to push Treasury yields down, creating space for government and investment-grade bonds to deliver mid-single-digit returns over the next year. If U.S. growth slows further, yields could fall quickly, giving bonds added capital gains.

          ● Medium-duration Treasuries: With policy rates set to fall, intermediate Treasuries can offer a sweet spot — long enough to capture capital gains if yields drop, but not so long as to be overly exposed to swings in the term premium. This makes them attractive as part of a balanced allocation.
          ● Inflation-linked bonds (TIPS): While headline inflation is easing, sticky services components and tariff risks for goods inflation mean inflation surprises cannot be ruled out. TIPS provide protection in such scenarios, helping investors manage the risk of real yields moving higher unexpectedly.
          ● Asia and Europe credit: Selective credit opportunities may also emerge as financing conditions ease globally. Spreads remain elevated in some markets, offering potential for returns beyond Treasuries, but careful selection is key to avoid credit traps in weaker names.
          ● Cash versus bonds: With cash yields likely to roll down as the Fed cuts, cash will underperform on a longer-term basis. Allocating more liquidity into quality fixed income may help investors maintain both income and diversification benefits.

          Real assets: Gold and energy infrastructure

          ● Gold: For much of the past two years, high funding costs made gold less attractive as it pays no income. When cash and short-term bonds yielded 4–5%, holding gold came with a clear “carry drag.” As rates fall, that drag shrinks, making bullion more appealing for investors who had previously preferred yield. Meanwhile, structural trends continue to support gold as central bank demand remains robust, and with policy and geopolitical uncertainty still elevated, gold continues to play an important role as a hedge.
          ● Gold miners: Miners offer leveraged exposure to the gold price because revenues rise with bullion, while costs (energy, labour, equipment) move at a slower pace. When gold is trending higher, miners can outperform bullion, though they also carry greater volatility and operational risks.
          ● Infrastructure and energy: Lower financing costs are supportive for capital-intensive assets such as utilities, infrastructure, and real estate investment trusts. In particular, digital infrastructure and uranium play directly into the rising electricity demand created by AI, as data centres and grid upgrades require massive investment. These areas offer cyclical relief from falling rates and secular growth from structural demand shifts.

          The role of cash: Don’t let it sit idle

          Cash was a comfortable trade when deposits and money-market funds yielded 4–5%. With rate cuts on the way, those returns will fade quickly, making idle cash less attractive.

          ● Bonds as the next step: Shifting spare liquidity into quality fixed income can lock in attractive yields before they fall further. Bonds also provide diversification if growth slows and equities stumble.
          ● Equities for long-term growth: For investors with longer horizons, cash can be rotated into equities to capture compounding over time. Lower rates can broaden the equity rally beyond mega-cap tech into small caps, utilities, and emerging markets.
          ● Alternatives and real assets: Cash can also be redeployed into gold, infrastructure, or other real assets that benefit from easier financing conditions. This helps balance portfolios against inflation, policy mistakes, or geopolitical shocks.

          Risks still loom

          ● Sticky inflation: Services inflation, particularly in housing and wages, remains elevated. Meanwhile, goods inflation faces risks from rising tariffs. If inflation does not continue to cool further, the Fed may be forced to slow or even halt its rate-cut cycle. That could dampen bond rallies and keep pressure on equity valuations.
          ● A “bad cut”: Not all cuts are equal. If easing is driven by deteriorating growth or recession fears, corporate earnings could fall. In that scenario, valuation relief from lower rates might not be enough to offset weaker fundamentals.
          ● AI roadblocks: The AI story has powered a large share of equity gains, but it is still early-stage. Delays in scaling data centres, bottlenecks in chip supply, or slower monetisation of AI services could challenge valuations. If the AI cycle disappoints, leadership in equities could narrow again.
          ● Political interference and Fed independence: Political pressure on the Fed could raise risk premiums across markets. A perception that monetary policy is being steered by politics, rather than data, could undermine investor confidence.
          ● USD rebound: A sudden resurgence in the U.S. dollar — triggered by stronger-than-expected U.S. growth, fiscal concerns abroad, or geopolitical shocks — could undermine EM and commodity-linked assets that usually benefit from easier policy.
          ● Geopolitical flashpoints: Conflicts in the Middle East, Taiwan Strait, or Eastern Europe could disrupt energy supplies, global trade, and investor sentiment. These risks may drive safe-haven flows into the dollar or gold, while weighing on risk assets.

          Bottom line

          Rate cuts mark a turning point in the policy cycle. Equities could broaden beyond mega-cap tech into small caps, utilities, and EM. Bonds regain their role as a true diversifier, while gold and infrastructure look more attractive as funding costs ease.Most importantly, idle cash is set to underperform and it can be redeployed across bonds for yield, equities for growth, or real assets for diversification.The Fed is shifting gears, but inflation, growth, and politics will shape the road ahead.

          Source: SAXO

          To stay updated on all economic events of today, please check out our Economic calendar
          Risk Warnings and Disclaimers
          You understand and acknowledge that there is a high degree of risk involved in trading. Following any strategies or investment methods may lead to potential losses. The content on the site is provided by our contributors and analysts for information purposes only. You are solely responsible for determining whether any trading assets, securities, strategy, or any other product is suitable for investing based on your own investment objectives and financial situation.
          Add to Favorites
          Share

          Canada Bucks The Fiscal-Fretting Trend to Go for A Bigger Deficit

          Michelle

          Economic

          Forex

          Governments in the UK and France this year have been punished by bond investors over failures to shrink fiscal deficits, while in the US the Trump administration has been — for what it’s worth — making the case its policies will be reining in federal borrowing needs soon.

          Not all the Group of Seven advanced economies are focused on fiscal discipline, however. Germany’s infrastructure-cum-defense buildout initiative is well known. Another case that may get less attention: Canada.

          Prime Minister Mark Carney on Sunday confirmed he plans to run a “substantial” deficit — higher than last year’s shortfall of approximately C$48 billion ($35 billion). That reflects a broad plan to invest in the domestic economy and put growth on a trajectory in coming years that relies less on its southern neighbor, the US.

          President Donald Trump’s tariffs have hit Canada’s economy hard, triggering the first contraction in GDP in nearly two years last quarter. That’s eroding revenues and requiring spending to support industry and workers.

          Since his successful election campaign in April, Carney has outlined billions in additional federal expenditures to boost defense and increase construction of affordable housing.

          “There’s going to be implications for the deficit, but it’ll build a much stronger Canada moving forward,” Carney told reporters. For now, a (slight) majority of Canadians agree, with a recent poll offering the prime minister backing for his approach.

          Canada’s starting point is solid, with the lowest net debt to gross domestic product ratio in the G-7 — at little more than 40% last year, compared with roughly 100% for the US — and the top sovereign ratings from Moody’s and S&P.

          The latest survey of economists by Bloomberg reflects expectations for a deficit of over 2% of GDP this year, still well below the 3% that France is struggling to reach or the north-of-6% the US has been running.

          Also, Carney says his government will be looking for savings in other areas as it compiles the budget to be unveiled next month. The plan will feature both “austerity and investment,” he’s said, pushing for major reviews of operational spending in the public sector. A review of procurement practices is also in train.

          In something reminiscent of former UK Chancellor Gordon Brown’s “golden rule” (only borrow to fund investment over the economic cycle) Ottawa will be looking to separate the budget into operating expenses and capital investments, something economists are divided on.

          “Splitting the budget is just marketing — the ‘investment’ items are still outlays that will require financing,” says Stuart Paul of Bloomberg Economics.

          Source: Bloomberg Europe

          To stay updated on all economic events of today, please check out our Economic calendar
          Risk Warnings and Disclaimers
          You understand and acknowledge that there is a high degree of risk involved in trading. Following any strategies or investment methods may lead to potential losses. The content on the site is provided by our contributors and analysts for information purposes only. You are solely responsible for determining whether any trading assets, securities, strategy, or any other product is suitable for investing based on your own investment objectives and financial situation.
          Add to Favorites
          Share
          FastBull
          Copyright © 2025 FastBull Ltd

          728 RM B 7/F GEE LOK IND BLDG NO 34 HUNG TO RD KWUN TONG KLN HONG KONG

          TelegramInstagramTwitterfacebooklinkedin
          App Store Google Play Google Play
          Products
          Charts

          Chats

          Q&A with Experts
          Screeners
          Economic Calendar
          Data
          Tools
          Membership
          Features
          Function
          Markets
          Copy Trading
          Latest Signals
          Contests
          News
          Analysis
          24/7
          Columns
          Education
          Company
          Careers
          About Us
          Contact Us
          Advertising
          Help Center
          Feedback
          User Agreement
          Privacy Policy
          Business

          White Label

          Data API

          Web Plug-ins

          Poster Maker

          Affiliate Program

          Risk Disclosure

          The risk of loss in trading financial instruments such as stocks, FX, commodities, futures, bonds, ETFs and crypto can be substantial. You may sustain a total loss of the funds that you deposit with your broker. Therefore, you should carefully consider whether such trading is suitable for you in light of your circumstances and financial resources.

          No decision to invest should be made without thoroughly conducting due diligence by yourself or consulting with your financial advisors. Our web content might not suit you since we don't know your financial conditions and investment needs. Our financial information might have latency or contain inaccuracy, so you should be fully responsible for any of your trading and investment decisions. The company will not be responsible for your capital loss.

          Without getting permission from the website, you are not allowed to copy the website's graphics, texts, or trademarks. Intellectual property rights in the content or data incorporated into this website belong to its providers and exchange merchants.

          Not Logged In

          Log in to access more features

          FastBull Membership

          Not yet

          Purchase

          Become a signal provider
          Help Center
          Customer Service
          Dark Mode
          Price Up/Down Colors

          Log In

          Sign Up

          Position
          Layout
          Fullscreen
          Default to Chart
          The chart page opens by default when you visit fastbull.com