

Markets
News
Analysis
User
24/7
Economic Calendar
Education
Data
- Names
- Latest
- Prev


Signal Accounts for Members
All Signal Accounts
All Contests
 Japan Tankan Small Manufacturing Outlook Index (Q4)
A:--
F: --
P: --
Japan Tankan Large Non-Manufacturing Outlook Index (Q4)A:--
F: --
P: --
Japan Tankan Large Manufacturing Outlook Index (Q4)A:--
F: --
P: --
Japan Tankan Small Manufacturing Diffusion Index (Q4)A:--
F: --
P: --
Japan Tankan Large Manufacturing Diffusion Index (Q4)A:--
F: --
P: --
Japan Tankan Large-Enterprise Capital Expenditure YoY (Q4)A:--
F: --
P: --
 U.K. Rightmove House Price Index YoY (Dec)
A:--
F: --
P: --
 China, Mainland Industrial Output YoY (YTD) (Nov)
A:--
F: --
P: --
China, Mainland Urban Area Unemployment Rate (Nov)A:--
F: --
P: --
 Saudi Arabia CPI YoY (Nov)
A:--
F: --
P: --
 Euro Zone Industrial Output YoY (Oct)
A:--
F: --
P: --
Euro Zone Industrial Output MoM (Oct)A:--
F: --
P: --
 Canada Existing Home Sales MoM (Nov)
A:--
F: --
P: --
Canada National Economic Confidence IndexA:--
F: --
P: --
Canada New Housing Starts (Nov)A:--
F: --
 U.S. NY Fed Manufacturing Employment Index (Dec)
A:--
F: --
P: --
U.S. NY Fed Manufacturing Index (Dec)A:--
F: --
P: --
Canada Core CPI YoY (Nov)A:--
F: --
P: --
Canada Manufacturing Unfilled Orders MoM (Oct)A:--
F: --
P: --
U.S. NY Fed Manufacturing Prices Received Index (Dec)A:--
F: --
P: --
U.S. NY Fed Manufacturing New Orders Index (Dec)A:--
F: --
P: --
Canada Manufacturing New Orders MoM (Oct)A:--
F: --
P: --
Canada Core CPI MoM (Nov)A:--
F: --
P: --
Canada Trimmed CPI YoY (SA) (Nov)A:--
F: --
P: --
Canada Manufacturing Inventory MoM (Oct)A:--
F: --
P: --
Canada CPI YoY (Nov)A:--
F: --
P: --
Canada CPI MoM (Nov)A:--
F: --
P: --
Canada CPI YoY (SA) (Nov)A:--
F: --
P: --
Canada Core CPI MoM (SA) (Nov)A:--
F: --
P: --
Canada CPI MoM (SA) (Nov)A:--
F: --
P: --
Federal Reserve Board Governor Milan delivered a speech U.S. NAHB Housing Market Index (Dec)--
F: --
P: --
 Australia Composite PMI Prelim (Dec)
--
F: --
P: --
Australia Services PMI Prelim (Dec)--
F: --
P: --
Australia Manufacturing PMI Prelim (Dec)--
F: --
P: --
Japan Manufacturing PMI Prelim (SA) (Dec)--
F: --
P: --
U.K. 3-Month ILO Employment Change (Oct)--
F: --
P: --
U.K. Unemployment Claimant Count (Nov)--
F: --
P: --
U.K. Unemployment Rate (Nov)--
F: --
P: --
U.K. 3-Month ILO Unemployment Rate (Oct)--
F: --
P: --
U.K. Average Weekly Earnings (3-Month Average, Including Bonuses) YoY (Oct)--
F: --
P: --
U.K. Average Weekly Earnings (3-Month Average, Excluding Bonuses) YoY (Oct)--
F: --
P: --
 France Services PMI Prelim (Dec)
--
F: --
P: --
France Composite PMI Prelim (SA) (Dec)--
F: --
P: --
France Manufacturing PMI Prelim (Dec)--
F: --
P: --
 Germany Services PMI Prelim (SA) (Dec)
--
F: --
P: --
Germany Manufacturing PMI Prelim (SA) (Dec)--
F: --
P: --
Germany Composite PMI Prelim (SA) (Dec)--
F: --
P: --
Euro Zone Composite PMI Prelim (SA) (Dec)--
F: --
P: --
Euro Zone Services PMI Prelim (SA) (Dec)--
F: --
P: --
Euro Zone Manufacturing PMI Prelim (SA) (Dec)--
F: --
P: --
U.K. Services PMI Prelim (Dec)--
F: --
P: --
U.K. Manufacturing PMI Prelim (Dec)--
F: --
P: --
U.K. Composite PMI Prelim (Dec)--
F: --
P: --
Euro Zone ZEW Economic Sentiment Index (Dec)--
F: --
P: --
Germany ZEW Current Conditions Index (Dec)--
F: --
P: --
Germany ZEW Economic Sentiment Index (Dec)--
F: --
P: --
Euro Zone Trade Balance (Not SA) (Oct)--
F: --
P: --
Euro Zone ZEW Current Conditions Index (Dec)--
F: --
P: --
Euro Zone Trade Balance (SA) (Oct)--
F: --
P: --
U.S. Retail Sales MoM (Excl. Automobile) (SA) (Oct)--
F: --
P: --

No matching data
Latest Views
Latest Views
Trending Topics
Top Columnists
Latest Update
White Label
Data API
Web Plug-ins
Affiliate Program
View All
No data
Copper prices ended lower across major exchanges on Tuesday, as trade war worries and a firmer dollar weighed on broader sentiment, though robust Chinese demand capped losses.
Copper prices ended lower across major exchanges on Tuesday, as trade war worries and a firmer dollar weighed on broader sentiment, though robust Chinese demand capped losses.
Three-month copper on the London Metal Exchange (LME) was down 0.02% at US$9,882 (RM41,787) per metric tonne, as of 0714 GMT, while the most-traded copper contract on the Shanghai Futures Exchange lost 0.06% to 79,660 yuan (US$11,136.74) a tonne.
Despite concerns that the trade war would weigh on copper consumption, as well as expectations of falling prices after the US refrained from imposing import tariffs on refined metal, copper demand has proven resilient, supported by strong activity in China, said analysts from ANZ on Tuesday.
Analysts from ING noted that the upcoming US jobs report this Friday will be the focus for the market, with expectations of a weakening labour market reinforcing the case for potential rate cuts.
Broadly, a private purchasing managers' index (PMI) survey showed that China's factory activity in August expanded at the quickest pace in five months on rising new orders.
Still, the dollar index, which measures the US currency against six major peers, was last up 0.2% at 97.873.
A firmer dollar makes greenback-denominated assets less affordable to holders of other currencies.
Among other London metals, aluminium climbed 0.23% to US$2,617 a tonne, zinc rose 0.41% to US$2,844, while nickel dipped 0.9% to US$15,300, lead fell 0.67% to US$1,990, and tin eased 0.22% to US$34,875.
SHFE aluminium rose 0.24% to 20,720 yuan, lead edged 0.06% higher to 16,850 yuan, tin strengthened 0.08% to 273,980 yuan, and zinc climbed 0.59% to 22,325 yuan, while nickel lost 0.2% to 122,530 yuan.
Bitcoin wavers below $111,000, caught between macroeconomic uncertainty and unfavorable technical signals. While investors scrutinize upcoming indicators likely to guide US monetary policy, the pressure intensifies. Institutional capital outflows, tensions in derivatives products, and weakened sentiment indicators increase distrust. The market freezes in anticipation, exposed to latent volatility.
In brief
Since its sharp drop below $111,000 last Friday, Bitcoin has been oscillating within a narrow range of 2.3 %, signaling a clear slowdown in bullish momentum.
While this inertia coincides with the closure of regulated markets for Labor Day in the United States, it does not mask deeper technical fragility signs.
Indeed, $390 million worth of leveraged long positions could be liquidated if the BTC price falls below $107,000, a level now under close watch. The CoinGlass platform confirms that these positions are particularly vulnerable to a new correction.
Recent technical signals illustrate this increasing pressure on critical support :
Thus, the absence of bullish momentum, combined with manifest caution in derivatives markets, fuels increased mistrust. If the $108,000 zone breaks, the current market structure could reveal a risk of rapid destabilization, especially as institutional capital seems already to be initiating preventive withdrawal.
In this climate of nervousness, movements by certain whales further blur the outlook. Indeed, a long-term investor, having held Bitcoin positions for more than five years, has started a major strategic repositioning.
On August 21, this player sold $4 billion in BTC via the decentralized Hyperliquid platform, turning toward Ether (ETH).
Nicolai Sondergaard, analyst at Nansen, specifies that this decision reflects a form of “rotation” of assets, in a context where altcoins, especially ETH, benefit from growing accumulation by corporate actors. This move reinforces the hypothesis of sectoral reallocation within the crypto market itself.
At the same time, exogenous elements amplify distrust around Bitcoin. The yield on 20-year UK government bonds has reached an unprecedented peak since 1998, a sign of lost confidence in fiat currencies and anticipation of inflationary tensions.
While these data mainly concern traditional markets, their knock-on effect cannot be ignored in an increasingly interconnected crypto universe linked to macroeconomic dynamics.
This conjunction of elements creates an unprecedented situation: whales, traditionally guarantors of BTC stability, are shifting toward perceived more promising assets, while technical indicators signal increasing downward pressure. In the short term, markets will be focused on the US employment report due this Friday. Weakening employment could serve as a catalyst for risky assets, reinforcing anticipation of an imminent rate cut by the Fed. However, in the medium term, the gradual shift of capital toward Ether may indicate a structural reshaping of balances within the crypto ecosystem.
Euro zone inflation edged higher to 2.1% in August, according to the latest flash data from statistics agency Eurostat on Tuesday.
Economists polled by Reuters had expected the rate to remain unchanged from July, at 2%.
Core inflation, which strips out more volatile food, energy, alcohol and tobacco prices, was unchanged from 2.3% in July.
The closely watched services print meanwhile was slightly lower in August, at 3.1% compared to 3.2% in July.
At 2.1%, the euro zone's latest inflation rate is just slightly higher than the European Central Bank's target of 2%.
The central bank held its key interest rate at 2% in July and is expected to maintain that stance when it next meets in September, according to a majority of economists polled by Reuters.
The EU's trade deal with the U.S., signed in late July, has removed uncertainty over tariffs although there are some concerns that the blanket 15% duty of EU exports to the States could still weigh on economic activity.
The euro zone eked out 0.1% growth in the second quarter, compared to the previous quarter, Eurostat data showed in late July.
The AUDUSD pair declined to 0.6540. Australian statistics remain highly mixed. Find more details in our analysis for 2 September 2025.
On Tuesday, the AUDUSD rate dropped to 0.6540, breaking its five-session winning streak. Investors paused amid conflicting economic signals.
Support for the Aussie came from trade and industry data. The current account deficit in Q2 narrowed to its lowest level in a year. The manufacturing PMI reached nearly a three-year high in August, remaining above the 50-point threshold for the eighth consecutive month.
However, alongside these positives, weak spots stood out. Business inventories posted their smallest increase in the past year. Overall building permits dropped sharply, erasing June’s growth. Meanwhile, private house permits showed only a very modest recovery.
Investors’ focus now shifts to the PMI release, GDP data, and tomorrow’s speech by RBA Governor Michele Bullock. This could provide further guidance on the monetary policy trajectory.
The AUDUSD forecast is moderate.
The AUDUSD H4 chart shows a strong rebound after the decline in the second half of August. Quotes reached the 0.6550-0.6560 area, from where a minor correction is observed. Support forms at 0.6500-0.6520, while resistance is located around 0.6565-0.6570, where local highs are clustered.
Bollinger Bands are expanding upwards, confirming the sustained bullish momentum, although current movement is near the channel’s upper boundary. The Stochastic is in overbought territory, signaling the likelihood of a short-term correction. MACD remains in positive territory, supporting medium-term growth.
In the short term, consolidation within the 0.6500-0.6570 range is likely. To continue the uptrend, the pair needs to secure a breakout above 0.6570, with targets at 0.6600-0.6620. A breakout below 0.6500 could open the way for a correction towards 0.6460-0.6440.
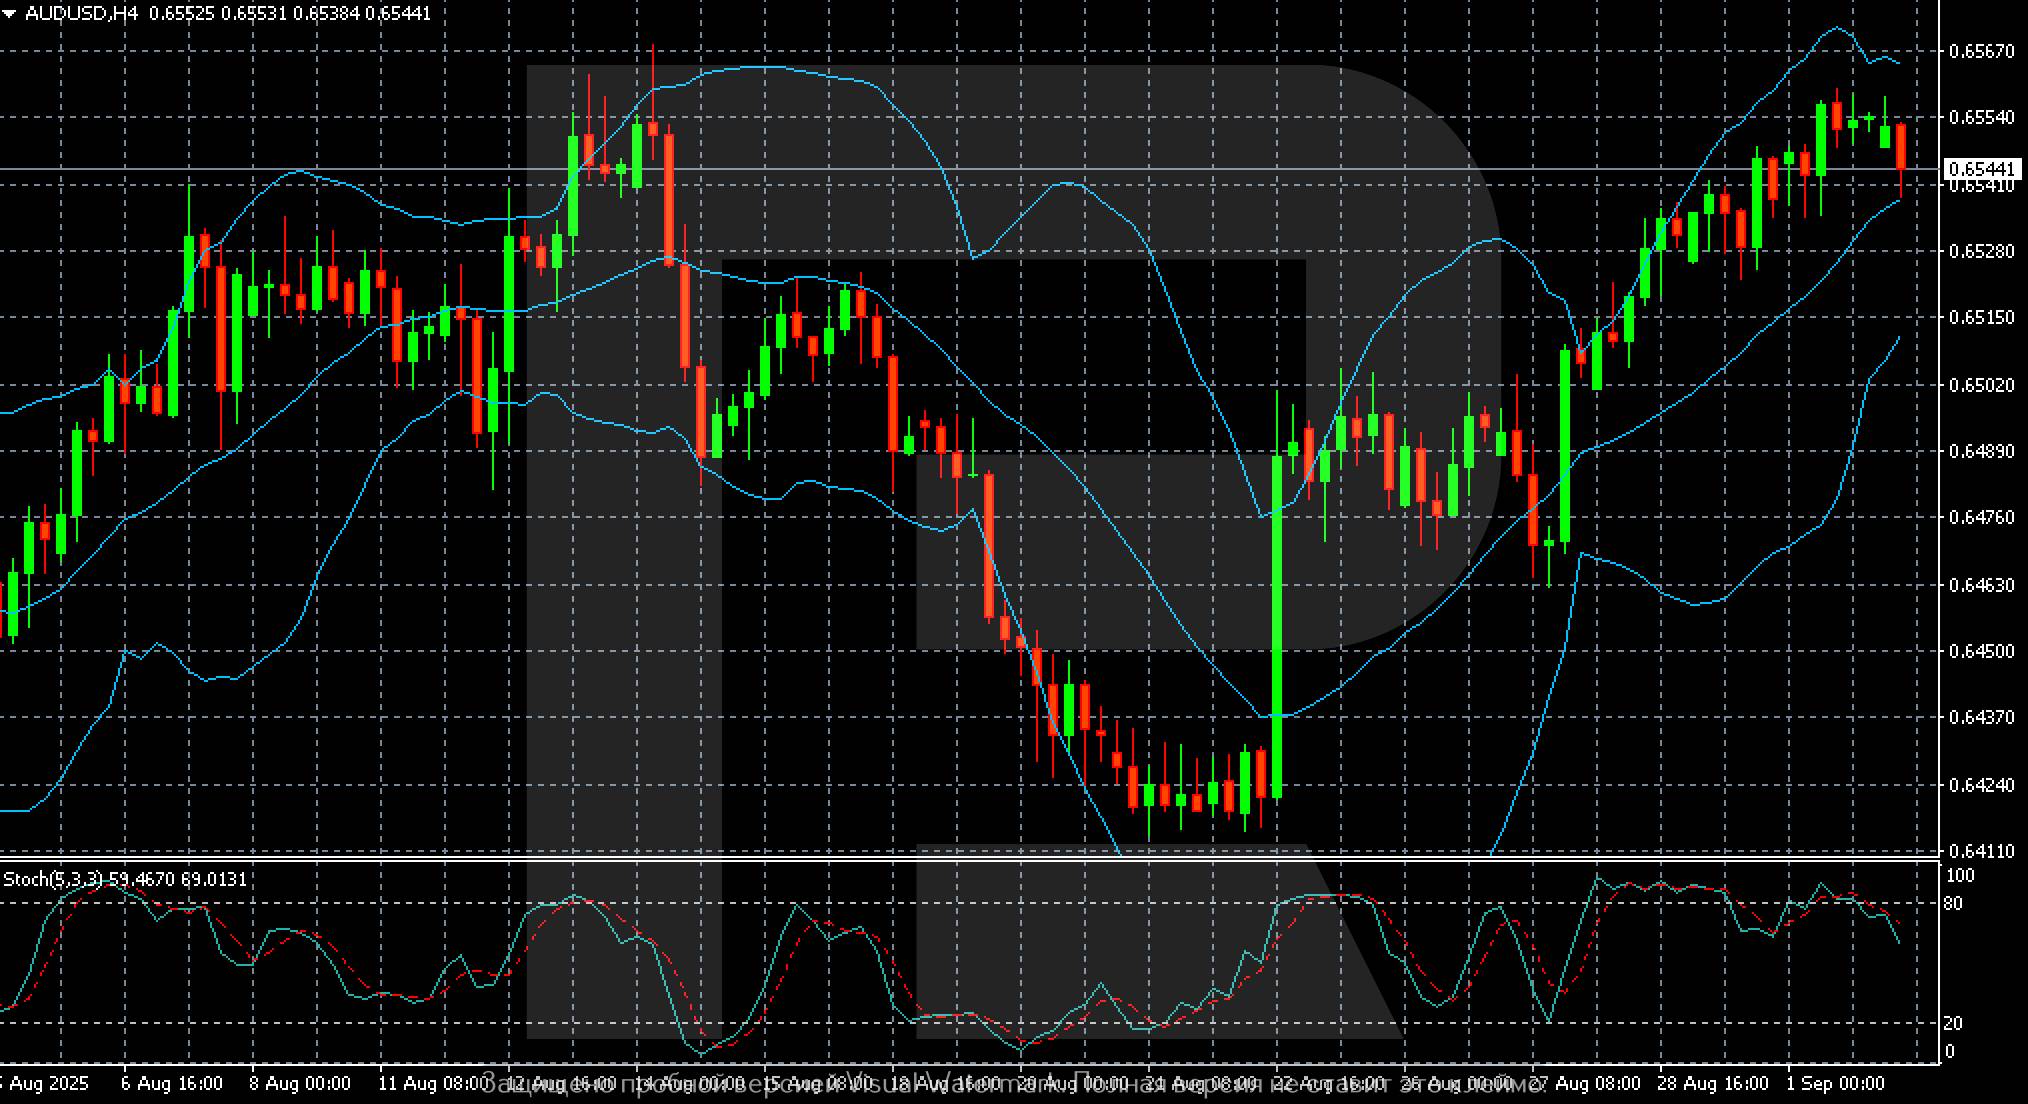
The AUDUSD pair entered a mild correction after five days of growth. The AUDUSD forecast for today, 2 September 2025, suggests short-term consolidation and a return to 0.6570.
728 RM B 7/F GEE LOK IND BLDG NO 34 HUNG TO RD KWUN TONG KLN HONG KONG


White Label
Data API
Web Plug-ins
Poster Maker
Affiliate Program
The risk of loss in trading financial instruments such as stocks, FX, commodities, futures, bonds, ETFs and crypto can be substantial. You may sustain a total loss of the funds that you deposit with your broker. Therefore, you should carefully consider whether such trading is suitable for you in light of your circumstances and financial resources.
No decision to invest should be made without thoroughly conducting due diligence by yourself or consulting with your financial advisors. Our web content might not suit you since we don't know your financial conditions and investment needs. Our financial information might have latency or contain inaccuracy, so you should be fully responsible for any of your trading and investment decisions. The company will not be responsible for your capital loss.
Without getting permission from the website, you are not allowed to copy the website's graphics, texts, or trademarks. Intellectual property rights in the content or data incorporated into this website belong to its providers and exchange merchants.
Not Logged In
Log in to access more features

FastBull Membership
Not yet
Purchase


Log In
Sign Up


