• Trade
  • Markets
  • Copy
  • Contests
  • News
  • 24/7
  • Calendar
  • Q&A
  • Chats
Trending
Screeners
SYMBOL
LAST
BID
ASK
HIGH
LOW
NET CHG.
%CHG.
SPREAD
SPX
S&P 500 Index
6836.26
6836.26
6836.26
6861.30
6834.81
+8.85
+ 0.13%
--
DJI
Dow Jones Industrial Average
48489.58
48489.58
48489.58
48679.14
48476.78
+31.54
+ 0.07%
--
IXIC
NASDAQ Composite Index
23191.65
23191.65
23191.65
23345.56
23186.20
-3.51
-0.02%
--
USDX
US Dollar Index
97.800
97.880
97.800
98.070
97.790
-0.150
-0.15%
--
EURUSD
Euro / US Dollar
1.17594
1.17601
1.17594
1.17597
1.17262
+0.00200
+ 0.17%
--
GBPUSD
Pound Sterling / US Dollar
1.33953
1.33960
1.33953
1.34014
1.33546
+0.00246
+ 0.18%
--
XAUUSD
Gold / US Dollar
4319.07
4319.50
4319.07
4350.16
4294.68
+19.68
+ 0.46%
--
WTI
Light Sweet Crude Oil
56.711
56.741
56.711
57.601
56.666
-0.522
-0.91%
--

Community Accounts

Signal Accounts
--
Profit Accounts
--
Loss Accounts
--
View More

Become a signal provider

Sell trading signals to earn additional income

View More

Guide to Copy Trading

Get started with ease and confidence

View More

Signal Accounts for Members

All Signal Accounts

Best Return
  • Best Return
  • Best P/L
  • Best MDD
Past 1W
  • Past 1W
  • Past 1M
  • Past 1Y

All Contests

  • All
  • Trump Updates
  • Recommend
  • Stocks
  • Cryptocurrencies
  • Central Banks
  • Featured News
Top News Only
Share

S&P 500 Financial Sector Trading At All-Time Highs, Last Up 0.4%

Share

Poland Had Equivalent Of EUR 4.87 Billion On Its Forex Accounts At End Of November

Share

Ukraine's Military Says It Hit Russian Gas Processing Plant In Astrakhan

Share

Ukraine's Top Negotiator: Talks With USA Have Been Constructive And Productive

Share

The Nasdaq Golden Dragon China Index Fell 0.9% In Early Trading

Share

The S&P 500 Opened 32.78 Points Higher, Or 0.48%, At 6860.19; The Dow Jones Industrial Average Opened 136.31 Points Higher, Or 0.28%, At 48594.36; And The Nasdaq Composite Opened 134.87 Points Higher, Or 0.58%, At 23330.04

Share

Miran: Goods Inflation Could Be Settling In At A Higher Level Than Was Normal Before The Pandemic, But That Will Be More Than Offset By Housing Disinflation

Share

Miran, Who Dissented In Favor Of A Larger Cut At Last Fed Meeting, Repeats Keeping Policy Too Tight Will Lead To Job Losses

Share

Miran: Does Not Think Higher Goods Inflation Is Mostly From Tariffs, But Acknowledges Does Not Have A Full Explanation For It

Share

Toronto Stock Index .GSPTSE Rises 67.16 Points, Or 0.21 Percent, To 31594.55 At Open

Share

Miran: Excluding Housing And Non-Market Based Items, Core Pce Inflation May Be Below 2.3%, “Within Noise” Of The Fed's 2% Target

Share

Polish State Assets Minister Balczun Says Jsw Needs Over USD 830 Million Financing To Keep Liquidity For A Year

Share

Miran: Prices Are “Once Again Stable” And Monetary Policy Should Reflect That

Share

Fed's Miran: Current Excess Inflation Is Not Reflective Of Underlying Supply And Demand In The Economy

Share

Portugal Treasury Puts 2026 Net Financing Needs At 13 Billion Euros, Up From 10.8 Billion In 2025

Share

Portugal Treasury Expects 2026 Net Financing Needs At 29.4 Billion Euros, Up From 25.8 Billion In 2025

Share

Bank Of America Says With Indonesia's Smelter Now Ramping Up, It Expects Aluminium Supply Growth To Accelerate To 2.6% Year On Year In 2026

Share

Bank Of America Expects A Deficit In Aluminium Next Year And Sees Prices Pushing Above $3000/T

Share

Fed Data - USA Effective Federal Funds Rate At 3.64 Percent On 12 December On $102 Billion In Trades Versus 3.64 Percent On $99 Billion On 11 December

Share

Brazil's Petrobras Says No Impact Seen On Oil, Petroleum Products Output As Workers Start Planned Strike

TIME
ACT
FCST
PREV
Japan Tankan Large Non-Manufacturing Outlook Index (Q4)

A:--

F: --

P: --

Japan Tankan Large Manufacturing Outlook Index (Q4)

A:--

F: --

P: --

Japan Tankan Small Manufacturing Diffusion Index (Q4)

A:--

F: --

P: --

Japan Tankan Large Manufacturing Diffusion Index (Q4)

A:--

F: --

P: --

Japan Tankan Large-Enterprise Capital Expenditure YoY (Q4)

A:--

F: --

P: --

U.K. Rightmove House Price Index YoY (Dec)

A:--

F: --

P: --

China, Mainland Industrial Output YoY (YTD) (Nov)

A:--

F: --

P: --

China, Mainland Urban Area Unemployment Rate (Nov)

A:--

F: --

P: --

Saudi Arabia CPI YoY (Nov)

A:--

F: --

P: --

Euro Zone Industrial Output YoY (Oct)

A:--

F: --

P: --

Euro Zone Industrial Output MoM (Oct)

A:--

F: --

P: --

Canada Existing Home Sales MoM (Nov)

A:--

F: --

P: --

Canada National Economic Confidence Index

A:--

F: --

P: --

Canada New Housing Starts (Nov)

A:--

F: --

P: --
U.S. NY Fed Manufacturing Employment Index (Dec)

A:--

F: --

P: --

U.S. NY Fed Manufacturing Index (Dec)

A:--

F: --

P: --

Canada Core CPI YoY (Nov)

A:--

F: --

P: --

Canada Manufacturing Unfilled Orders MoM (Oct)

A:--

F: --

P: --

U.S. NY Fed Manufacturing Prices Received Index (Dec)

A:--

F: --

P: --

U.S. NY Fed Manufacturing New Orders Index (Dec)

A:--

F: --

P: --

Canada Manufacturing New Orders MoM (Oct)

A:--

F: --

P: --

Canada Core CPI MoM (Nov)

A:--

F: --

P: --

Canada Trimmed CPI YoY (SA) (Nov)

A:--

F: --

P: --

Canada Manufacturing Inventory MoM (Oct)

A:--

F: --

P: --

Canada CPI YoY (Nov)

A:--

F: --

P: --

Canada CPI MoM (Nov)

A:--

F: --

P: --

Canada CPI YoY (SA) (Nov)

A:--

F: --

P: --

Canada Core CPI MoM (SA) (Nov)

A:--

F: --

P: --

Canada CPI MoM (SA) (Nov)

A:--

F: --

P: --

Federal Reserve Board Governor Milan delivered a speech
U.S. NAHB Housing Market Index (Dec)

--

F: --

P: --

Australia Composite PMI Prelim (Dec)

--

F: --

P: --

Australia Services PMI Prelim (Dec)

--

F: --

P: --

Australia Manufacturing PMI Prelim (Dec)

--

F: --

P: --

Japan Manufacturing PMI Prelim (SA) (Dec)

--

F: --

P: --

U.K. 3-Month ILO Employment Change (Oct)

--

F: --

P: --

U.K. Unemployment Claimant Count (Nov)

--

F: --

P: --

U.K. Unemployment Rate (Nov)

--

F: --

P: --

U.K. 3-Month ILO Unemployment Rate (Oct)

--

F: --

P: --

U.K. Average Weekly Earnings (3-Month Average, Including Bonuses) YoY (Oct)

--

F: --

P: --

U.K. Average Weekly Earnings (3-Month Average, Excluding Bonuses) YoY (Oct)

--

F: --

P: --

France Services PMI Prelim (Dec)

--

F: --

P: --

France Composite PMI Prelim (SA) (Dec)

--

F: --

P: --

France Manufacturing PMI Prelim (Dec)

--

F: --

P: --

Germany Services PMI Prelim (SA) (Dec)

--

F: --

P: --

Germany Manufacturing PMI Prelim (SA) (Dec)

--

F: --

P: --

Germany Composite PMI Prelim (SA) (Dec)

--

F: --

P: --

Euro Zone Composite PMI Prelim (SA) (Dec)

--

F: --

P: --

Euro Zone Services PMI Prelim (SA) (Dec)

--

F: --

P: --

Euro Zone Manufacturing PMI Prelim (SA) (Dec)

--

F: --

P: --

U.K. Services PMI Prelim (Dec)

--

F: --

P: --

U.K. Manufacturing PMI Prelim (Dec)

--

F: --

P: --

U.K. Composite PMI Prelim (Dec)

--

F: --

P: --

Euro Zone ZEW Economic Sentiment Index (Dec)

--

F: --

P: --

Germany ZEW Current Conditions Index (Dec)

--

F: --

P: --

Germany ZEW Economic Sentiment Index (Dec)

--

F: --

P: --

Euro Zone Trade Balance (Not SA) (Oct)

--

F: --

P: --

Euro Zone ZEW Current Conditions Index (Dec)

--

F: --

P: --

Euro Zone Trade Balance (SA) (Oct)

--

F: --

P: --

U.S. Retail Sales MoM (Excl. Automobile) (SA) (Oct)

--

F: --

P: --

Q&A with Experts
    • All
    • Chatrooms
    • Groups
    • Friends
    Connecting
    .
    .
    .
    Type here...
    Add Symbol or Code

      No matching data

      All
      Trump Updates
      Recommend
      Stocks
      Cryptocurrencies
      Central Banks
      Featured News
      • All
      • Russia-Ukraine Conflict
      • Middle East Flashpoint
      • All
      • Russia-Ukraine Conflict
      • Middle East Flashpoint
      Search
      Products

      Charts Free Forever

      Chats Q&A with Experts
      Screeners Economic Calendar Data Tools
      Membership Features
      Data Warehouse Market Trends Institutional Data Policy Rates Macro

      Market Trends

      Market Sentiment Order Book Forex Correlations

      Top Indicators

      Charts Free Forever
      Markets

      News

      News Analysis 24/7 Columns Education
      From Institutions From Analysts
      Topics Columnists

      Latest Views

      Latest Views

      Trending Topics

      Top Columnists

      Latest Update

      Signals

      Copy Rankings Latest Signals Become a signal provider AI Rating
      Contests
      Brokers

      Overview Brokers Assessment Rankings Regulators News Claims
      Broker listing Forex Brokers Comparison Tool Live Spread Comparison Scam
      Q&A Complaint Scam Alert Videos Tips to Detect Scam
      More

      Business
      Events
      Careers About Us Advertising Help Center

      White Label

      Data API

      Web Plug-ins

      Affiliate Program

      Awards Institution Evaluation IB Seminar Salon Event Exhibition
      Vietnam Thailand Singapore Dubai
      Fans Party Investment Sharing Session
      FastBull Summit BrokersView Expo
      Recent Searches
        Top Searches
          Markets
          News
          Analysis
          User
          24/7
          Economic Calendar
          Education
          Data
          • Names
          • Latest
          • Prev

          View All

          No data

          Scan to Download

          Faster Charts, Chat Faster!

          Download App
          English
          • English
          • Español
          • العربية
          • Bahasa Indonesia
          • Bahasa Melayu
          • Tiếng Việt
          • ภาษาไทย
          • Français
          • Italiano
          • Türkçe
          • Русский язык
          • 简中
          • 繁中
          Open Account
          Search
          Products
          Charts Free Forever
          Markets
          News
          Signals

          Copy Rankings Latest Signals Become a signal provider AI Rating
          Contests
          Brokers

          Overview Brokers Assessment Rankings Regulators News Claims
          Broker listing Forex Brokers Comparison Tool Live Spread Comparison Scam
          Q&A Complaint Scam Alert Videos Tips to Detect Scam
          More

          Business
          Events
          Careers About Us Advertising Help Center

          White Label

          Data API

          Web Plug-ins

          Affiliate Program

          Awards Institution Evaluation IB Seminar Salon Event Exhibition
          Vietnam Thailand Singapore Dubai
          Fans Party Investment Sharing Session
          FastBull Summit BrokersView Expo

          China’s Rare Earth Exports Fall Sharply in July Amid Global Scrutiny and Policy Shifts

          Gerik

          Economic

          Commodity

          Summary:

          China's rare earth exports dropped by 23% in July after hitting a record high in June, reflecting the sector’s volatility and raising questions about Beijing’s commitment to easing export controls under recent international agreements...

          Exports Decline After June’s Peak Amid Volatile Trade Trends

          China, the world’s dominant producer of rare earth elements, exported 5,994.3 metric tons in July 2025, marking a steep 23% decline from June’s record high, according to preliminary customs data released Thursday. The June figure had been the highest monthly export level since at least 2014, suggesting July’s drop could be part of a broader pattern of erratic month-to-month fluctuations rather than a definitive shift in trade policy.
          The latest decline comes as global attention intensifies on China's role in the critical materials supply chain, especially after it agreed to a series of deals with the United States and the European Union to increase rare earth shipments and relax its export licensing regime initially tightened in April in response to U.S. tariff escalations.

          Data Limitations and Lack of Transparency Complicate Interpretation

          Analysts caution that the July figures are too preliminary and ambiguous to draw definitive conclusions about China's policy intentions. The customs data fails to differentiate among various types of rare earths and related products, some of which remain unrestricted under China's evolving regulatory framework. Moreover, the monthly data is known to be highly volatile, with double-digit swings frequently observed in either direction.
          A more detailed dataset, which includes specific figures for exports of rare earth magnets a high-value segment essential to industries such as electric vehicles, electronics, and defense will be released on August 20. Preliminary information indicates that magnet exports to both the U.S. and Germany surged in June, aligning with their ongoing efforts to secure strategic supply chains amid geopolitical tensions.

          China Tightens Control Quietly Despite Diplomatic Agreements

          While Beijing has engaged diplomatically with Western powers to ease concerns over rare earth availability, domestic policy developments suggest a contrasting internal strategy. In July, Chinese authorities issued the first set of 2025 rare earth mining and smelting quotas without the usual accompanying public announcement, signaling a more opaque approach to industry oversight.
          This quiet imposition of output controls aligns with China's broader strategy of maintaining a dominant position in the global rare earth supply chain while minimizing external leverage. The lack of transparency may also be aimed at limiting speculative activity or external pressure during sensitive negotiations.

          Supply Chain Security and Strategic Shifts

          Western governments, including the U.S., EU, and Australia, have increasingly sought to diversify their rare earth supply sources. Financial incentives, such as subsidies and investment guarantees, are being introduced or proposed to support non-Chinese producers in countries like Canada, Australia, and Vietnam.
          Nevertheless, China continues to control more than 60% of global rare earth production and an even higher share of downstream processing capacity. This makes its export patterns and licensing policies critical barometers for industries that rely on these materials for green technologies, semiconductors, and advanced manufacturing.

          Strategic Uncertainty Remains as Policy Diverges from Trade Volumes

          Despite the sharp decline in July, China’s year-to-date rare earth exports rose 13% compared to the same period in 2024, indicating that broader output and demand trends remain strong. However, the juxtaposition of increased diplomatic engagement with Western nations and silent tightening of production controls introduces ambiguity around Beijing’s long-term intentions.
          As the full data for July including rare earth magnets is released later this month, market watchers and policymakers alike will be looking for clearer signals. Until then, China's rare earth strategy remains a high-stakes balancing act between domestic control and international pressure.

          Source: Reuters

          To stay updated on all economic events of today, please check out our Economic calendar
          Risk Warnings and Disclaimers
          You understand and acknowledge that there is a high degree of risk involved in trading. Following any strategies or investment methods may lead to potential losses. The content on the site is provided by our contributors and analysts for information purposes only. You are solely responsible for determining whether any trading assets, securities, strategy, or any other product is suitable for investing based on your own investment objectives and financial situation.
          Add to Favorites
          Share

          Trump’s Tariffs Go Live, Testing U.S. Trade Strategy as Economic Costs Mount

          Gerik

          Economic

          Tariffs Begin as Trump Targets Trade Realignment

          At 12:01 a.m. EDT on August 7, the United States began collecting higher tariffs on goods from 67 countries, marking the most aggressive escalation in Trump’s protectionist trade policy to date. The new rates ranging from 10% to 50% are part of a multilayered strategy aimed at forcing investment concessions from foreign governments, reorienting supply chains, and reviving U.S. manufacturing competitiveness.
          Notably, goods from Brazil now face a 50% tariff, those from Switzerland 39%, Canada 35%, and India 25%. Additionally, a further 25% tariff on Indian goods will take effect in three weeks due to its continued imports of Russian oil. Imports from countries like the EU, Japan, and South Korea were negotiated down to 15%, while others like Vietnam, Indonesia, and Pakistan received reduced rates between 19% and 20%.
          Although shipments in transit before the deadline can enter under the previous 10% rate until October 5, most trading partners are now recalibrating export strategies in response to the changed tariff landscape.

          Domestic Price Increases and Business Losses Emerge

          While the Trump administration argues that the tariff revenue estimated to reach over $300 billion annually represents a victory for U.S. taxpayers, the actual costs are being borne by domestic importers and consumers. The Atlantic Institute estimates that the average U.S. tariff rate now stands near 20%, the highest in over a century, up from just 2.5% in early 2017.
          Commerce Department data already reflect price inflation in key consumer categories such as home furnishings, vehicles, and recreational goods, starting in June. As these costs filter through the economy, real wages may decline, and consumption could soften, particularly in lower-income households.
          Moreover, early earnings reports from multinational firms signal the toll. Caterpillar, Yum Brands, Molson Coors, and Marriott are among the companies reporting tariff-related profit hits. According to Reuters’ global tariff tracker, the collective drag on corporate earnings is projected to exceed $15 billion in 2025, indicating a broad correlation between trade barriers and weakened margins.

          Markets Respond Cautiously as Legal and Political Risks Persist

          Despite the policy shift, financial markets have remained relatively stable. Asian equities hovered near record highs, and the U.S. dollar dipped only slightly. Analysts interpret this calm as a temporary decoupling between policy noise and investor sentiment, with many waiting to assess longer-term impacts before repositioning.
          However, political uncertainty continues to surround the policy’s durability. Trump’s legal authority, based on a 1977 economic emergency statute, is under judicial review. If courts strike down the justification, the White House may need to identify new legal grounds to maintain the measures. Additionally, enforcement remains opaque, particularly regarding the 40% surcharge on goods deemed to be transshipped to evade tariffs.
          Paul Ryan and other former allies have questioned the rationale and stability of Trump’s trade moves, suggesting legal and legislative backlash could grow if inflation accelerates or consumer sentiment weakens.

          Geopolitical Friction and Global Retaliation Risks Build

          Beyond the U.S. domestic economy, the tariffs risk reigniting trade conflicts with key partners. India and Canada, facing some of the steepest increases, are expected to explore retaliatory options or seek renegotiated terms. Meanwhile, China on a separate tariff schedule is approaching its own deadline. Trump has threatened to escalate duties unless progress is made in ending the war in Ukraine, citing China’s continued purchase of Russian oil.
          In parallel, the U.S. has expanded national security-based tariffs targeting strategic sectors like semiconductors, pharmaceuticals, autos, and base metals. Trump stated that tariffs on microchips could rise to 100%, which, if enacted, could further strain technology supply chains and raise costs for domestic manufacturers.

          Tariffs Introduce Structural Shifts, But At a Price

          Trump’s sweeping tariff regime marks a pivotal moment in U.S. trade policy, intended to restore industrial primacy and reduce dependence on foreign supply chains. However, early evidence points to inflationary spillovers, diminished corporate earnings, and limited clarity about enforcement and legal sustainability.
          While the administration views tariff revenue and investment pledges as long-term gains, the near-term impact is more ambiguous. Higher import costs and mounting business uncertainty suggest a growing divergence between political strategy and economic stability. Whether this trade realignment results in lasting competitive advantages or enduring inefficiencies remains an open question.

          Source: Reuters

          To stay updated on all economic events of today, please check out our Economic calendar
          Risk Warnings and Disclaimers
          You understand and acknowledge that there is a high degree of risk involved in trading. Following any strategies or investment methods may lead to potential losses. The content on the site is provided by our contributors and analysts for information purposes only. You are solely responsible for determining whether any trading assets, securities, strategy, or any other product is suitable for investing based on your own investment objectives and financial situation.
          Add to Favorites
          Share

          Bitcoin Nears 50-Day Average Amid Market Hesitation

          Olivia Brooks

          Cryptocurrency

          Key Points:

          ●Bitcoin approaches 50-day moving average amid market correction.
          ●Expert analysis indicates accumulation fatigue.
          ●Traders shift focus to smaller projects.

          Bitcoin's approach to its 50-day moving average signals a market correction exacerbated by summer trading patterns and diminishing bullish sentiment, according to analysts' reports from August 7, 2025.

          This correction underscores the cryptocurrency market's vulnerability to seasonal factors, highlighting traders' cautious stance amidst macroeconomic uncertainties and shifting sentiment in options markets.

          Bitcoin Faces Summer Market Challenges and Shifts

          The recent market correction, particularly impacting Bitcoin, aligns with summer seasonal weakness and macroeconomic factors. Analysts noted Bitcoin's frequent testing of the 50-day moving average, signaling "accumulation fatigue," as described by FxPro's Chief Market Analyst, Alex Kuptsikevich. The market has paused to lock in profits, while traders shift focus to smaller projects.

          Market sentiment for Bitcoin’s long-term performance has shifted from a previously bullish outlook to neutrality. This change reflects the broader market's reassessment of future trends amid continued uncertainty. As Griffin Ardern of BloFin stated, "The bullish sentiment for Bitcoin's long-term options has dissipated, now firmly holding a neutral stance."

          Analysts such as James Check describe the sell-off as "a traditional benign event," with active discussions on platforms like BlockBeats reflecting a cautious attitude toward potential future market weakness.

          Current Market Sentiment and Historical Price Patterns

          Did you know? Bitcoin has frequently tested its 50-day moving average, indicating market sentiment shifts over time.

          Bitcoin (BTC) is priced at $114,333, with a market cap of $2.28 trillion, commanding a 60.84% dominance in the crypto landscape. Over the past 90 days, BTC has demonstrated an 11.23% increase in price, as reported by CoinMarketCap.

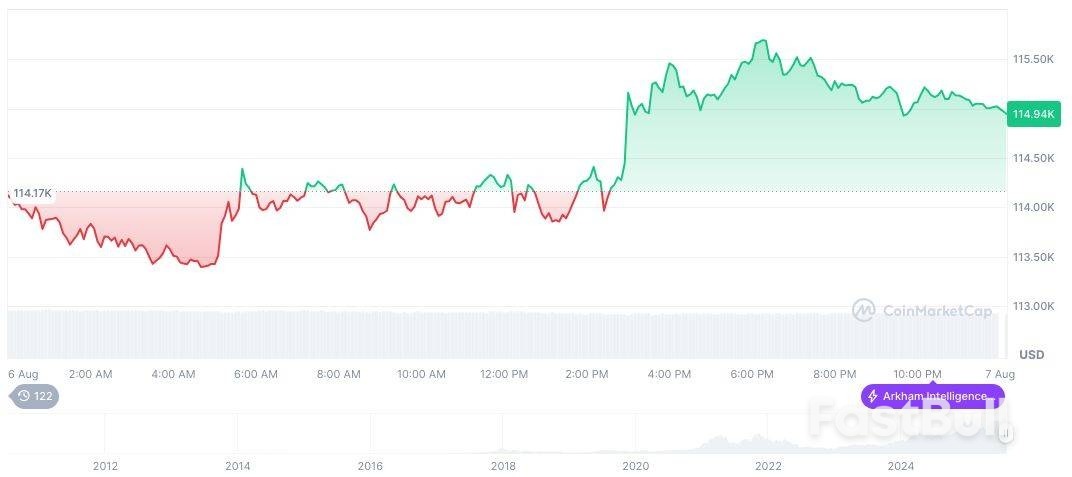
          Source: CoinMarketCap

          According to the Coincu research team, the observed neutral market sentiment and past trends suggest Bitcoin’s price could stabilize or decline further if broader economic uncertainties persist. Predictions rely on past performance and current on-chain indicators.

          Source: CryptoSlate

          Risk Warnings and Disclaimers
          You understand and acknowledge that there is a high degree of risk involved in trading. Following any strategies or investment methods may lead to potential losses. The content on the site is provided by our contributors and analysts for information purposes only. You are solely responsible for determining whether any trading assets, securities, strategy, or any other product is suitable for investing based on your own investment objectives and financial situation.
          Add to Favorites
          Share

          Japanese Investors Pull $5.1 Billion from Foreign Stocks Amid U.S. Growth Concerns and Tariff Fears

          Gerik

          Economic

          Foreign Equity Sell-Off Signals Growing Global Risk Aversion

          Japanese investors sold a net ¥752.1 billion ($5.10 billion) in foreign equities during the week ending August 2, marking a significant reversal after two consecutive weeks of net buying, according to data released by Japan’s Ministry of Finance on Thursday. This sell-off coincided with a 2.54% drop in the MSCI World Index, its steepest weekly decline in three months.
          The abrupt shift reflects mounting concerns over the health of the U.S. economy, following a weaker-than-expected July jobs report, and escalating trade tensions triggered by President Trump’s broad tariff implementation on more than 60 countries. Investors interpreted these developments as signs of a deteriorating global outlook, prompting a flight from risk assets.
          While the retreat is notable, foreign equity markets still show a strong net inflow from Japanese investors for 2025 amounting to ¥3.37 trillion year-to-date compared to net outflows of ¥915.8 billion in the same period last year. This contrast indicates that the recent sell-off may represent a recalibration rather than a wholesale reversal of foreign investment appetite.

          Bond Markets Also Show Defensive Positioning

          Japanese investors also scaled back holdings in foreign long-term bonds for a second consecutive week, with ¥526.3 billion in net sales. This suggests a cautious stance extending beyond equities, reflecting broader concerns about interest rate volatility, central bank policy shifts, and geopolitical uncertainty.
          Meanwhile, foreign investor activity in Japanese markets revealed a more subdued tone. Overseas investors added approximately ¥193 billion in Japanese equities, the lowest net weekly purchase in six weeks. On the fixed-income side, outflows from long-term Japanese bonds eased to ¥87.5 billion, the smallest in three weeks. However, foreign inflows into short-term Japanese bills rebounded to ¥1.2 trillion after a sharp outflow the previous week, signaling a preference for low-risk, highly liquid assets amid global turbulence.

          Global Uncertainty Drives Japanese Capital Toward Safety

          The recent pullback by Japanese investors from foreign stocks and bonds underscores heightened sensitivity to U.S. macroeconomic instability and rising protectionism. While cumulative investment flows for 2025 remain positive, last week’s activity illustrates a shift toward defensive positioning in response to external shocks.
          The divergence between short-term caution and long-term engagement reflects a growing awareness that ongoing volatility fueled by political decisions and weakening economic signals could pose enduring risks to portfolio performance. As such, Japanese investors appear to be hedging their exposure while reassessing where sustainable returns may be found in an increasingly fragmented global economy.

          Source: Reuters

          To stay updated on all economic events of today, please check out our Economic calendar
          Risk Warnings and Disclaimers
          You understand and acknowledge that there is a high degree of risk involved in trading. Following any strategies or investment methods may lead to potential losses. The content on the site is provided by our contributors and analysts for information purposes only. You are solely responsible for determining whether any trading assets, securities, strategy, or any other product is suitable for investing based on your own investment objectives and financial situation.
          Add to Favorites
          Share

          IC Markets Asia Fundamental Forecast | 7 August 2025

          IC Markets

          Commodity

          Economic

          Forex

          What happened in the U.S session?

          The overnight U.S. session saw technology and semiconductor equities, the U.S. dollar, and U.S. index futures as particularly sensitive to a mix of U.S. tariff developments, jobless claims, and headline-driven volatility, with some cross-currency moves tracking the BOE’s policy decisions and Canadian macro data releases as well.President Donald Trump announced plans to impose a 100% tariff on imported semiconductors and chips, except for companies manufacturing within the U.S. He also indicated additional tariffs would be announced soon, with India and pharmaceutical imports in focus. This contributed to increased uncertainty and movement in technology and semiconductor-related equities, as well as broader indices sensitive to trade policy

          What does it mean for the Asia sessions?

          Traders should monitor fresh macro data out of Australia and China early in the session, stay vigilant for new tariff headlines or trade policy updates from the U.S., and pay particular attention to risk sentiment shifts as global data and central bank communications filter through. Market volatility is expected to remain elevated amid ongoing uncertainty surrounding U.S. trade policies and global monetary policy direction.

          The Dollar Index (DXY)

          The U.S. Dollar is on the defensive today, pressured by expectations of Fed rate cuts, lingering concern about the economic fallout from new tariffs, and heightened political risk. Market volatility remains elevated, with traders focused on both economic data and headline risk from Washington. The dollar index (DXY), which measures the USD against a basket of major peers, fell about 0.61% in late New York trading, reflecting a broad-based decline. Recent sessions saw the dollar retreat from a short-term high reached earlier in the week, as optimism about new U.S. trade deals faded and investors reassessed risks from upcoming tariffs.Central Bank Notes:

          ● The Board of Governors of the Federal Reserve System voted unanimously to maintain the Federal Funds Rate in a target range of 4.25% to 4.50% at its meeting on July 29–30, 2025, keeping policy unchanged for the fifth consecutive meeting.
          ● The Committee reiterated its objective of achieving maximum employment and inflation at the rate of 2% over the longer run. While uncertainty around the economic outlook has diminished since earlier in the year, the Committee notes that challenges remain and continued vigilance is warranted.
          ● Policymakers remain highly attentive to risks on both sides of their dual mandate. The unemployment rate remains low, near 4.2%–4.5%, and labor market conditions are described as solid. However, inflation is still somewhat elevated, with the PCE price index at 2.6% and core inflation forecast at 3.1% for year-end 2025, up from earlier projections; tariff-related pressures are cited as a contributing factor.
          ● The Committee acknowledged that recent economic activity has expanded at a solid pace, with second-quarter annualized growth estimates near 2.4%. However, GDP growth for 2025 has been revised downward to 1.4% (from 1.7% projected in March), reflecting expectations of a slowdown in the coming quarters.
          ● In the revised Summary of Economic Projections, the unemployment rate is expected to average 4.5% in 2025, and headline PCE inflation is forecast at 3.0% for the year, with core PCE at 3.1%. Policymakers continue to anticipate that inflation will moderate gradually, with ongoing risks from tariffs and global conditions.
          ● The Committee reaffirmed its data-dependent and risk-aware approach to future policy decisions. Officials stated they are prepared to adjust the stance of monetary policy as appropriate if risks emerge that could impede progress toward the Fed’s goals.
          ● As previously outlined, the Committee continues the measured run-off of its securities holdings. The pace of balance sheet reduction, which slowed since April (monthly redemption cap on Treasury securities reduced from $25B to $5B, while holding agency MBS cap steady at $35B), was left unchanged this month to support orderly market functioning and financial conditions.
          ● The next meeting is scheduled for 16 to 17 September 2025.

          Next 24 Hours Bias

          Weak Bearish

          Gold (XAU)

          Gold remains in a holding pattern as traders weigh the likelihood of imminent Fed rate cuts against the strength of the US dollar and ongoing tariff/trade uncertainty. Asian and global investors should watch for Fed commentary, US macro data, and any unexpected geopolitical headlines for signs of a breakout from the current price range. Gold is holding firm near recent highs. Leading into August 7, gold traded in a $3,370–$3,379 per ounce range following a multi-session rally and brief consolidation.Next 24 Hours Bias

          Medium Bullish

          The Australian Dollar (AUD)

          The Australian Dollar is regaining ground amid improved global risk sentiment and hopes for trade stability. However, the currency’s direction will remain highly sensitive to central bank messaging (particularly the RBA), evolving U.S. interest rate expectations, and Australia’s external trade data. Immediate attention will focus on macro reports and RBA commentary slated for the rest of the session.

          Central Bank Notes:

          ● The RBA held its cash rate steady at 3.85% at the July meeting on 8 July 2025, following a 25bps reduction in May and in line with widespread market expectations after recent data showed inflation tracking within the target band.
          ● Inflation continues to ease from its peak, with higher interest rates helping to rebalance demand and supply across the Australian economy. Data for the June quarter signaled ongoing progress, though underlying pressures persist in certain sectors.
          ● Trimmed mean inflation for the June quarter likely remained near 2.9% and headline CPI around 2.4%, both within the RBA’s 2–3% target range. The Board noted further evidence of inflation convergence, but flagged that not all price categories are moving in tandem.
          ● Financial markets have shown increased volatility in the wake of global tariff and trade policy developments—especially as a result of recent U.S. and EU announcements. This has pushed asset prices higher but contributed to an uncertain outlook for domestic growth and employment.
          ● Private domestic demand showed a tentative recovery. Real household incomes improved and signs of easing household financial stress emerged, but some business sectors continued to face subdued demand, limiting their ability to pass on cost increases.
          ● Labour market conditions remained tight overall. Employment continued to expand, with low rates of underutilization. Business surveys suggest labour availability remains a constraint, though there are signs of a gradual easing compared to earlier in 2025.
          ● Underlying wage growth softened modestly, though unit labour cost growth remains elevated due to below-trend productivity gains. The Board remains attentive to developments in wage and productivity dynamics as cost pressures continue to evolve.
          ● Uncertainties persist for both domestic activity and inflation. Consumption growth has risen, but more slowly than anticipated three months ago, with global and domestic factors both contributing to the cautious outlook.
          ● There remains a risk that household spending picks up more slowly than forecast, which could result in ongoing subdued aggregate demand and a sharper deterioration in employment conditions.
          ● Given that inflation is expected to remain around the target band, the Board judged that it was appropriate to keep policy settings unchanged in July, maintaining a position that is still mildly restrictive.
          ● The Board continues to monitor all incoming data and assesses risks carefully, with a focus on global trends, domestic demand indicators, inflation outcomes, and the labour market outlook.
          ● The RBA remains committed to its mandate of price stability and full employment and stands ready to adjust policy as needed to achieve these objectives.
          ● The next meeting is on 11 to 12 August 2025.
          Next 24 Hours Bias

          Weak Bearish

          The Kiwi Dollar (NZD)

          The NZD is steady but fragile following weak labor data, rising inflation expectations, and heightened U.S. trade barriers. Market sentiment will pivot on future RBNZ signals and further developments in global trade or commodity prices. The Reserve Bank of New Zealand’s (RBNZ) quarterly survey showed business inflation expectations holding at 2.29% for Q3 2025, matching the previous quarter and remaining at the highest level in a year. This read is especially significant as it comes ahead of the RBNZ’s next policy meeting, informing interest rate trajectory decisions. The central bank uses these figures to assess whether current policy is anchoring inflation in the target band.

          Central Bank Notes:

          ● The Monetary Policy Committee (MPC) agreed to hold the Official Cash Rate (OCR) at 3.25% on 9 July, marking the first pause following six consecutive rate cuts.
          ● The MPC cited heightened uncertainty and near-term inflation risks as reasons to wait until August for further action.
          ● Although the annual consumer price index inflation increased to 2.5% in the first quarter of 2025, it remained within the MPC’s target range of 1 to 3%, noting that the outlook for medium-term inflation pressures has evolved broadly in line with the May MPS projections.
          ● While it is expected to be near the upper end of the band in the second and third quarters of this year, easing core inflation and spare capacity in the economy should help return it toward the 2% midpoint over time.
          ● The MPC noted that, despite global factors, domestic financial conditions are evolving broadly as expected, as mortgage and deposit interest rates have continued to decline, reflecting a lower OCR, strong bank liquidity, and soft credit growth.
          ● In aggregate, GDP growth over the December and March quarters was stronger than expected, reflecting a pickup in household consumption and business investment. However, higher-frequency indicators suggest weaker-than-expected growth in April and May.
          ● Large economic policy shifts overseas and concerns about sovereign risk could result in additional financial market volatility and increased bond yields, while prolonged economic uncertainty might induce further precautionary behaviour by households and firms, slowing the domestic economic recovery.
          ● Subject to medium-term inflation pressures continuing to ease in line with the Committee’s central projections, the Committee expects to lower the OCR further, broadly consistent with the projection outlined in May.
          ● The next meeting is on 20 August 2025.

          Next 24 Hours Bias

          Weak Bearish

          The Japanese Yen (JPY)

          The yen is likely to remain under pressure amid BOJ caution, soft economic momentum, and persistent trade risks. Japanese government bond auctions and domestic demand indicators are critical for the near-term yen direction. Any new headlines regarding US tariffs or BOJ policy may trigger further volatility for JPY and related assets.The Japanese yen (JPY) continued to weaken, trading around 147.3–147.7 per US dollar as of August 6, down approximately 0.17% from the previous session. Over the past month, the yen has been on a downtrend, losing close to 1% against the dollar amid lingering economic and trade uncertainties. Market forecasts suggest further potential yen weakness, with models pointing to USD/JPY levels above 149 later in the quarter.

          Central Bank Notes:

          ● The Policy Board of the Bank of Japan decided on 31 July, by a unanimous vote, to set the following guidelines for money market operations for the inter-meeting period:
          ● The Bank will encourage the uncollateralized overnight call rate to remain at around 0.5%.
          ● The BOJ will maintain its gradual reduction of monthly outright purchases of Japanese Government Bonds (JGBs). The scheduled amount of long-term government bond purchases will, in principle, continue to decrease by about ¥400 billion each quarter from January to March 2026, and by about ¥200 billion each quarter from April to June 2026 onward, targeting a purchase level near ¥2 trillion in January to March 2027.
          ● Japan’s economy is experiencing a moderate recovery overall, though some sectors remain sluggish. Overseas economies are generally growing moderately, but recent trade policies in major economies have introduced pockets of weakness. Exports and industrial production in Japan are essentially flat, with any uptick largely driven by front-loaded demand ahead of U.S. tariff increases.
          ● On the price front, the year-on-year rate of change in consumer prices (excluding fresh food) remains in the mid-3% range. This reflects continued wage pass-through, previous import cost surges, and further increases in food prices, particularly rice. Expectations for future inflation have begun to rise moderately.
          ● The effects of the earlier import price and food cost increases are expected to fade during the outlook period. There may be a temporary stagnation in core inflation as overall growth momentum softens.
          ● Looking forward, the economy is likely to see a slower growth pace in the near term as overseas economies feel the pinch of ongoing global trade policies, putting downward pressure on Japanese corporate profits. Accommodative financial conditions are expected to buffer these headwinds somewhat. In the medium term, as global growth recovers, Japan’s growth rate is also expected to improve.
          ● With renewed economic expansion, intensifying labor shortages, and a steady rise in medium- to long-term expected inflation rates, core inflation is projected to gradually pick up. By the latter half of the BOJ’s projection period, inflation is forecast to move in line with the 2% price stability target.
          ● There are multiple risks to the outlook, with especially elevated uncertainty regarding the future path of global trade policies and overseas price trends. The BOJ will continue to closely monitor their impact on financial and foreign exchange markets, as well as on Japan’s economy and inflation.
          ● The next meeting is scheduled for 17 to 18 September 2025.

          Next 24 Hours BiasStrong Bullish

          Oil

          Oil prices are near multi-week lows after OPEC+ output hikes and amid cautious global sentiment. U.S. demand offers support, but mixed signals from China and worries about oversupply weigh on prices. Key risks include escalating U.S. tariffs, potential sanctions on Russian oil, and the pace at which OPEC+ restores previously cut supply. These developments suggest heightened volatility and a complex interplay of supply increases, global economic and policy risks, and evolving demand, shaping oil market sentiment today.Next 24 Hours Bias

          Weak Bearish

          Source: IC Markets

          To stay updated on all economic events of today, please check out our Economic calendar
          Risk Warnings and Disclaimers
          You understand and acknowledge that there is a high degree of risk involved in trading. Following any strategies or investment methods may lead to potential losses. The content on the site is provided by our contributors and analysts for information purposes only. You are solely responsible for determining whether any trading assets, securities, strategy, or any other product is suitable for investing based on your own investment objectives and financial situation.
          Add to Favorites
          Share

          U.S. Tariffs Take Global Effect as Economic Strains Emerge from Within

          Gerik

          Economic

          Tariffs Implemented Amid Shifting Economic Landscape

          Starting just after midnight on August 7, 2025, new U.S. import tariffs came into force, covering goods from over 60 countries and the European Union. The imposed rates range from 10% to 20%, with the European Union, Japan, and South Korea facing 15%, and Taiwan, Vietnam, and Bangladesh at 20%. In India’s case, cumulative tariffs now reach 50%, following its continued import of Russian oil. In tandem, President Trump announced a future 100% tariff on computer chips, alongside looming taxes on pharmaceutical imports.
          While President Trump argues that the U.S. is "taking in hundreds of billions of dollars in tariffs" and that economic growth will be "unprecedented," no confirmed figures were provided. The administration believes the tariffs will redirect investment back into the U.S. and bolster job creation in manufacturing, framing the policy as a long-term rebalancing tool.

          Early Data Suggests Rising Domestic Pressures

          However, economic signals suggest mounting internal strain, contradicting White House optimism. Since the initial tariff announcements in April, U.S. hiring momentum has weakened, inflationary pressure has increased, and home values have begun to decline in key metro areas. According to John Silvia of Dynamic Economic Strategy, the economy’s underlying productivity has dropped, contributing to a decline in real wages and hiring.
          These developments show a likely causal link between protectionist trade policy and economic deceleration. Rather than an immediate collapse, economists anticipate a gradual drag effect described by Georgetown’s Brad Jensen as “fine sand in the gears” slowing the economy subtly but persistently.

          Trade Deficit and Manufacturing Goals Contradicted by Outcomes

          Contrary to Trump’s stated aim of reducing the trade imbalance, data for the first half of 2025 show the U.S. trade deficit reaching $582.7 billion up 38% from the same period in 2024. This surge resulted in part from a front-loading of imports by companies seeking to avoid the new levies. At the same time, factory jobs one of the central targets of Trump’s economic platform have not rebounded. Instead, job losses continue, alongside a 2.9% drop in construction spending over the past year.
          The inconsistency between policy intentions and observed outcomes reveals a disconnect between theoretical economic modeling and on-the-ground behavior by firms navigating cost pressures and supply chain disruptions.

          Policy Execution Muddied by Legal and Administrative Uncertainty

          The process leading to Thursday’s implementation reflected administrative disarray. Due to vague language in a July 31 directive delaying the tariffs from August 1, trade partners and even White House officials were unsure of the actual start date. Kevin Hassett, Director of the National Economic Council, declined to confirm the timeline, deferring questions to the U.S. Trade Representative’s Office.
          Further complications could arise from pending legal challenges. Trump’s invocation of a 1977 emergency economic powers statute is now under judicial review. Should courts rule that the president exceeded his authority, the administration may be forced to seek alternative legal pathways to justify ongoing tariff enforcement.

          Political Reactions Reflect Diverging Expectations

          Former Republican House Speaker Paul Ryan, once an ally of Trump, voiced skepticism about the tariffs’ legality and strategic foundation, describing the moves as driven by "whims" rather than policy coherence. Meanwhile, Trump continues to project confidence, bolstered by strong stock market performance and recent tax and spending legislation. The S&P 500 has gained over 25% since its April low, which the administration sees as validation for its economic course.
          However, critics warn that market gains may not reflect broader economic health. Rachel West of The Century Foundation cautioned that while Trump may appear unfazed by the uncertainty, American households are already feeling the consequences through higher prices and deteriorating economic clarity.

          Uncertainty Overshadows Economic Ambitions

          While the Trump administration envisions the newly enacted tariffs as a catalyst for domestic revitalization, early evidence suggests a more complex and adverse economic reality. The policy’s short-term impact has included a widening trade deficit, softening job growth, and rising living costs outcomes at odds with its stated goals.
          With legal, economic, and political uncertainties all converging, the long-term effects of this trade strategy remain unclear. The durability of the U.S. economy in the face of these layered disruptions will depend not only on policy outcomes but also on how effectively American institutions respond to the uncertainty they now confront.

          Source: Reuters

          To stay updated on all economic events of today, please check out our Economic calendar
          Risk Warnings and Disclaimers
          You understand and acknowledge that there is a high degree of risk involved in trading. Following any strategies or investment methods may lead to potential losses. The content on the site is provided by our contributors and analysts for information purposes only. You are solely responsible for determining whether any trading assets, securities, strategy, or any other product is suitable for investing based on your own investment objectives and financial situation.
          Add to Favorites
          Share

          Trump’s Broad Tariffs Take Effect Amid Signs of Economic Strain and Mounting Policy Uncertainty

          Gerik

          Economic

          Tariff Implementation Coincides with Emerging Economic Slowdown

          Beginning just after midnight Thursday, President Trump’s administration activated broad-based import taxes, with rates starting at 10% and reaching as high as 50% for some countries. The rollout applies to goods from the European Union, Japan, South Korea, Taiwan, Vietnam, Bangladesh, and others. While the administration believes these measures will attract foreign investment and revive domestic manufacturing, current economic indicators are telling a different story.
          According to data released in recent weeks, key segments of the U.S. economy began showing signs of weakening shortly after the initial tariff announcements in April. Hiring activity has stalled, real wages have slipped under inflationary pressures, and home values in major markets have begun to decline. These developments suggest a negative correlation between the escalation of tariff threats and overall productivity, as identified by John Silvia of Dynamic Economic Strategy.
          Silvia emphasized that the new tariff structure has begun to reduce economic efficiency, limiting firms' capacity to maintain wages and investment. This interpretation reflects the concern that the policy’s impact may not be immediately catastrophic but will instead manifest gradually through lower output and higher costs over time.

          Trump Administration Projects Long-Term Gains Despite Short-Term Disruption

          Despite the economic turbulence, the White House maintains confidence that the tariff regime will ultimately lead to stronger growth. President Trump insisted the U.S. would benefit from “unprecedented” gains and billions in tariff revenues, even though he admitted specific revenue projections remain uncertain due to ongoing revisions to the tariff schedule.
          Trump's position is that clear policy direction however disruptive can incentivize corporate planning, leading to more investment and reshoring of supply chains. The administration views the current period as one of adjustment, after which they expect the economy to rebalance toward domestic industrial production.
          However, this confidence lacks consensus support among economists and market participants. Paul Ryan, former Republican House speaker and past Trump ally, openly criticized the ad hoc nature of the tariffs, pointing to the lack of a coherent economic rationale. Legal uncertainty also clouds the initiative, as the use of emergency powers under a 1977 statute faces scrutiny from U.S. appellate courts.

          Signs of Structural Economic Drag Surface in Trade and Labor Data

          The broader economic data reinforces a more cautious outlook. For the first half of 2025, the U.S. trade deficit grew to $582.7 billion 38% higher than the same period in 2024 as firms rushed to front-load imports before tariffs took effect. This unintended surge undercuts the stated goal of reducing the trade imbalance and suggests that market behavior is adjusting in ways that may temporarily mask the policy’s true impact.
          Simultaneously, construction spending has declined by 2.9% over the past year, and factory employment a central target of Trump’s industrial strategy has contracted. These trends imply that rising import costs are not being offset by new domestic production or hiring, at least in the short term.

          Markets Resilient, But Underlying Risk Builds

          Paradoxically, financial markets have shown resilience throughout the trade drama. The S&P 500 has climbed more than 25% since its April lows, bolstered by tax cuts and government spending measures passed on July 4. This bullish performance has likely contributed to the administration’s sustained optimism. However, analysts caution that asset price increases may be decoupled from real economic activity, particularly if corporate earnings deteriorate under sustained cost pressures from tariffs.
          Rachel West, a former labor policy official in the Biden administration, argued that while markets can absorb uncertainty in the short term, ordinary Americans are already experiencing the real-world consequences through higher prices and diminished job security. She notes that the true burden of policy unpredictability tends to fall on workers and consumers rather than policymakers.

          High-Stakes Gamble With Uncertain Long-Term Payoff

          As Trump’s comprehensive tariff strategy moves from threat to reality, its economic effects are beginning to materialize in measurable ways. While the administration promotes a vision of manufacturing revival and trade rebalancing, the immediate outcomes include slower hiring, declining wage growth, and deepening legal and diplomatic tensions.
          The causal chain between protectionist policy and economic deceleration is not yet fully defined, but early indicators suggest that the U.S. economy is beginning to feel the weight of its own trade weapon. Whether this path leads to renewal or stagnation will depend not only on domestic adaptation, but also on how international partners respond to an increasingly unpredictable U.S. trade posture.

          Source: Reuters

          To stay updated on all economic events of today, please check out our Economic calendar
          Risk Warnings and Disclaimers
          You understand and acknowledge that there is a high degree of risk involved in trading. Following any strategies or investment methods may lead to potential losses. The content on the site is provided by our contributors and analysts for information purposes only. You are solely responsible for determining whether any trading assets, securities, strategy, or any other product is suitable for investing based on your own investment objectives and financial situation.
          Add to Favorites
          Share
          FastBull
          Copyright © 2025 FastBull Ltd

          728 RM B 7/F GEE LOK IND BLDG NO 34 HUNG TO RD KWUN TONG KLN HONG KONG

          TelegramInstagramTwitterfacebooklinkedin
          App Store Google Play Google Play
          Products
          Charts

          Chats

          Q&A with Experts
          Screeners
          Economic Calendar
          Data
          Tools
          Membership
          Features
          Function
          Markets
          Copy Trading
          Latest Signals
          Contests
          News
          Analysis
          24/7
          Columns
          Education
          Company
          Careers
          About Us
          Contact Us
          Advertising
          Help Center
          Feedback
          User Agreement
          Privacy Policy
          Business

          White Label

          Data API

          Web Plug-ins

          Poster Maker

          Affiliate Program

          Risk Disclosure

          The risk of loss in trading financial instruments such as stocks, FX, commodities, futures, bonds, ETFs and crypto can be substantial. You may sustain a total loss of the funds that you deposit with your broker. Therefore, you should carefully consider whether such trading is suitable for you in light of your circumstances and financial resources.

          No decision to invest should be made without thoroughly conducting due diligence by yourself or consulting with your financial advisors. Our web content might not suit you since we don't know your financial conditions and investment needs. Our financial information might have latency or contain inaccuracy, so you should be fully responsible for any of your trading and investment decisions. The company will not be responsible for your capital loss.

          Without getting permission from the website, you are not allowed to copy the website's graphics, texts, or trademarks. Intellectual property rights in the content or data incorporated into this website belong to its providers and exchange merchants.

          Not Logged In

          Log in to access more features

          FastBull Membership

          Not yet

          Purchase

          Become a signal provider
          Help Center
          Customer Service
          Dark Mode
          Price Up/Down Colors

          Log In

          Sign Up

          Position
          Layout
          Fullscreen
          Default to Chart
          The chart page opens by default when you visit fastbull.com