

Markets
News
Analysis
User
24/7
Economic Calendar
Education
Data
- Names
- Latest
- Prev


Signal Accounts for Members
All Signal Accounts
All Contests
 U.K. Trade Balance Non-EU (SA) (Oct)
A:--
F: --
P: --
U.K. Trade Balance (Oct)A:--
F: --
P: --
U.K. Services Index MoMA:--
F: --
P: --
U.K. Construction Output MoM (SA) (Oct)A:--
F: --
P: --
U.K. Industrial Output YoY (Oct)A:--
F: --
P: --
U.K. Trade Balance (SA) (Oct)A:--
F: --
P: --
U.K. Trade Balance EU (SA) (Oct)A:--
F: --
P: --
U.K. Manufacturing Output YoY (Oct)A:--
F: --
P: --
U.K. GDP MoM (Oct)A:--
F: --
P: --
U.K. GDP YoY (SA) (Oct)A:--
F: --
P: --
U.K. Industrial Output MoM (Oct)A:--
F: --
P: --
U.K. Construction Output YoY (Oct)A:--
F: --
P: --
 France HICP Final MoM (Nov)
A:--
F: --
P: --
 China, Mainland Outstanding Loans Growth YoY (Nov)
A:--
F: --
P: --
China, Mainland M2 Money Supply YoY (Nov)A:--
F: --
P: --
China, Mainland M0 Money Supply YoY (Nov)A:--
F: --
P: --
China, Mainland M1 Money Supply YoY (Nov)A:--
F: --
P: --
 India CPI YoY (Nov)
A:--
F: --
P: --
India Deposit Gowth YoYA:--
F: --
P: --
 Brazil Services Growth YoY (Oct)
A:--
F: --
P: --
 Mexico Industrial Output YoY (Oct)
A:--
F: --
P: --
 Russia Trade Balance (Oct)
A:--
F: --
P: --
 Philadelphia Fed President Henry Paulson delivers a speech
 Canada Building Permits MoM (SA) (Oct)
A:--
F: --
P: --
Canada Wholesale Sales YoY (Oct)A:--
F: --
P: --
Canada Wholesale Inventory MoM (Oct)A:--
F: --
P: --
Canada Wholesale Inventory YoY (Oct)A:--
F: --
P: --
Canada Wholesale Sales MoM (SA) (Oct)A:--
F: --
P: --
 Germany Current Account (Not SA) (Oct)
A:--
F: --
P: --
U.S. Weekly Total Rig CountA:--
F: --
P: --
U.S. Weekly Total Oil Rig CountA:--
F: --
P: --
 Japan Tankan Large Non-Manufacturing Diffusion Index (Q4)
--
F: --
P: --
Japan Tankan Small Manufacturing Outlook Index (Q4)--
F: --
P: --
Japan Tankan Large Non-Manufacturing Outlook Index (Q4)--
F: --
P: --
Japan Tankan Large Manufacturing Outlook Index (Q4)--
F: --
P: --
Japan Tankan Small Manufacturing Diffusion Index (Q4)--
F: --
P: --
Japan Tankan Large Manufacturing Diffusion Index (Q4)--
F: --
P: --
Japan Tankan Large-Enterprise Capital Expenditure YoY (Q4)--
F: --
P: --
U.K. Rightmove House Price Index YoY (Dec)--
F: --
P: --
China, Mainland Industrial Output YoY (YTD) (Nov)--
F: --
P: --
China, Mainland Urban Area Unemployment Rate (Nov)--
F: --
P: --
 Saudi Arabia CPI YoY (Nov)
--
F: --
P: --
 Euro Zone Industrial Output YoY (Oct)
--
F: --
P: --
Euro Zone Industrial Output MoM (Oct)--
F: --
P: --
Canada Existing Home Sales MoM (Nov)--
F: --
P: --
Euro Zone Total Reserve Assets (Nov)--
F: --
P: --
U.K. Inflation Rate Expectations--
F: --
P: --
Canada National Economic Confidence Index--
F: --
P: --
Canada New Housing Starts (Nov)--
F: --
P: --
U.S. NY Fed Manufacturing Employment Index (Dec)--
F: --
P: --
U.S. NY Fed Manufacturing Index (Dec)--
F: --
P: --
Canada Core CPI YoY (Nov)--
F: --
P: --
Canada Manufacturing Unfilled Orders MoM (Oct)--
F: --
P: --
Canada Manufacturing New Orders MoM (Oct)--
F: --
P: --
Canada Core CPI MoM (Nov)--
F: --
P: --
Canada Manufacturing Inventory MoM (Oct)--
F: --
P: --
Canada CPI YoY (Nov)--
F: --
P: --
Canada CPI MoM (Nov)--
F: --
P: --
Canada CPI YoY (SA) (Nov)--
F: --
P: --
Canada Core CPI MoM (SA) (Nov)--
F: --
P: --

No matching data
Latest Views
Latest Views
Trending Topics
Top Columnists
Latest Update
White Label
Data API
Web Plug-ins
Affiliate Program
View All
No data
The Chicago Purchasing Managers’ Index (PMI), a key indicator of the economic health of the manufacturing sector in the Chicago...
The Chicago Purchasing Managers’ Index (PMI), a key indicator of the economic health of the manufacturing sector in the Chicago region, has reported a lower than expected figure. The recent data reveals the actual figure to be at 40.5, well below the forecasted 45.1.
This number not only missed forecasted expectations but also fell short when compared to the previous PMI figure, which stood at 44.6. The drop in the PMI indicates a contraction in the manufacturing sector, as a reading above 50 suggests expansion, while a reading below 50 points towards contraction.
The Chicago PMI is a significant tool in understanding the economic climate as it can aid in forecasting the ISM manufacturing PMI. The lower than expected reading is likely to be viewed as negative or bearish for the USD. This is due to the integral role the manufacturing sector plays in the overall economy, and any contraction could signal potential economic slowdown.
The importance of the Chicago PMI is underscored by its two-star rating, marking it as a key event to monitor for those invested in the health of the manufacturing sector and the broader economy. The lower than predicted number will undoubtedly draw the attention of investors and economists alike, as they navigate the implications of this contraction in the manufacturing sector.
While the manufacturing sector continues to show signs of contraction, it remains to be seen how this will impact the overall economy in the coming months. The lower PMI reading, however, is a clear signal that the sector is currently facing challenges, and it may take some time to see a rebound.
In conclusion, the lower than expected Chicago PMI figure of 40.5 is a clear indicator of contraction in the manufacturing sector, falling short of the forecasted 45.1 and the previous figure of 44.6. This development could potentially impact the USD and the broader economy, warranting close monitoring in the coming period.

Market sentiment took another bearish turn today following renewed rhetoric from US President Donald Trump, who accused China of having “totally violated” its preliminary trade agreement with the U.S. The comments, delivered via social media, were echoed by Trade Representative Jamieson Greer in a CNBC interview, where he expressed concern over China’s delayed compliance. Greer emphasized that while the US had fulfilled its commitments under the temporary trade deal, China was “slow rolling” its response—raising fears that tensions between the two economic powers may be re-escalating.
These remarks followed comments from Treasury Secretary Scott Bessent just a day earlier, who admitted that US-China trade talks were “a bit stalled,” though he hinted at possible high-level engagement in the coming weeks. However, the combined messaging from senior officials now points to growing frustration in Washington, increasing the risk of a renewed tariff cycle. That’s something the markets are highly sensitive to, especially with ongoing legal uncertainty surrounding the court-blocked reciprocal tariffs and their pending appeal.
On the macro front, the US April core PCE price index ticked down to 2.5% year-on-year, reaffirming that disinflation is progressing, albeit slowly. With inflation trending lower but global uncertainty mounting, Fed is widely expected to hold rates steady in the near term. Fed funds futures currently price in a 95% chance of a hold at the June FOMC meeting and a 73% chance of another hold in July. The soft inflation reading does little to shift the central bank’s cautious stance, especially as trade risks remain firmly in focus.
In the currency markets, Dollar is heading into the final house of the trading week as the strongest performer, followed by Swiss Franc and Euro. On the weaker end, Aussie struggles at the bottom, trailed by Yen and Loonie. Kiwi and Sterling are holding in the middle. However, with sentiment remaining fragile and trade headlines still in play, positioning could shift quickly before the weekly close.
In Europe, at the time of writing, FTSE is up 0.55%. DAX is up 0.72%. CAC is up 0.09%. UK 10-year yield is up 0.21 at 4.672. Germany 10-year yield is up 0.019 at 2.529. Earlier in Asia, Nikkei fell -1.22%. Hong Kong HSI fell -1.20%. China Shanghai SSE fell -0.47%. Singapore Strait Times fell -0.57%. Japan 10-year JGB yield fell -0.015 to 1.505.
US headline PCE price index rose 0.1% mom in April, in line with expectations, while annual inflation slipped from 2.3% yoy to 2.1% yoy, below the consensus of 2.2%.
Core PCE, Fed’s preferred inflation gauge, also rose 0.1% mom and slowed from 2.6% yoy to 2.5% yoy, matching expectations. The data supports the view that disinflation remains intact, though the pace of moderation remains modest.
At the same time, personal income data surprised to the upside, jumping 0.8% mom or USD 210.1B, well above the expected 0.3% mom. Personal spending rose a more modest 0.2% mom, matching forecasts.
Canada’s GDP grew by 0.1% mom in March, in line with market expectations. Strength in goods-producing industries continued to support overall output. The sector expanded by 0.2%, marking its second lead contribution in the past three months.
Services-producing industries also edged higher by 0.1%. In total, 9 out of 20 sectors posted growth.
Looking ahead, preliminary data from Statistics Canada suggests another 0.1% increase in real GDP for April.
Italian ECB Governing Council member Fabio Panetta said today that while the central bank has made meaningful progress in easing monetary policy, bringing the deposit rate down from 4% to 2.25%, “the room for further rate cuts has naturally diminished”.
“However, the economic outlook remains weak, and trade tensions could lead to a deterioration,” he added. “It will be essential to maintain a pragmatic and flexible approach, considering liquidity conditions and the signals coming from financial and credit markets.”
Panetta also highlighted the high-stakes nature of ongoing trade talks between the EU and the US, warning that even tensions are likely to have a “significant impact” on the region’s economy.
BoE MPC member Alan Taylor reinforced his dovish position in an interview with the Financial Times, highlighting growing downside risks to the UK economy from global developments.
Taylor, who alongside Swati Dhingra voted for a larger 50bps rate cut in May, argued that monetary policy should be on a “lower policy path” given the accumulating headwinds.
He specifically pointed to impact of Trump’s tariffs on imports would “be building up over the rest of this year in terms of trade diversion and drag on growth”.
While UK inflation unexpectedly jumped to 3.5% in April, Taylor downplayed the significance of the rise, attributing it to “one-time tax and administered price changes.”
Switzerland’s KOF Economic Barometer edged up to 98.5 in May from 97.1, marking a modest improvement in economic sentiment. While the uptick is a positive signal, the barometer remains below its long-term average, suggesting that the broader outlook for the Swiss economy “remains subdued”.
According to the KOF, the manufacturing sector showed notable strength, contributing to the overall improvement. However, indicators tied to foreign demand and private consumption remain under pressure, highlighting the ongoing drag from weak external conditions and cautious domestic spending.
Japan’s industrial production fell by -0.9% mom in April, a milder decline than the expected -1.4%. The Ministry of Economy, Trade and Industry maintained its view that production “fluctuates indecisively,” reflecting ongoing uncertainty, particularly around global trade developments.
While the ministry said the impact of US tariffs was limited in April, some firms have voiced concern about the manufacturing outlook as policy risks persist.
The breakdown of the data shows a mixed picture: six of 15 industrial sectors saw declines, including production machinery, fabricated metals, and transport equipment excluding motor vehicles. However, eight sectors recorded gains, with electronic parts and business-oriented machinery showing notable strength.
Manufacturers surveyed expect a sharp 9.0% rebound in May, followed by a -3.4% dip in June.
Also released, Japan’s retail sales grew by a stronger-than-expected 3.3% yoy in April, outpacing the consensus of 2.9% yoy. Meanwhile, the unemployment rate remained steady at 2.5%.
Tokyo’s core CPI (excluding fresh food) accelerated to 3.6% yoy in May, up from 3.4% yoy and above market expectations of 3.5% yoy, marking the fastest pace since January 2023. This marks the third consecutive year that core inflation has exceeded the Bank of Japan’s 2% target.
While headline CPI ticked down slightly from 3.5% yoy to 3.4% yoy, the underlying core-core measure (excluding food and energy) also edged up fro 2.0% yoy to 2.1% yoy, suggesting broad-based inflation persistence.
The surge in non-fresh food prices, up 6.9% yoy, remains a dominant driver—highlighted by a staggering 93.2% yoy jump in rice prices.
Another notable development is the uptick in services inflation, which climbed to 2.2% yoy from 2.0% yoy , indicating that businesses are beginning to pass on higher labor costs.
Australia’s retail sales turnover unexpectedly declined by -0.1% mom in April, missing expectations for a 0.3% mom rise. On an annual basis, sales were up 3.8% compared to April 2024/
The Australian Bureau of Statistics noted that the decline was driven primarily by reduced spending on clothing. The weakness was partly offset by a rebound in Queensland, where businesses recovered from disruptions caused by ex-Tropical Cyclone Alfred in March.
RBNZ Assistant Governor Karen Silk said that interest rates are currently within the estimated neutral band of 2.5% to 3.5%.
She noted that the full impact of previous easing has yet to filter through the economy, making any future adjustments highly dependent on incoming data.
The OCR track indicates “whatever we do is going to be data-dependent, and then we will be looking to the data to help us to decide when or if we cut further from here,” she added.
Daily Pivots: (S1) 0.8182; (P) 0.8265; (R1) 0.8312.
Range trading continues in USD/CHF and intraday bias stays neutral. On the downside, break of 0.8187 will resume the fall from 0.8475 to retest 0.8038 low. On the upside, above 0.8346 will bring stronger rise to 0.8475. Firm break there will extend the corrective pattern from 0.8038 with another rising leg.
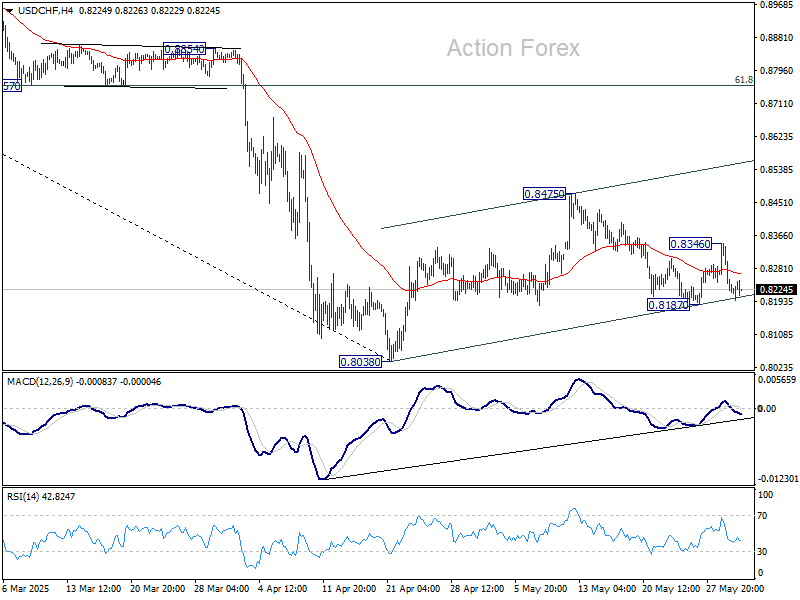
In the bigger picture, long term down trend from 1.0342 (2017 high) is still in progress and met 61.8% projection of 1.0146 (2022 high) to 0.8332 from 0.9200 at 0.8079 already. In any case, outlook will stay bearish as long as 55 W EMA (now at 0.8713) holds. Sustained break of 0.8079 will target 100% projection at 0.7382.
Equity markets are back to where they were, and the US dollar is 0.5% softer than when a court ruled the majority of US tariffs illegal on Wednesday evening. An appeals court yesterday intervened in favour of White House policy, but it seems like softer US consumption data in the GDP report made its mark. We have more US personal spending data today
Yesterday’s dollar rally didn’t last long. It quickly became clear that the Trump administration would pursue other trade laws to enact its tariffs, and later, the US Court of Appeals proposed a delay in the original court ruling that tariffs were illegal. The suggestion now is that a further presentation of evidence could last up until 9 June in the appeals court.
What weighed on the dollar more yesterday seemed to be the US macro data. Personal consumption got revised down to 1.2% from 1.7% quarter-on-quarter annualised in the first quarter GDP release. And a pick-up in initial claims didn’t help either. In effect, we saw a return to traditional correlations, where US Treasury yields dropped 5bp and the dollar weakened.
Traditional macro correlations could be in store for the dollar today. The focus here is on the April PCE data. Perhaps most important will be the personal spending number, which is expected to soften to 0.2% month-on-month from 0.7%. Any downside miss here would hit the dollar. The market will also be looking at the price data. This is expected to be very benign, with the core deflator still at 0.1% MoM, bringing the year-on-year rate to 2.5% – the lowest since 2021.
This might increase pressure on the Federal Reserve to ease, at a time when the White House is piling the pressure on Chair Jay Powell to cut rates (note the White House briefing on the Trump-Powell meeting yesterday). The topic of the end of Powell’s term, ending in May 2026, will no doubt start to weigh on the dollar early next year.
Friday is also our day to report on Fed Custody holdings of US Treasuries for foreign official accounts. In the week to Wednesday, these actually rose $10bn. So no evidence this week of a further divestment in US assets. Remember, the Fed thinks it’s hedging, not divestment, that has been driving the dollar lower recently.
DXY could make a run back to 98.70 should personal spending disappoint today.
While EUR/USD may be rallying on the travails of the dollar, the macro support for the euro is not particularly strong. Today, we’ve already seen some soft German retail sales data for April (although the March number was revised higher), and later today, we could see the May harmonised CPI data for Germany returning to 2.0% YoY.
This would mark perfect timing for next week’s European Central Bank meeting, where the market fully prices a 25bp cut in the deposit rate to 2.00%. For reference, the market currently prices 58bp of ECB easing this year versus 50bp for the Fed. That’s broadly in line with our house forecasts and suggests interest rate differentials (which currently suggest EUR/USD should be trading lower) may not be moving much from current levels.
As above, the US personal spending data may be the biggest driver of EUR/USD today and may keep it supported in the confines of a 1.1300-1.1400 short-term range.
Elsewhere, Swedish first-quarter GDP has disappointed at -0.2% QoQ and could bring forward expectations for another Riksbank rate cut – now only expected in September. The news is slightly bullish for EUR/SEK.
Tokyo May inflation data surprised on the upside. At the 3.6% YoY, the ex-food reading was the highest since early 2023. As Min Joo Kang outlines here, the data supports her view that the risk of a Bank of Japan rate hike in July is underpriced by the market. Currently, investors only attach a 14% probability to such an outcome.
A hike in July would certainly support the yen. It would also make it a little less expensive for Japanese holders to FX hedge their US assets. This interesting study on FX hedging suggests those investors from a low interest rate region (i.e., Japan) tend to have lower hedge ratios on US assets. Clearly, a reduction in hedging costs would add to the current narrative that the global investor community wants to raise its dollar hedge ratios. We have a 140-year-end forecast for USD/JPY. But the risks are clearly skewed to the downside here.
Most of this week’s data in the CEE region is due to be released today. We will see GDP data in the Czech Republic and Turkey this morning. In the Czech Republic, this is the second estimate for the first quarter; we shouldn’t see many changes, and the focus will be on the GDP breakdown. The consumer likely remained at the forefront of the economic rebound, while fixed investment remained rather dormant once again. In Turkey, we will only see a flash estimate, where we expect GDP to increase by 2.1% YoY in the first quarter, while there are signs of weakness for the second quarter.
Later today, May inflation will be released in Poland, first in the region as always. Headline inflation should be broadly similar to April at 4.3%, while core inflation probably increased slightly. Upward pressure from core inflation was compensated for by even deeper declines in fuel prices in annual terms, in our view. However, yesterday’s announcement of lower household gas prices pulls roughly 0.3ppt off the inflation profile from July – and that should push inflation towards the National Bank of Poland’s target even faster than we had previously expected.
More interesting will be the second round of the presidential elections in Poland this weekend. Yesterday’s polls show a very tight race with no clear favourite. From a market perspective, the election result will be pivotal for both the future of the current government and the direction of fiscal policy.
The outcome will therefore have a medium-term impact mainly on the bond market, while the impact on FX and rates ahead of the curve should fade quickly regardless of the election winner. Given the declining inflation profile, the NBP should deliver rate cuts in any case, negatively weighing on PLN, whose valuation appears quite tight in our view.
728 RM B 7/F GEE LOK IND BLDG NO 34 HUNG TO RD KWUN TONG KLN HONG KONG


White Label
Data API
Web Plug-ins
Poster Maker
Affiliate Program
The risk of loss in trading financial instruments such as stocks, FX, commodities, futures, bonds, ETFs and crypto can be substantial. You may sustain a total loss of the funds that you deposit with your broker. Therefore, you should carefully consider whether such trading is suitable for you in light of your circumstances and financial resources.
No decision to invest should be made without thoroughly conducting due diligence by yourself or consulting with your financial advisors. Our web content might not suit you since we don't know your financial conditions and investment needs. Our financial information might have latency or contain inaccuracy, so you should be fully responsible for any of your trading and investment decisions. The company will not be responsible for your capital loss.
Without getting permission from the website, you are not allowed to copy the website's graphics, texts, or trademarks. Intellectual property rights in the content or data incorporated into this website belong to its providers and exchange merchants.
Not Logged In
Log in to access more features

FastBull Membership
Not yet
Purchase


Log In
Sign Up


