Markets
News
Analysis
User
24/7
Economic Calendar
Education
Data
- Names
- Latest
- Prev


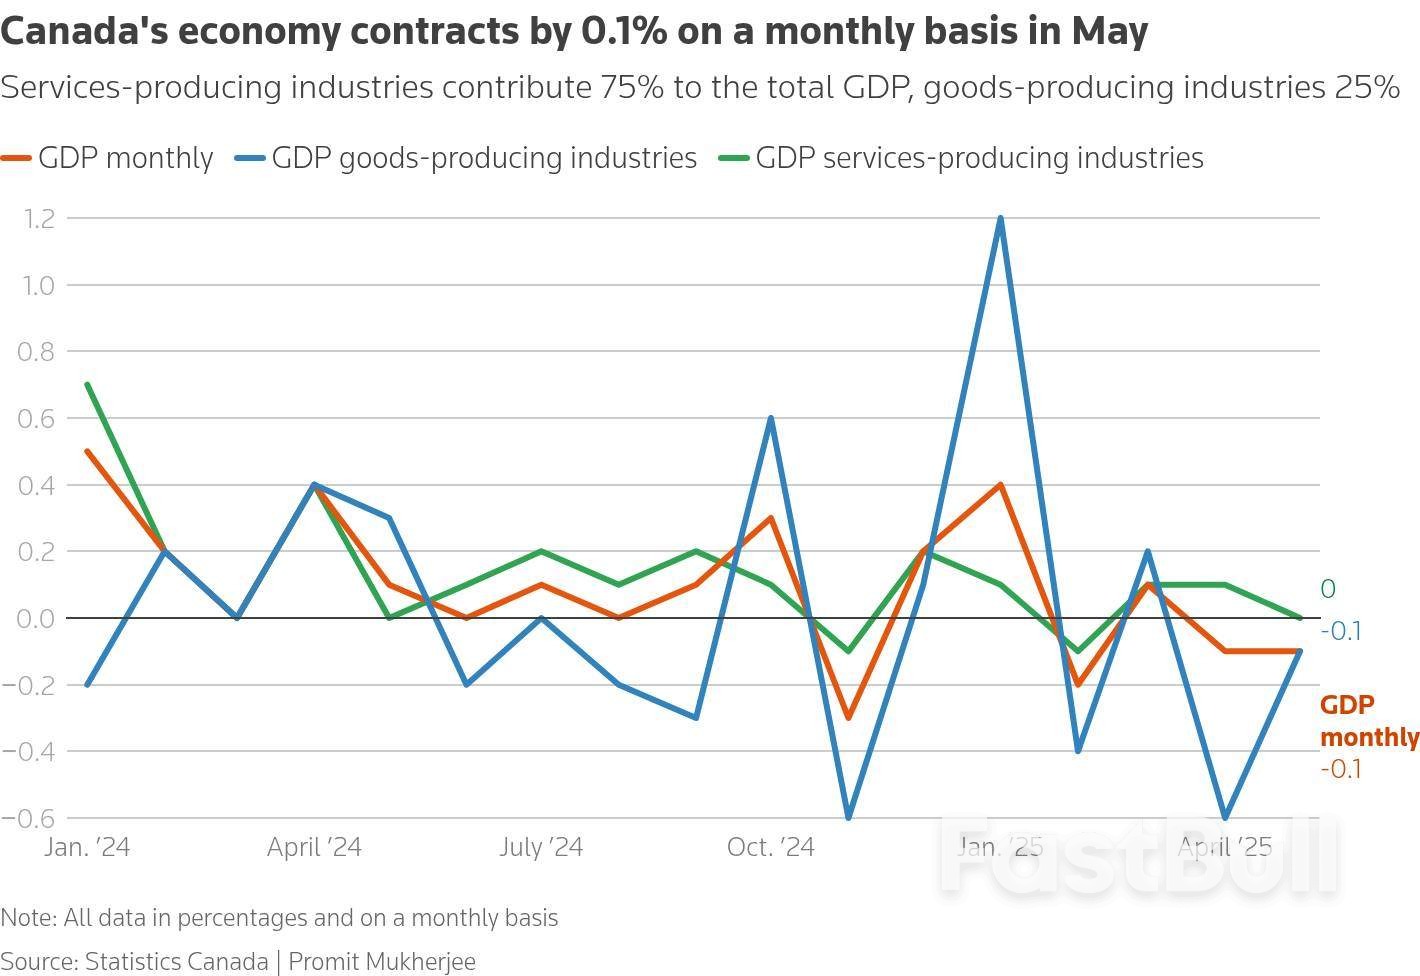
Canada's Gross Domestic Product shrank 0.1% in May on a monthly basis as expected but is likely to regain the lost ground in June as some sectors rebound, data showed on Thursday.
Canada's Gross Domestic Product shrank 0.1% in May on a monthly basis as expected but is likely to regain the lost ground in June as some sectors rebound, data showed on Thursday.
An advanced estimate showed GDP is likely to have expanded by 0.1% in June, and on an annualized basis it could also post growth of 0.1% for the second quarter, Statistics Canada said.
That is in contrast to the more widely held expectation for a second-quarter contraction, and could change when the final June numbers are released next month.
In May, the biggest hit to growth came from the retail trade sector which contracted 1.2%, StatsCan said, adding that activity across seven subsectors out of 12 shrank.
Retail trade is part of the larger services-producing industries that contribute up to 75% of total GDP. Overall, output from the services-producing group was flat in May as the drop in retail trade was offset by real estate and transportation.
Amongst goods-producing industries, which account for 25% of GDP, the mining, quarrying, and oil and gas extraction sector was the main laggard with activity shrinking 1% in the month.
Manufacturing expanded 0.7% on a monthly basis, after a 1.8% decline in April, largely as a result of higher inventory accumulation, the statistics agency said.
Canada's first quarter GDP expanded 2.2% on an annualized basis as exporters advanced their sales to the United States to beat a barrage of incoming tariffs. But as tariffs took effect from March, exports and industrial output took a hit.
The Bank of Canada, after announcing that it would keep rates on hold at 2.75% on Wednesday, said that it expected the economy to contract by 1.5% in the second quarter due to a 25% drop in exports.
StatsCan's forecast of even slim Q2 growth could take away the incentive for a rate cut in September, though data on inflation and job growth before the BoC's next meeting will be crucial.
Economists expressed doubt on a prospective growth in the second quarter as the data is calculated based on expenditure and income of people, unlike monthly GDP which is based on industry output.
"We will need to wait and see next month's quarterly GDP release to know whether the economy is really outperforming the Bank's expectations," Andrew Grantham, senior economist at CIBC Capital Markets wrote in a note.
Royce Mendes, head of macro strategy for Desjardins Group noted that there was lingering uncertainty about trade policy and domestic headwinds, which will continue to weigh on activity, forcing the central bank to restart cutting rates by September.
Money markets are betting around an 89% chance of the BoC holding rates on September 17, up three percentage points from before the GDP data was released .
The Canadian dollar dropped 0.11% to 1.3842 to the U.S. dollar, or 72.24 U.S. cents.
The U.S. and Canada are currently locked in negotiations to hash out a trade deal by Friday in a bid to reduce tariffs, but negotiators have admitted that it may not happen by the deadline.
728 RM B 7/F GEE LOK IND BLDG NO 34 HUNG TO RD KWUN TONG KLN HONG KONG


The risk of loss in trading financial instruments such as stocks, FX, commodities, futures, bonds, ETFs and crypto can be substantial. You may sustain a total loss of the funds that you deposit with your broker. Therefore, you should carefully consider whether such trading is suitable for you in light of your circumstances and financial resources.
No decision to invest should be made without thoroughly conducting due diligence by yourself or consulting with your financial advisors. Our web content might not suit you since we don't know your financial conditions and investment needs. Our financial information might have latency or contain inaccuracy, so you should be fully responsible for any of your trading and investment decisions. The company will not be responsible for your capital loss.
Without getting permission from the website, you are not allowed to copy the website's graphics, texts, or trademarks. Intellectual property rights in the content or data incorporated into this website belong to its providers and exchange merchants.
Not Logged In
Log in to access more features

FastBull Membership
Not yet
Purchase


Log In
Sign Up