


Markets
News
Analysis
User
24/7
Economic Calendar
Education
Data
- Names
- Latest
- Prev


Ethereum is hovering around the $2.6K level after an 8% surge. The market has witnessed $158.04 million in ETH liquidations.
The 2.80% spike in the overall crypto market cap has pushed it to $3.38 trillion, with the greedy sentiment lingering as the fear and greed index value positioned at 74. All the major assets have been charted in green, reclaiming their recent highs. Notably, the largest altcoin, Ethereum, has achieved its recovery attempt.
ETH has escaped the downside pressure by securing an 8.97% gain over the last 24 hours. The altcoin could continue trading on the upside if the bulls sustain. Also, a breakout above the $3K threshold is essential to fuel an aggressive upward move.
The altcoin opened the day trading at the bottom range of $2,453. After the bulls came into command, the price rose toward the $2,736 mark, breaking the crucial resistances at $2,577 and $2,706.
Ethereum trades at around $2,675 at press time, with a market cap of $322 billion. The daily trading volume has increased by over 11.94%, reaching $36.64 billion. Furthermore, the market has seen a liquidation of $158.04 million in ETH, as per Coinglass data.
The four-hour trading chart has exhibited a brief upside pressure, lighting up the green candle. Ethereum could likely climb to the crucial resistance at the $2,710 range. An extended upside correction might send the price toward $2.8K. A sustained bullish momentum triggers a prolonged upward move.
Assuming the bears came in command, the price could retrace to the $2,606 support level. Further downside price action triggers the death cross to emerge, and Ethereum might fall back to the former low at $2.5K or even lower. Additional setbacks could slow down and complicate the recovery.
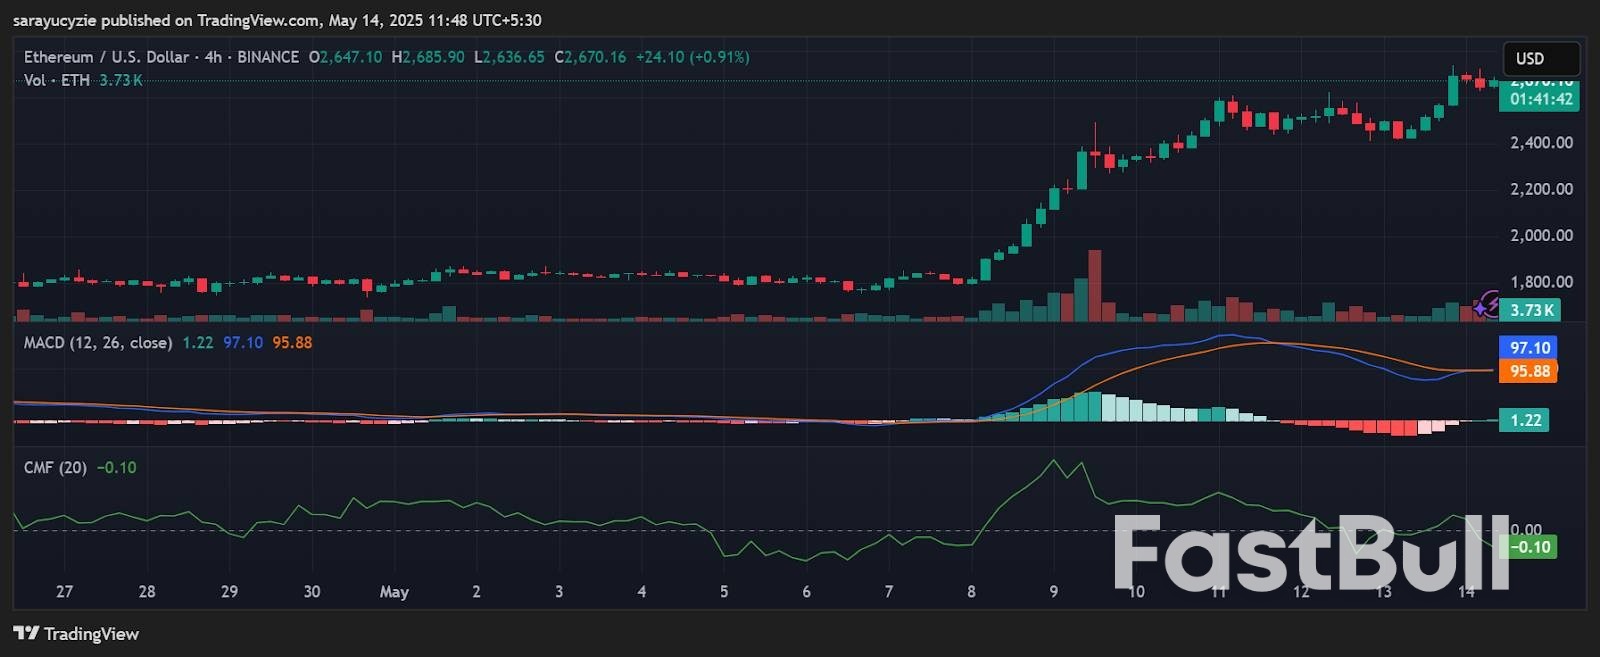 ETH chart (Source: TradingView)
ETH’s Moving Average Convergence Divergence (MACD) line is settled above the signal line. This implies a bullish crossover, and the asset’s price may gain upward strength. It is often seen as a buy signal. Moreover, the Chaikin Money Flow (CMF) indicator value is found at -0.10 hints at mild selling pressure in the market, with the capital flowing out of the asset.
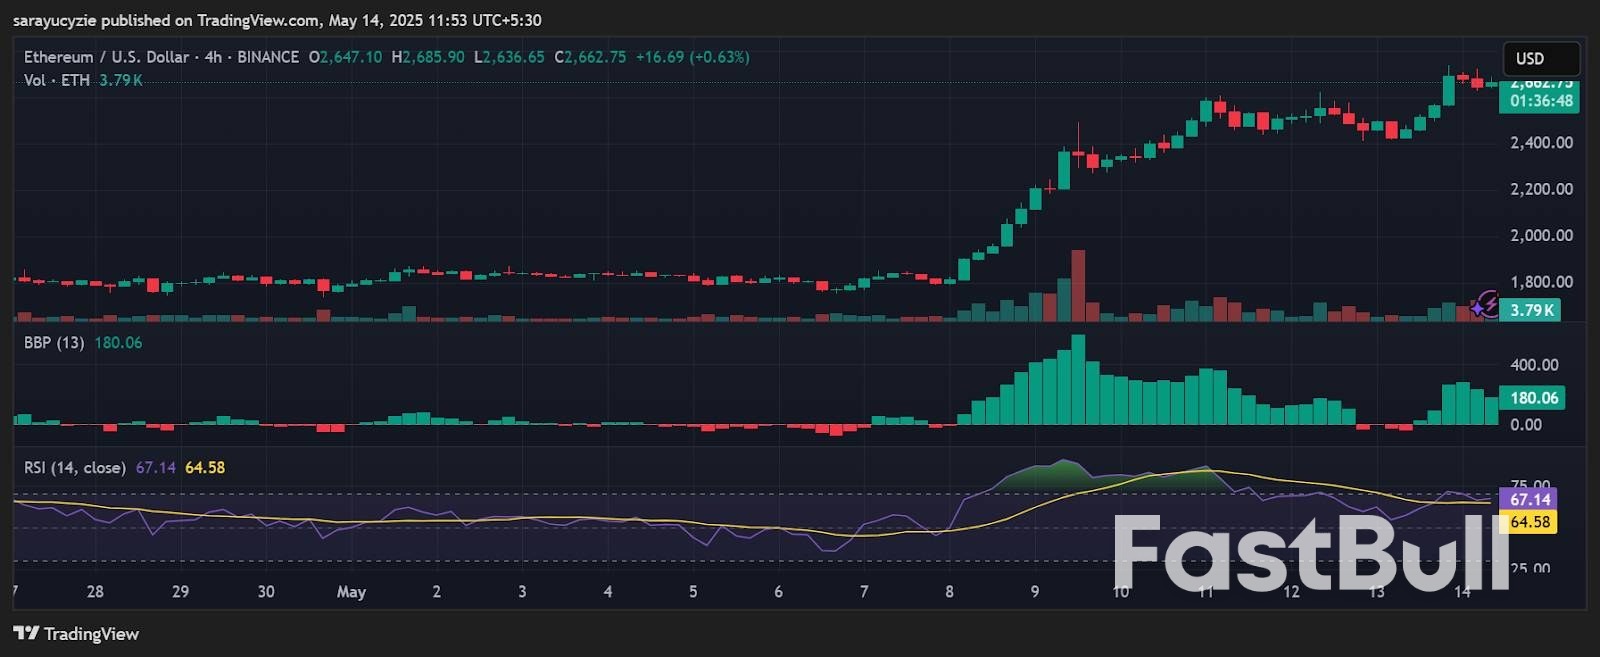 ETH chart (Source: TradingView)
The altcoin’s daily relative strength index (RSI) at 67.14 indicates that the asset is approaching the overbought territory. This bullish momentum may face resistance or a potential pullback. Besides, Ethereum’s Bull Bear Power (BBP) reading of 180.06 suggests sturdy dominance of bulls in the market.
728 RM B 7/F GEE LOK IND BLDG NO 34 HUNG TO RD KWUN TONG KLN HONG KONG


The risk of loss in trading financial instruments such as stocks, FX, commodities, futures, bonds, ETFs and crypto can be substantial. You may sustain a total loss of the funds that you deposit with your broker. Therefore, you should carefully consider whether such trading is suitable for you in light of your circumstances and financial resources.
No decision to invest should be made without thoroughly conducting due diligence by yourself or consulting with your financial advisors. Our web content might not suit you since we don't know your financial conditions and investment needs. Our financial information might have latency or contain inaccuracy, so you should be fully responsible for any of your trading and investment decisions. The company will not be responsible for your capital loss.
Without getting permission from the website, you are not allowed to copy the website's graphics, texts, or trademarks. Intellectual property rights in the content or data incorporated into this website belong to its providers and exchange merchants.
Not Logged In
Log in to access more features

FastBull Membership
Not yet
Purchase


Log In
Sign Up


