Markets
News
Analysis
User
24/7
Economic Calendar
Education
Data
- Names
- Latest
- Prev


Signal Accounts for Members
All Signal Accounts
All Contests


Japan Tankan Small Manufacturing Outlook Index (Q4)A:--
F: --
P: --
Japan Tankan Large Non-Manufacturing Outlook Index (Q4)A:--
F: --
P: --
Japan Tankan Large Manufacturing Outlook Index (Q4)A:--
F: --
P: --
Japan Tankan Small Manufacturing Diffusion Index (Q4)A:--
F: --
P: --
Japan Tankan Large Manufacturing Diffusion Index (Q4)A:--
F: --
P: --
Japan Tankan Large-Enterprise Capital Expenditure YoY (Q4)A:--
F: --
P: --
U.K. Rightmove House Price Index YoY (Dec)A:--
F: --
P: --
China, Mainland Industrial Output YoY (YTD) (Nov)A:--
F: --
P: --
China, Mainland Urban Area Unemployment Rate (Nov)A:--
F: --
P: --
Saudi Arabia CPI YoY (Nov)A:--
F: --
P: --
Euro Zone Industrial Output YoY (Oct)A:--
F: --
P: --
Euro Zone Industrial Output MoM (Oct)A:--
F: --
P: --
Canada Existing Home Sales MoM (Nov)A:--
F: --
P: --
Canada National Economic Confidence IndexA:--
F: --
P: --
Canada New Housing Starts (Nov)A:--
F: --
U.S. NY Fed Manufacturing Employment Index (Dec)A:--
F: --
P: --
U.S. NY Fed Manufacturing Index (Dec)A:--
F: --
P: --
Canada Core CPI YoY (Nov)A:--
F: --
P: --
Canada Manufacturing Unfilled Orders MoM (Oct)A:--
F: --
P: --
U.S. NY Fed Manufacturing Prices Received Index (Dec)A:--
F: --
P: --
U.S. NY Fed Manufacturing New Orders Index (Dec)A:--
F: --
P: --
Canada Manufacturing New Orders MoM (Oct)A:--
F: --
P: --
Canada Core CPI MoM (Nov)A:--
F: --
P: --
Canada Trimmed CPI YoY (SA) (Nov)A:--
F: --
P: --
Canada Manufacturing Inventory MoM (Oct)A:--
F: --
P: --
Canada CPI YoY (Nov)A:--
F: --
P: --
Canada CPI MoM (Nov)A:--
F: --
P: --
Canada CPI YoY (SA) (Nov)A:--
F: --
P: --
Canada Core CPI MoM (SA) (Nov)A:--
F: --
P: --
Canada CPI MoM (SA) (Nov)A:--
F: --
P: --
Federal Reserve Board Governor Milan delivered a speech
U.S. NAHB Housing Market Index (Dec)--
F: --
P: --
Australia Composite PMI Prelim (Dec)--
F: --
P: --
Australia Services PMI Prelim (Dec)--
F: --
P: --
Australia Manufacturing PMI Prelim (Dec)--
F: --
P: --
Japan Manufacturing PMI Prelim (SA) (Dec)--
F: --
P: --
U.K. 3-Month ILO Employment Change (Oct)--
F: --
P: --
U.K. Unemployment Claimant Count (Nov)--
F: --
P: --
U.K. Unemployment Rate (Nov)--
F: --
P: --
U.K. 3-Month ILO Unemployment Rate (Oct)--
F: --
P: --
U.K. Average Weekly Earnings (3-Month Average, Including Bonuses) YoY (Oct)--
F: --
P: --
U.K. Average Weekly Earnings (3-Month Average, Excluding Bonuses) YoY (Oct)--
F: --
P: --
France Services PMI Prelim (Dec)--
F: --
P: --
France Composite PMI Prelim (SA) (Dec)--
F: --
P: --
France Manufacturing PMI Prelim (Dec)--
F: --
P: --
Germany Services PMI Prelim (SA) (Dec)--
F: --
P: --
Germany Manufacturing PMI Prelim (SA) (Dec)--
F: --
P: --
Germany Composite PMI Prelim (SA) (Dec)--
F: --
P: --
Euro Zone Composite PMI Prelim (SA) (Dec)--
F: --
P: --
Euro Zone Services PMI Prelim (SA) (Dec)--
F: --
P: --
Euro Zone Manufacturing PMI Prelim (SA) (Dec)--
F: --
P: --
U.K. Services PMI Prelim (Dec)--
F: --
P: --
U.K. Manufacturing PMI Prelim (Dec)--
F: --
P: --
U.K. Composite PMI Prelim (Dec)--
F: --
P: --
Euro Zone ZEW Economic Sentiment Index (Dec)--
F: --
P: --
Germany ZEW Current Conditions Index (Dec)--
F: --
P: --
Germany ZEW Economic Sentiment Index (Dec)--
F: --
P: --
Euro Zone Trade Balance (Not SA) (Oct)--
F: --
P: --
Euro Zone ZEW Current Conditions Index (Dec)--
F: --
P: --
Euro Zone Trade Balance (SA) (Oct)--
F: --
P: --
U.S. Retail Sales MoM (Excl. Automobile) (SA) (Oct)--
F: --
P: --


No matching data
Latest Views
Latest Views
Trending Topics
Top Columnists
Latest Update
White Label
Data API
Web Plug-ins
Affiliate Program
View All

No data
A multi-billionaire Bitcoin whale is closing his recently opened Ether long positions and buying hundreds of millions worth of spot Ether, signaling that big investors are expecting more upside from the world’s second-largest cryptocurrency.
Last week, a Bitcoin whale worth over $11 billion sold 22,769 Bitcoin (BTC) worth $2.59 billion, rotating the funds into 472,920 spot Ether (ETH) or $2.2 billion and a $577 million Ether perpetual long position on the decentralized exchange Hyperliquid, Cointelegraph reported.
On Monday, the whale closed $450 million worth of his perpetual long position at an average Ether price of $4,735, to lock in $33 million worth of profit, before acquiring another $108 million worth of spot Ether, according to blockchain intelligence platform Lookonchain.
“He still holds 40,212 $ETH ($184M) longs, with an unrealized profit of $11M+,” added Lookonchain in a Monday X post.
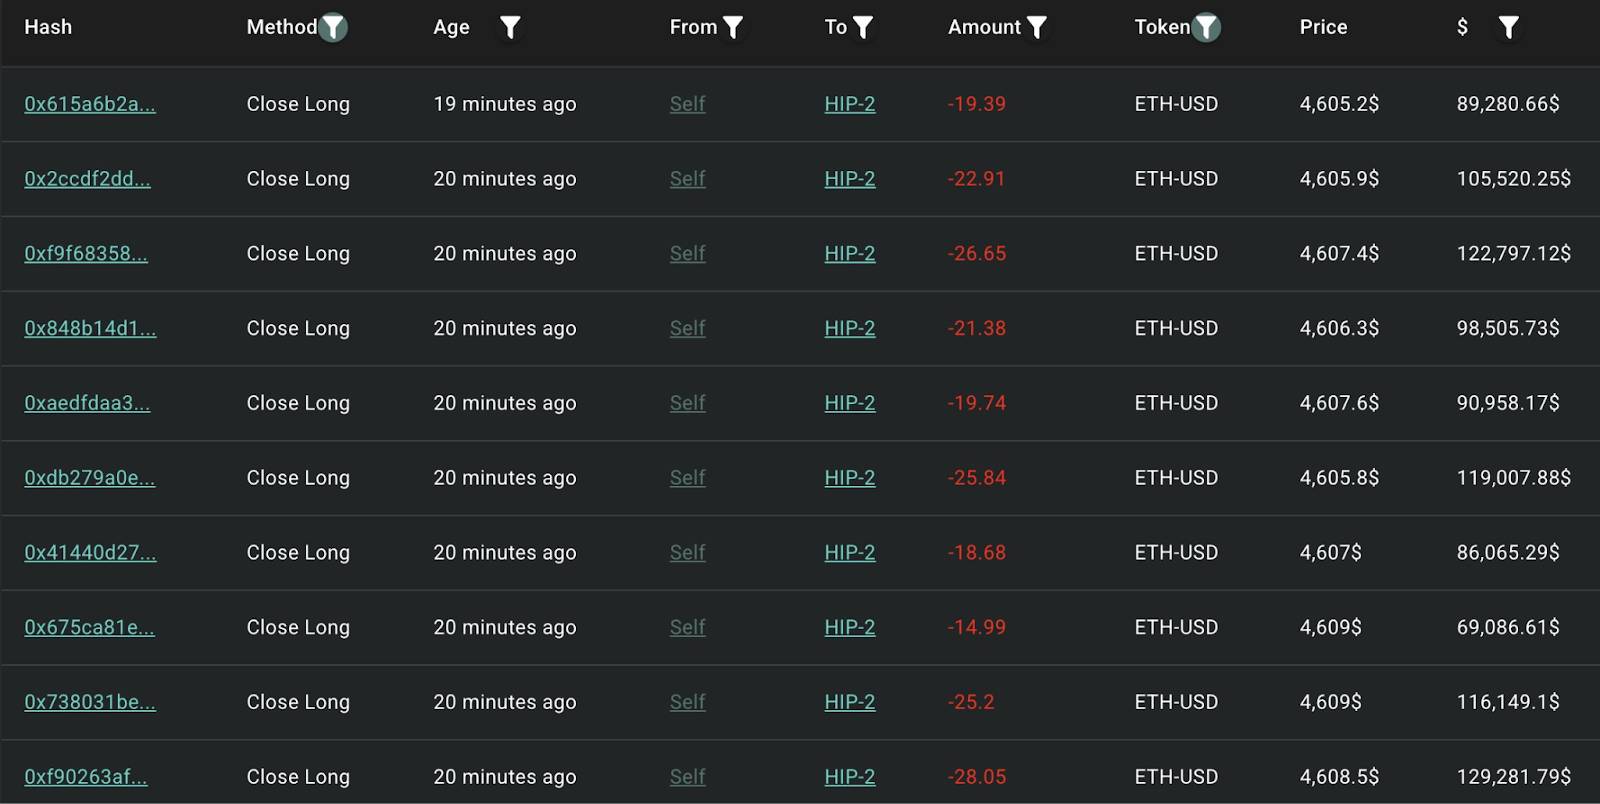
Source: LookonchainCryptocurrency traders often track large whale movements to gauge short-term market trends.
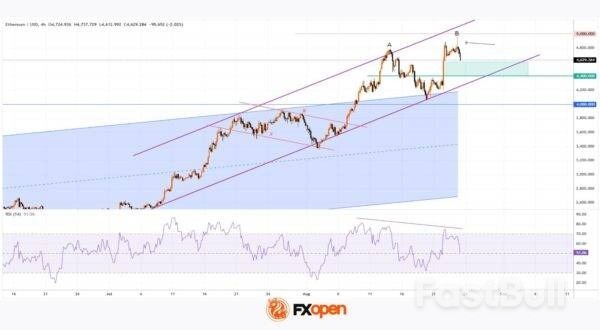
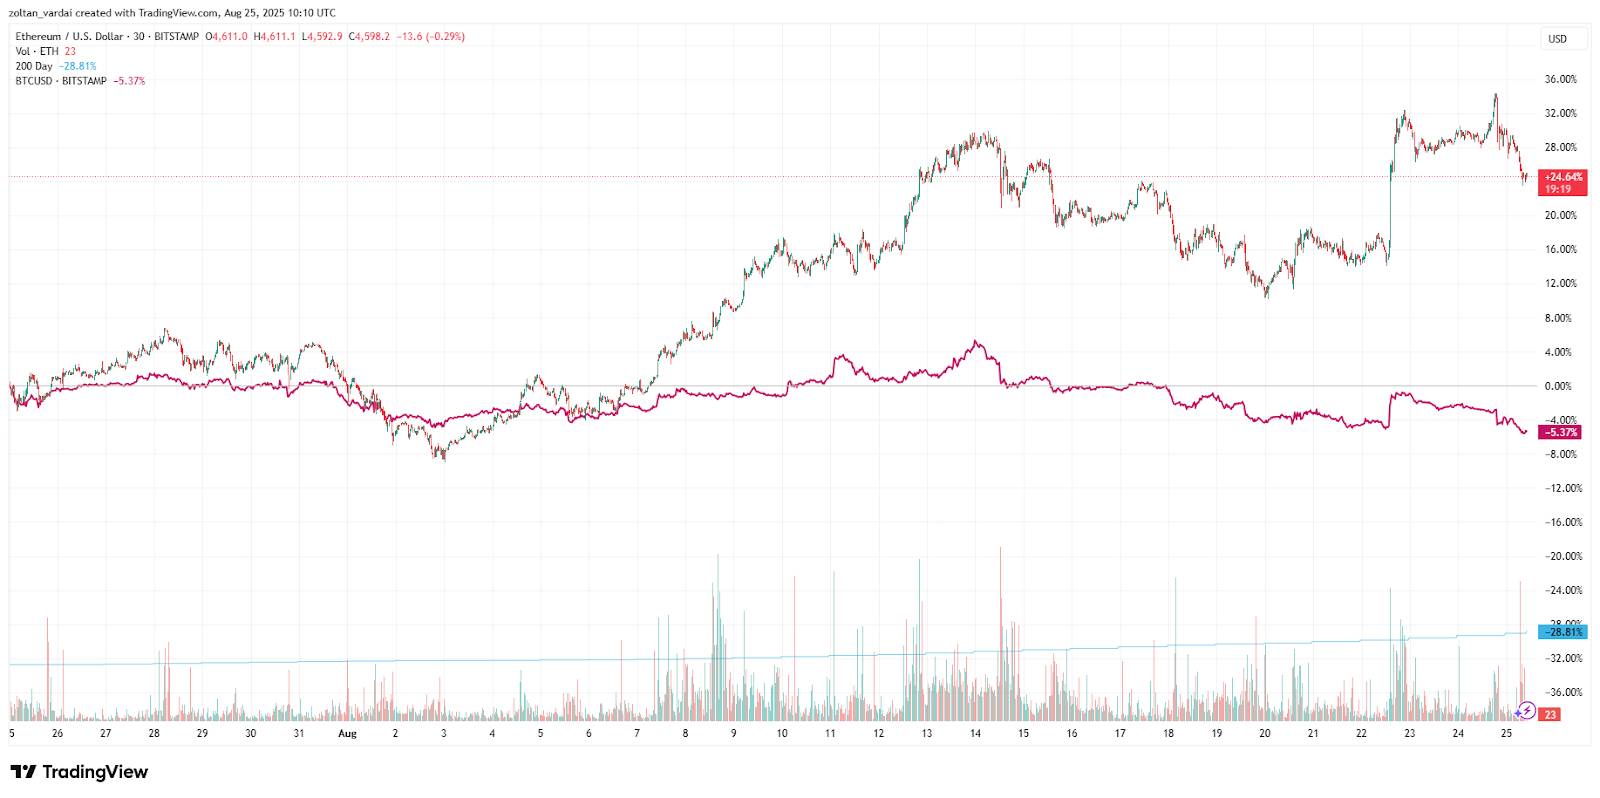
ETH vs BTC, one-month chart. Source: Cointelegraph/TradingViewWhale demand for Ether increased over the past month, as Ether’s price rose almost 25%, outperforming Bitcoin’s 5.3% decline over the past 30 days, TradingView data shows.
Analysts including Willy Woo are pointing to these whale rotations as the main reason behind last week’s Bitcoin slump to $112,000.
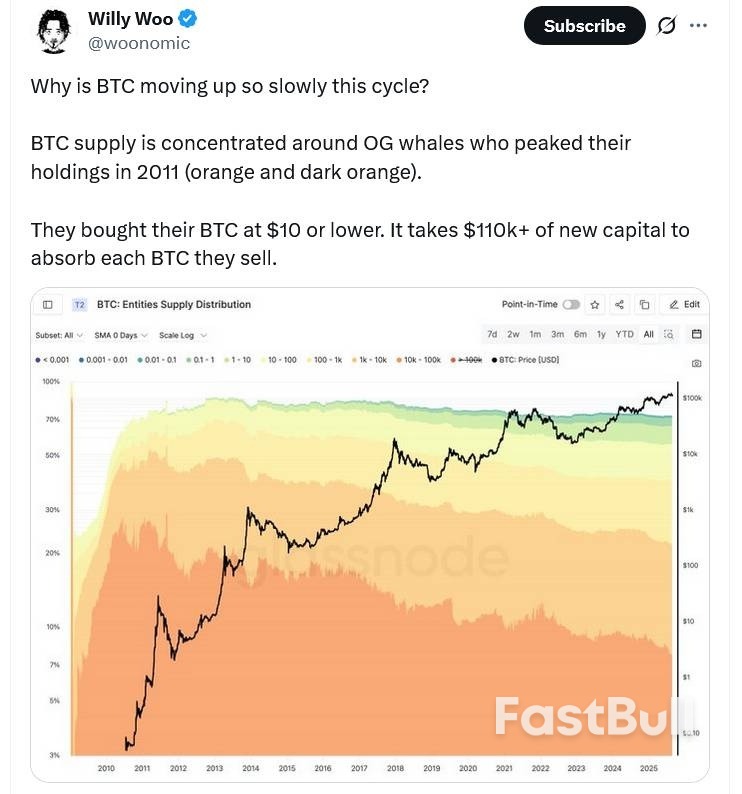
Source: Willy WooOn Sunday, Bitcoin fell nearly 2.2% from $114,666 at 7:31 pm UTC to $112,546 in nine minutes before bottoming out at $112,174 at 8:16 pm UTC.
While Bitcoin may see a lack of momentum over the next two weeks, it may enable investor capital to flow into Ether, signaling a new potential all-time highs, according to Gracy Chen, CEO of Bitget, the world’s sixth-largest cryptocurrency exchange by daily trading volume.
“Ethereum’s rally past $4,300 signals robust ecosystem demand and the potential onset of an altcoin season,” Chen told Cointelegraph, adding:
“Bitcoin is expected to trade in the $110,000–$120,000 range over the next one to two weeks, while Ethereum looks stronger, with targets between $4,600 and $5,200."
Chen called Federal Reserve Chair Jerome Powell’s “unexpectedly dovish comments” a “key catalyst” to boost risk appetite among crypto investors.
“On-chain data shows capital rotation underway, with whales selling Bitcoin to increase Ethereum exposure, further accelerating ETH’s momentum,” she said.
Chen’s comments came shortly after Powell’s speech at the annual central bank symposium in Jackson Hole on Friday, where he hinted that interest-rate cuts would resume in September.
Ethereum’s price fluctuations are showing strong bullish momentum, approaching the psychological threshold of $5,000:
→ since the beginning of August, ETH/USD has risen by approximately 25%;
→ since the start of summer – by more than 80%.
This year, market optimism is being shaped by:
→ the large-scale upgrade known as Pectra;
→ improvements in the US regulatory environment (such as the approval of a stablecoin bill and permission for pension funds to invest in cryptocurrencies);
→ weakening of the US dollar (Fed Chair Powell’s Friday speech triggered a fresh bearish impulse for the DXY dollar index).

Last month, we noted that:
→ ETH/USD price movements had formed an ascending channel (highlighted in blue);
→ we suggested that Ethereum’s steep price rally might slow down as the price approached the channel’s upper boundary (which acted as resistance).
Indeed, since then, the price developed a bullish flag pattern (marked R-S). However, the uptrend soon resumed with renewed strength, with:
→ a steeper upward trajectory emerging (shown with purple lines);
→ the upper boundary of the blue channel switching roles to act as support.
Given the inertia typical of financial market trends, it is difficult to imagine the current strong bullish momentum reversing into bearish action in the near term. The price continues to follow a steeper upward trajectory, while the $4,400–$4,600 zone (highlighted in green) may act as support, as the market advanced through this level with relative ease – a sign of imbalance in favour of buyers.
However, the ETH/USD chart is showing signs of growing bearish pressure:
→ a cascade of divergences on the RSI indicator;
→ long upper wicks (indicated by an arrow) on recent candlesticks;
→ a potential bearish double top formation (A-B).
It appears that the $5,000 mark is acting as psychological resistance, preventing the price from reaching the upper boundary of the purple channel. Therefore, even if an attempt to break above $5k occurs, it could trigger stronger selling pressure.
(Aug 25): Credit-rating firm Fitch on Monday maintained its long-term foreign-currency issuer default rating on India at 'BBB-', citing the country's strong economic growth and resilient external finances.
"India's economic outlook remains strong relative to peers, even as momentum has moderated in the past two years," Fitch said in a statement.
The agency forecast GDP growth of 6.5% for the fiscal year ending March 2026 (FY26), unchanged from FY25, and well above the 'BBB' median of 2.5%.
Fitch's rating comes days after S&P Global Ratings lifted its sovereign credit rating on India, citing strong economic growth, marking its first upgrade in 18 years.
Economic Affairs Secretary Anuradha Thakur had then said she expects other rating agencies to take note of the factors behind S&P's upgrade and follow suit.
Domestic demand will remain "solid" helped by the government's ongoing capital spending drive and steady private consumption, Fitch said, but flagged that private investment will remain moderate due to risks from US tariffs.
US President Donald Trump has threatened to double tariffs on Indian goods to 50% — among the highest rates imposed on Washington's trade partners — targeting India's oil purchases from Russia. The 50% tariffs are set to kick in from Aug 27.
"US tariffs are a moderate downside risk to our forecast," Fitch said, adding that they will reduce India's ability to benefit from supply chain shifts out of China if tariff levels fail to be negotiated lower.
"Proposed goods and services tax (GST) reforms, if adopted, would support consumption, offsetting some of these growth risks," Fitch added, referring to the tax restructuring promises made by Indian Prime Minister Narendra Modi earlier this month.
The euro strengthened against the US dollar on Friday following a speech by Federal Reserve Chair Jerome Powell at the Jackson Hole Economic Symposium, closing the week on a positive note. While Powell acknowledged the potential for an interest rate cut as soon as September, he refrained from making any explicit commitments.
The EUR/USD pair rose to 1.1728, reaching its highest level since 28 July.
Market expectations for a rate cut at the Fed’s September meeting (16–17) now stand at 85%. For the remainder of the year, market pricing points to a more dovish outlook, with an average of 54 basis points of easing anticipated, up from 48 basis points previously.
Investor attention is now shifting to labour market data. Powell noted that the market is in an unusual balance, with both demand for and supply of workers slowing. The trajectory of employment will be a key determinant for the Fed’s future policy decisions.
An additional factor weighing on the dollar is the growing scrutiny surrounding the Fed’s independence. Last week, US President Donald Trump called for the resignation of Federal Reserve Governor Lisa Cook and suggested she could be dismissed. This has further fuelled concerns about political pressure being exerted on the central bank.
H4 Chart:
On the H4 chart, the market has formed a consolidation range around the 1.1566 level. Following an upward breakout, the corrective wave appears to have completed at the 1.1742 high. The primary focus is now on the potential initiation of a new bearish wave targeting the 1.1550 level. This scenario is technically supported by the MACD indicator, whose signal line remains below zero and is pointing decisively lower.

H1 Chart:
On the H1 chart, the market completed an ascending wave to the 1.1742 level and subsequently formed a consolidation range below it. The price has now broken downwards out of this range. The immediate outlook suggests a high probability of a further decline towards the 1.1664 support level. Following this, a corrective bounce towards 1.1694 is possible. The broader structure is then expected to resume its downward trajectory, targeting 1.1590, with the ultimate bearish objective for the wave structure seen at 1.1550. This view is corroborated by the Stochastic oscillator, whose signal line is currently below the 50 midline and is trending sharply lower towards the 20 level.

While fundamental drivers from the Fed provided a lift, the technical picture suggests the euro’s rally may be limited in the near term.
White Label
Data API
Web Plug-ins
Poster Maker
Affiliate Program
The risk of loss in trading financial instruments such as stocks, FX, commodities, futures, bonds, ETFs and crypto can be substantial. You may sustain a total loss of the funds that you deposit with your broker. Therefore, you should carefully consider whether such trading is suitable for you in light of your circumstances and financial resources.
No decision to invest should be made without thoroughly conducting due diligence by yourself or consulting with your financial advisors. Our web content might not suit you since we don't know your financial conditions and investment needs. Our financial information might have latency or contain inaccuracy, so you should be fully responsible for any of your trading and investment decisions. The company will not be responsible for your capital loss.
Without getting permission from the website, you are not allowed to copy the website's graphics, texts, or trademarks. Intellectual property rights in the content or data incorporated into this website belong to its providers and exchange merchants.
Not Logged In
Log in to access more features

FastBull Membership
Not yet
Purchase
Log In
Sign Up