• Trade
  • Markets
  • Copy
  • Contests
  • News
  • 24/7
  • Calendar
  • Q&A
  • Chats
Trending
Screeners
SYMBOL
LAST
BID
ASK
HIGH
LOW
NET CHG.
%CHG.
SPREAD
SPX
S&P 500 Index
6870.39
6870.39
6870.39
6895.79
6858.28
+13.27
+ 0.19%
--
DJI
Dow Jones Industrial Average
47954.98
47954.98
47954.98
48133.54
47871.51
+104.05
+ 0.22%
--
IXIC
NASDAQ Composite Index
23578.12
23578.12
23578.12
23680.03
23506.00
+72.99
+ 0.31%
--
USDX
US Dollar Index
98.830
98.910
98.830
98.960
98.810
-0.120
-0.12%
--
EURUSD
Euro / US Dollar
1.16525
1.16533
1.16525
1.16551
1.16341
+0.00099
+ 0.09%
--
GBPUSD
Pound Sterling / US Dollar
1.33393
1.33403
1.33393
1.33420
1.33151
+0.00081
+ 0.06%
--
XAUUSD
Gold / US Dollar
4209.76
4210.15
4209.76
4213.03
4190.61
+11.85
+ 0.28%
--
WTI
Light Sweet Crude Oil
59.934
59.971
59.934
60.063
59.752
+0.125
+ 0.21%
--

Community Accounts

Signal Accounts
--
Profit Accounts
--
Loss Accounts
--
View More

Become a signal provider

Sell trading signals to earn additional income

View More

Guide to Copy Trading

Get started with ease and confidence

View More

Signal Accounts for Members

All Signal Accounts

Best Return
  • Best Return
  • Best P/L
  • Best MDD
Past 1W
  • Past 1W
  • Past 1M
  • Past 1Y

All Contests

  • All
  • Trump Updates
  • Recommend
  • Stocks
  • Cryptocurrencies
  • Central Banks
  • Featured News
Top News Only
Share

China November Copper Imports At 427000 Tonnes

Share

China November Coal Imports At 44.05 Million Tonnes

Share

China November Iron Ore Imports At 110.54 Million Tonnes, Down 0.7 % From October

Share

China November Meat Imports At 393000 Tonnes

Share

China Imported 8.11 Million Tonnes Of Soy In November

Share

China November Crude Oil Imports Up 5.2 % From October

Share

China November Rare Earth Exports At 5493.9 Tonnes

Share

China Jan-Nov Iron Ore Imports Up 1.4% At 1.139 Billion Metric Tons

Share

China Jan-Nov Trade Balance 7708.1 Billion Yuan

Share

Trump Plans To Announce A $12 Billion Agricultural Aid Package On Monday

Share

Indonesia's Benchmark Stock Index Rises As Much As 0.7% To A Record High Of 8694.907 Points

Share

China Jan-Nov Coal Imports Down 12% At 432 Million Metric Tons

Share

China Jan-Nov Crude Oil Imports Up 3.2% At 522 Million Metric Tons

Share

China Jan-Nov Unwrought Copper Imports Down 4.7% At 4.88 Million Metric Tons

Share

China Jan-Nov Soybean Imports Up 6.9% At 104 Million Metric Tons

Share

China Jan-Nov Natural Gas Imports Down 4.7% At 114 Million Metric Tons

Share

Taiwan's Dollar Rises As Much As 0.4% To 31.128 Per US Dollar, Highest Since November 17

Share

China Jan-Nov Yuan-Denominated Imports +0.2% Year-On-Year

Share

China Jan-Nov Yuan-Denominated Exports +6.2% Year-On-Year

Share

China Nov Yuan-Denominated Imports +1.7% Year-On-Year

TIME
ACT
FCST
PREV
U.S. Personal Income MoM (Sept)

A:--

F: --

P: --

U.S. PCE Price Index YoY (SA) (Sept)

A:--

F: --

P: --

U.S. PCE Price Index MoM (Sept)

A:--

F: --

P: --

U.S. Personal Outlays MoM (SA) (Sept)

A:--

F: --

P: --

U.S. Core PCE Price Index MoM (Sept)

A:--

F: --

P: --

U.S. Core PCE Price Index YoY (Sept)

A:--

F: --

P: --

U.S. UMich 5-Year-Ahead Inflation Expectations Prelim YoY (Dec)

A:--

F: --

P: --

U.S. Real Personal Consumption Expenditures MoM (Sept)

A:--

F: --

P: --

U.S. UMich Current Economic Conditions Index Prelim (Dec)

A:--

F: --

P: --

U.S. UMich Consumer Sentiment Index Prelim (Dec)

A:--

F: --

P: --

U.S. UMich 1-Year-Ahead Inflation Expectations Prelim (Dec)

A:--

F: --

P: --

U.S. UMich Consumer Expectations Index Prelim (Dec)

A:--

F: --

P: --

U.S. Weekly Total Rig Count

A:--

F: --

P: --

U.S. Weekly Total Oil Rig Count

A:--

F: --

P: --

U.S. Unit Labor Cost Prelim (SA) (Q3)

--

F: --

P: --

U.S. Consumer Credit (SA) (Oct)

A:--

F: --

P: --

China, Mainland Foreign Exchange Reserves (Nov)

A:--

F: --

P: --

Japan Wages MoM (Oct)

A:--

F: --

P: --

Japan Trade Balance (Oct)

A:--

F: --

P: --

Japan Nominal GDP Revised QoQ (Q3)

A:--

F: --

P: --

Japan Trade Balance (Customs Data) (SA) (Oct)

A:--

F: --

P: --

Japan GDP Annualized QoQ Revised (Q3)

A:--

F: --

P: --
China, Mainland Exports YoY (CNH) (Nov)

A:--

F: --

P: --

China, Mainland Imports YoY (CNH) (Nov)

A:--

F: --

P: --

China, Mainland Exports (Nov)

A:--

F: --

P: --

China, Mainland Imports (CNH) (Nov)

A:--

F: --

P: --

China, Mainland Trade Balance (CNH) (Nov)

A:--

F: --

P: --

China, Mainland Imports YoY (USD) (Nov)

A:--

F: --

P: --

China, Mainland Exports YoY (USD) (Nov)

A:--

F: --

P: --

China, Mainland Trade Balance (USD) (Nov)

A:--

F: --

P: --

Germany Industrial Output MoM (SA) (Oct)

--

F: --

P: --

Euro Zone Sentix Investor Confidence Index (Dec)

--

F: --

P: --

Canada Leading Index MoM (Nov)

--

F: --

P: --

Canada National Economic Confidence Index

--

F: --

P: --

U.S. Dallas Fed PCE Price Index YoY (Sept)

--

F: --

P: --

China, Mainland Trade Balance (USD) (Nov)

--

F: --

P: --

U.S. 3-Year Note Auction Yield

--

F: --

P: --

U.K. BRC Overall Retail Sales YoY (Nov)

--

F: --

P: --

U.K. BRC Like-For-Like Retail Sales YoY (Nov)

--

F: --

P: --

Australia Overnight (Borrowing) Key Rate

--

F: --

P: --

RBA Rate Statement
RBA Press Conference
Germany Exports MoM (SA) (Oct)

--

F: --

P: --

U.S. NFIB Small Business Optimism Index (SA) (Nov)

--

F: --

P: --

Mexico Core CPI YoY (Nov)

--

F: --

P: --

Mexico 12-Month Inflation (CPI) (Nov)

--

F: --

P: --

Mexico PPI YoY (Nov)

--

F: --

P: --

Mexico CPI YoY (Nov)

--

F: --

P: --

U.S. Weekly Redbook Index YoY

--

F: --

P: --

U.S. JOLTS Job Openings (SA) (Oct)

--

F: --

P: --

China, Mainland M2 Money Supply YoY (Nov)

--

F: --

P: --

China, Mainland M0 Money Supply YoY (Nov)

--

F: --

P: --

China, Mainland M1 Money Supply YoY (Nov)

--

F: --

P: --

U.S. EIA Short-Term Crude Production Forecast For The Next Year (Dec)

--

F: --

P: --

U.S. EIA Short-Term Crude Production Forecast For The Year (Dec)

--

F: --

P: --

U.S. EIA Natural Gas Production Forecast For The Next Year (Dec)

--

F: --

P: --

EIA Monthly Short-Term Energy Outlook
U.S. 10-Year Note Auction Avg. Yield

--

F: --

P: --

U.S. API Weekly Cushing Crude Oil Stocks

--

F: --

P: --

U.S. API Weekly Crude Oil Stocks

--

F: --

P: --

Q&A with Experts
    • All
    • Chatrooms
    • Groups
    • Friends
    Connecting
    .
    .
    .
    Type here...
    Add Symbol or Code

      No matching data

      All
      Trump Updates
      Recommend
      Stocks
      Cryptocurrencies
      Central Banks
      Featured News
      • All
      • Russia-Ukraine Conflict
      • Middle East Flashpoint
      • All
      • Russia-Ukraine Conflict
      • Middle East Flashpoint

      Search
      Products

      Charts Free Forever

      Chats Q&A with Experts
      Screeners Economic Calendar Data Tools
      Membership Features
      Data Warehouse Market Trends Institutional Data Policy Rates Macro

      Market Trends

      Market Sentiment Order Book Forex Correlations

      Top Indicators

      Charts Free Forever
      Markets

      News

      News Analysis 24/7 Columns Education
      From Institutions From Analysts
      Topics Columnists

      Latest Views

      Latest Views

      Trending Topics

      Top Columnists

      Latest Update

      Signals

      Copy Rankings Latest Signals Become a signal provider AI Rating
      Contests
      Brokers

      Overview Brokers Assessment Rankings Regulators News Claims
      Broker listing Forex Brokers Comparison Tool Live Spread Comparison Scam
      Q&A Complaint Scam Alert Videos Tips to Detect Scam
      More

      Business
      Events
      Careers About Us Advertising Help Center

      White Label

      Data API

      Web Plug-ins

      Affiliate Program

      Awards Institution Evaluation IB Seminar Salon Event Exhibition
      Vietnam Thailand Singapore Dubai
      Fans Party Investment Sharing Session
      FastBull Summit BrokersView Expo
      Recent Searches
        Top Searches
          Markets
          News
          Analysis
          User
          24/7
          Economic Calendar
          Education
          Data
          • Names
          • Latest
          • Prev

          View All

          No data

          Scan to Download

          Faster Charts, Chat Faster!

          Download App
          English
          • English
          • Español
          • العربية
          • Bahasa Indonesia
          • Bahasa Melayu
          • Tiếng Việt
          • ภาษาไทย
          • Français
          • Italiano
          • Türkçe
          • Русский язык
          • 简中
          • 繁中
          Open Account
          Search
          Products
          Charts Free Forever
          Markets
          News
          Signals

          Copy Rankings Latest Signals Become a signal provider AI Rating
          Contests
          Brokers

          Overview Brokers Assessment Rankings Regulators News Claims
          Broker listing Forex Brokers Comparison Tool Live Spread Comparison Scam
          Q&A Complaint Scam Alert Videos Tips to Detect Scam
          More

          Business
          Events
          Careers About Us Advertising Help Center

          White Label

          Data API

          Web Plug-ins

          Affiliate Program

          Awards Institution Evaluation IB Seminar Salon Event Exhibition
          Vietnam Thailand Singapore Dubai
          Fans Party Investment Sharing Session
          FastBull Summit BrokersView Expo

          What Is An Inverse Fair Value Gap (IFVG) Concept In Trading?

          FXOpen

          Forex

          Cryptocurrency

          Technical Analysis

          Summary:

          Inverse Fair Value Gaps (IFVGs) are a fascinating concept for traders seeking to refine their understanding of price behaviour.

          Inverse Fair Value Gaps (IFVGs) are a fascinating concept for traders seeking to refine their understanding of price behaviour. By identifying areas where market sentiment shifts, IFVGs provide unique insights into potential reversals and key price levels. In this article, we’ll explore what IFVGs are, how they differ from Fair Value Gaps, and how traders can integrate them into their strategies for more comprehensive market analysis.

          What Is a Fair Value Gap (FVG)?

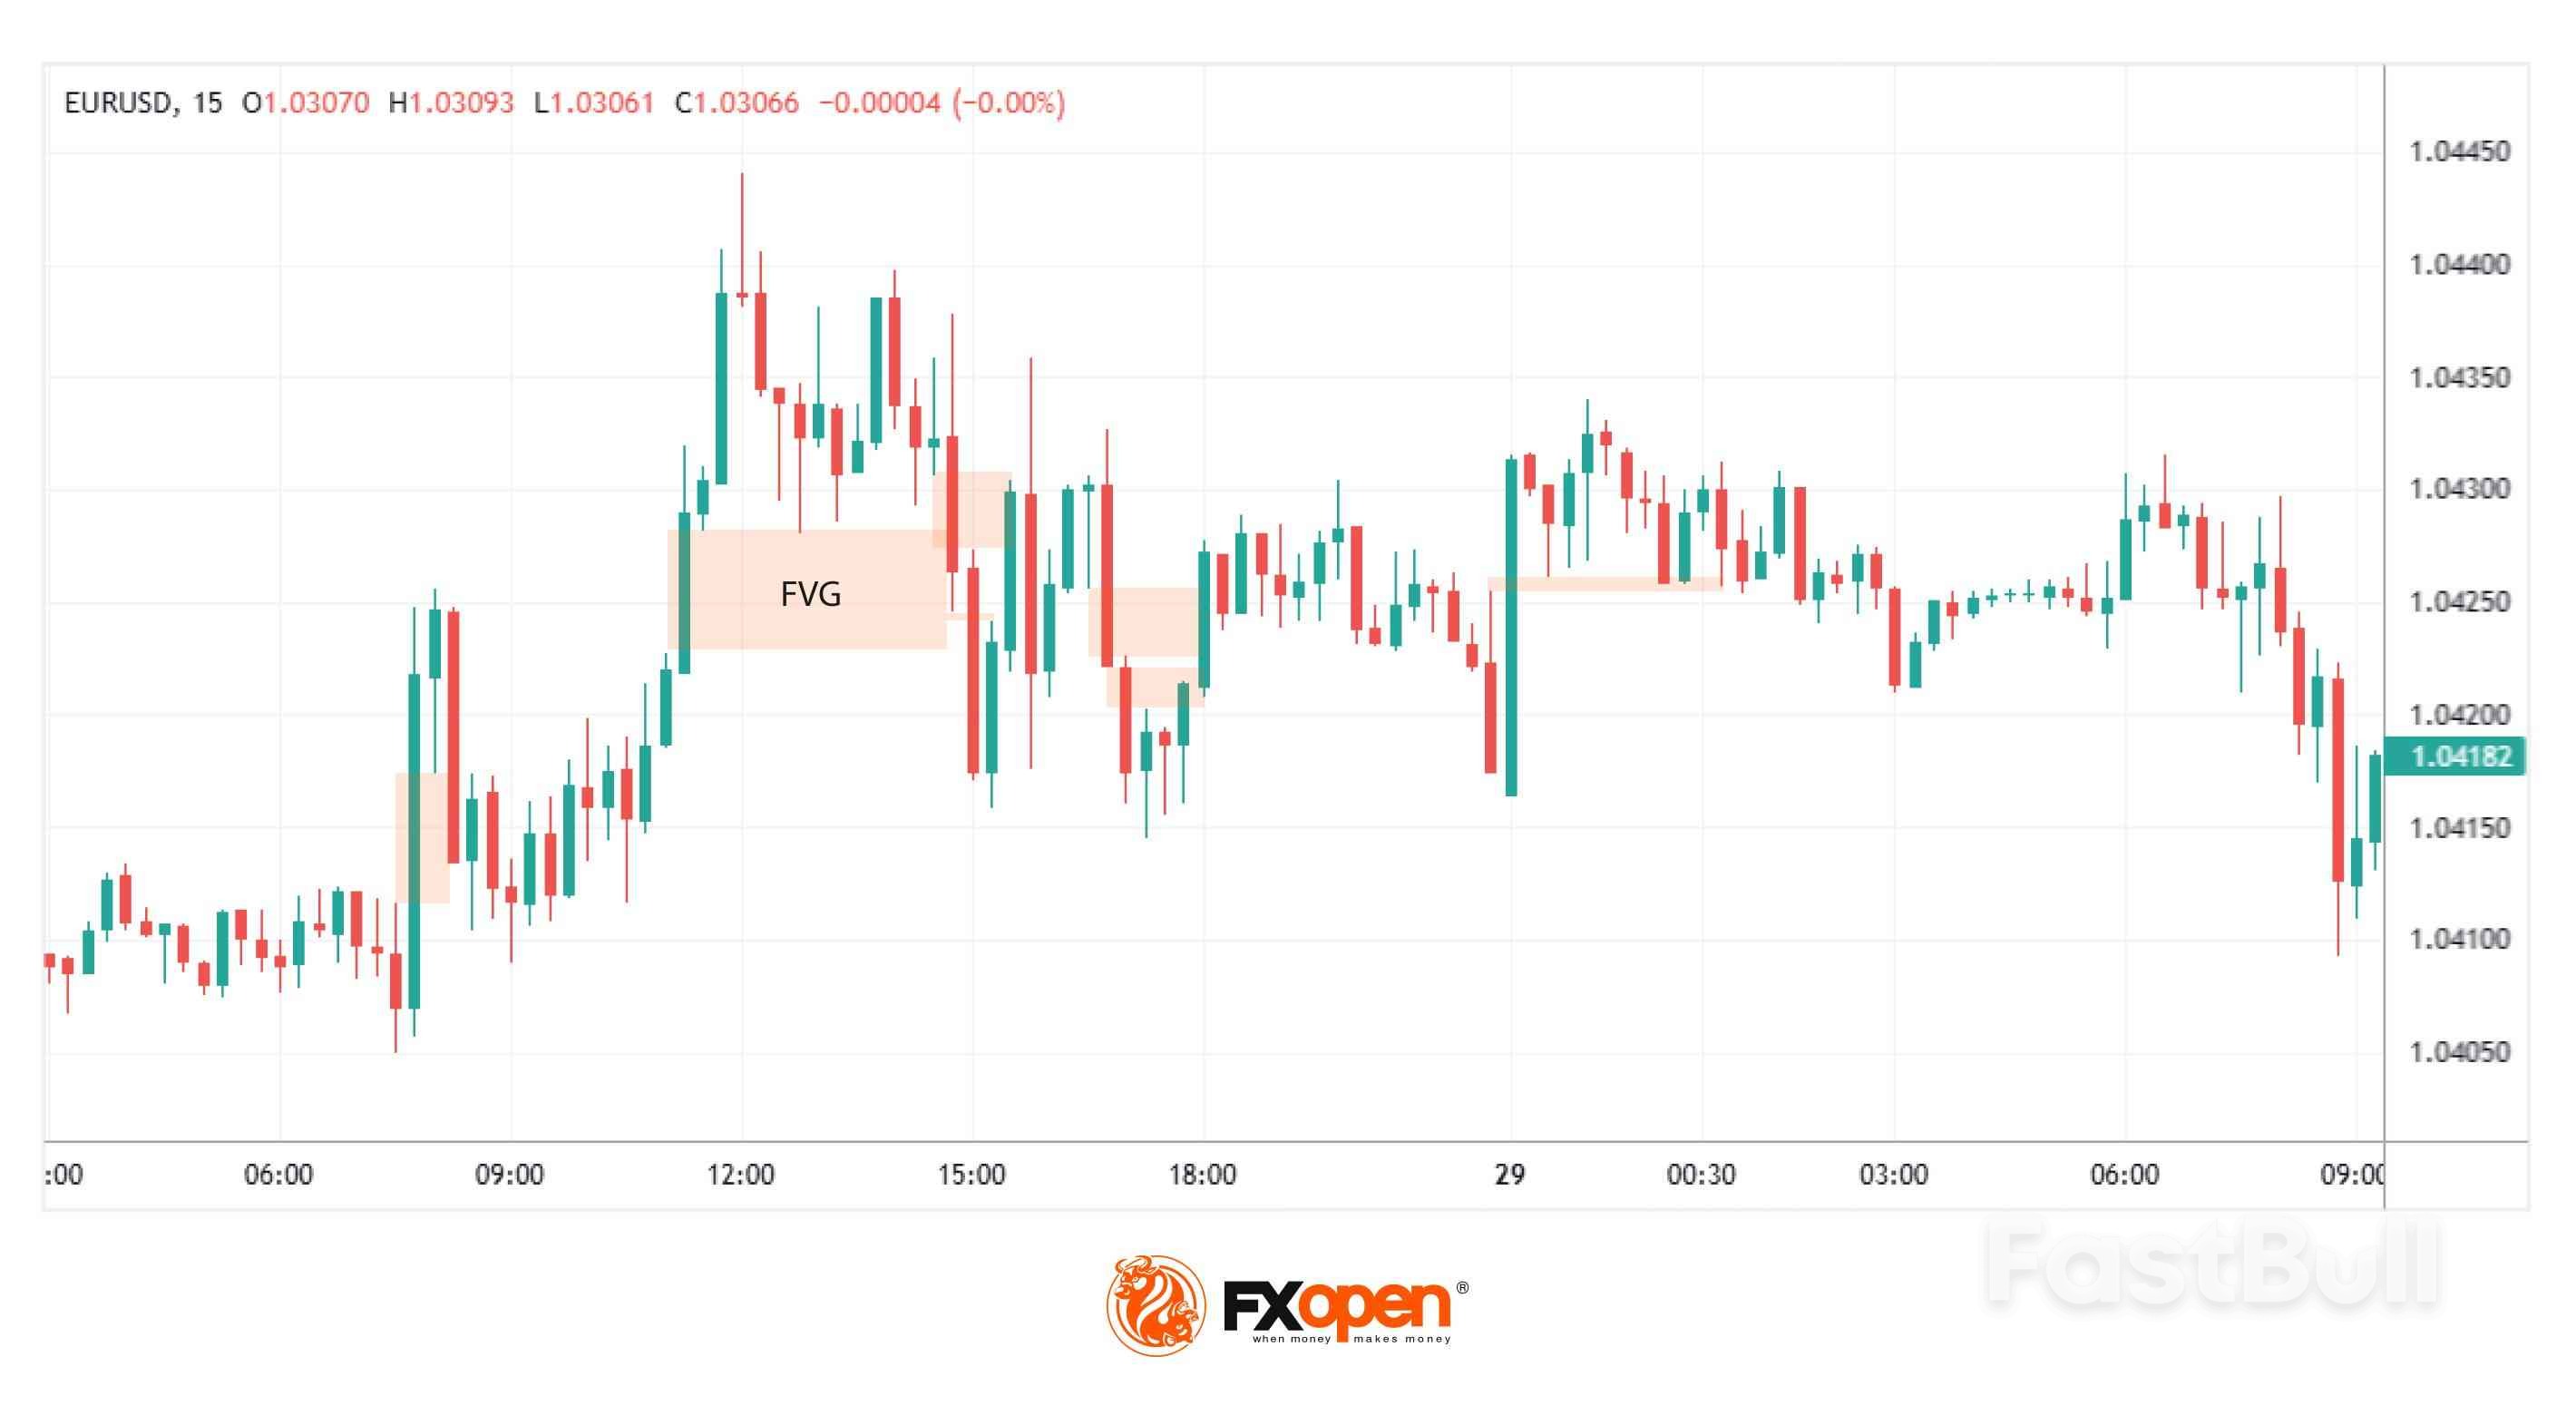
          A Fair Value Gap (FVG) occurs when the market moves so rapidly in one direction that it leaves an imbalance in price action. This imbalance shows up on a chart as a gap between three consecutive candles: the wick of the first candle and the wick of the third candle fail to overlap, leaving a “gap” created by the second candle. It essentially highlights an area where buying or selling pressure was so dominant that the market didn’t trade efficiently.

          Traders view these gaps as areas of potential interest because markets often revisit these levels to "fill" the imbalance. For example, in a bullish FVG, the gap reflects aggressive buying that outpaced selling, potentially creating a future support zone. On the other hand, bearish FVGs indicate overwhelming selling pressure, which might act as resistance later.

          FVGs are closely tied to the concept of fair value. The gap suggests the market may have deviated from a balanced state, making it an area traders watch for signs of price rebalancing. Recognising and understanding these gaps can provide insights into where the price might gravitate in the future, helping traders assess key zones of interest for analysis.

          Understanding Inverse Fair Value Gaps (IFVGs)

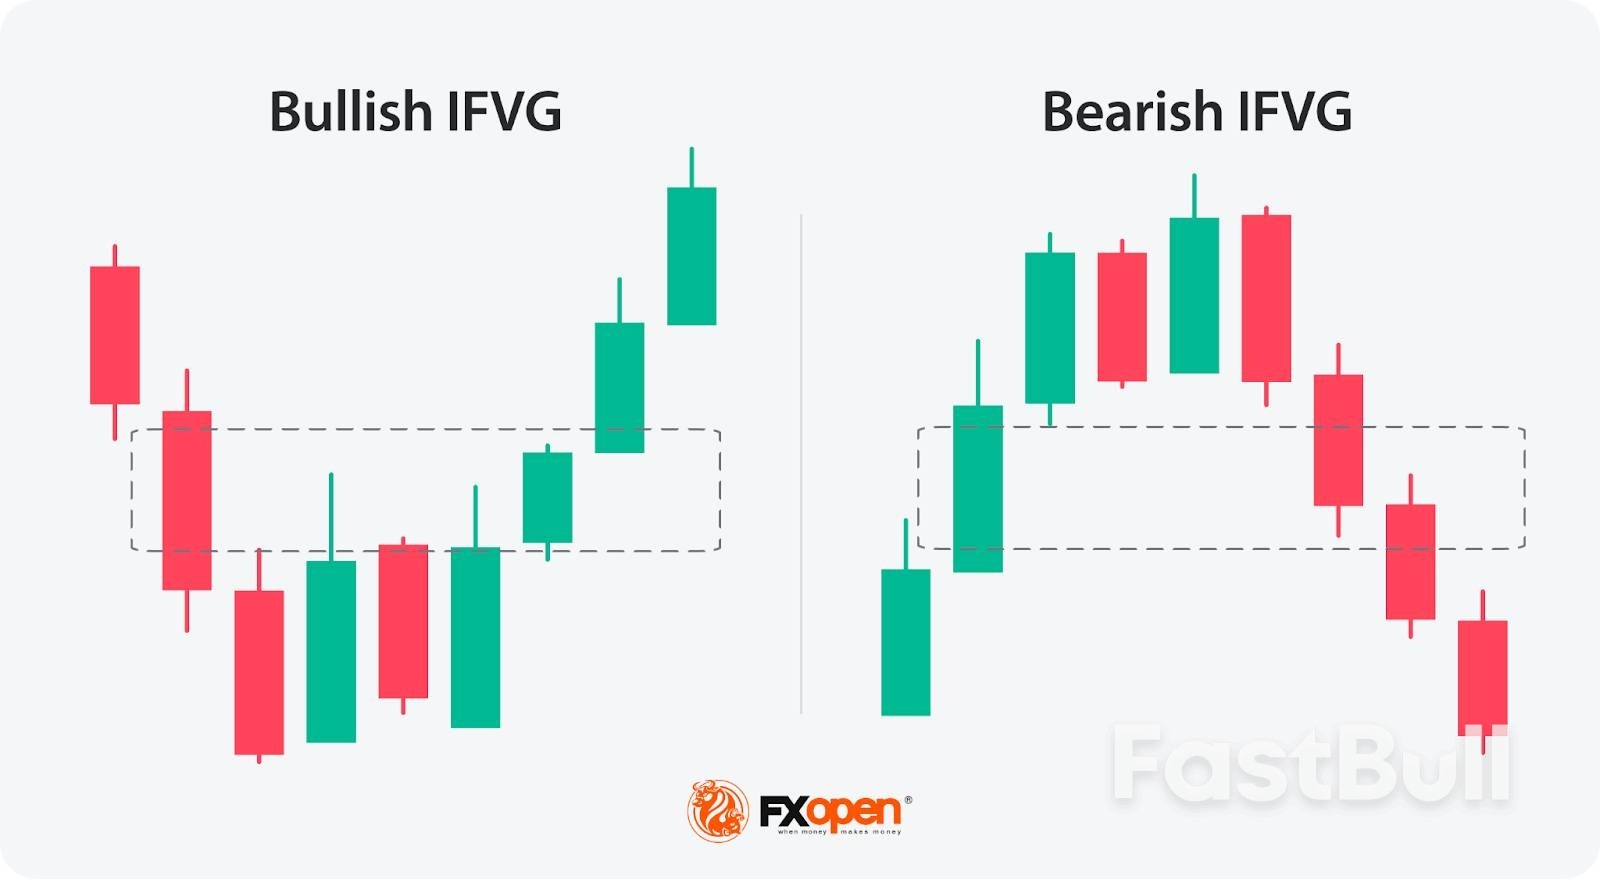
          An Inverse Fair Value Gap (IFVG), or Inversion Fair Value Gap, is an Inner Circle Trader (ICT) concept that builds on the idea of an FVG. While an FVG represents a price imbalance caused by strong directional movement, an IFVG emerges when an existing FVG is invalidated. This invalidation shifts the role of the gap, turning a bearish FVG into a bullish IFVG, or vice versa.

          Here’s how it works: a bearish FVG, for instance, forms when selling pressure dominates, leaving a gap that might act as resistance. However, if the market breaks through this gap—either with a wick or a candle close—it signals that the sellers in that zone have been overwhelmed. The bearish FVG is now invalidated and becomes a bullish IFVG, marking a potential area of support instead. The same applies in reverse for bullish FVGs becoming bearish IFVGs.

          Traders use inverted Fair Value Gaps to identify zones where market sentiment has shifted significantly. For example, when the price revisits a bullish IFVG, it may serve as a zone of interest for traders analysing potential buying opportunities. However, if the price moves past the bottom of the IFVG zone, it’s no longer valid and is typically disregarded.

          What makes these reverse FVGs particularly useful is their ability to highlight moments of structural change in the market. They can act as indicators of strength, revealing areas where price has transitioned from weakness to strength (or vice versa). By integrating IFVG analysis into their broader trading framework, traders can gain deeper insights into the evolving dynamics of supply and demand.

          Want to test your IFVG identification skills? Get started on FXOpen’s free TickTrader trading platform.

          How Traders Use IFVGs in Trading

          By integrating IFVGs into their strategy, traders can refine their decision-making process and uncover potential setups aligned with their broader market outlook. Here’s how IFVGs are commonly used:

          Identifying Key Zones of Interest

          Traders begin by spotting FVGs on price charts—areas where rapid movements create imbalances. An inversion FVG forms when such a gap is invalidated; for instance, a bearish FVG becomes bullish if the price breaks above it. These zones are then marked as potential areas of interest, indicating where the market may experience significant activity.

          Contextualising Market Sentiment

          The formation of an IFVG signals a shift in market sentiment. When a bearish FVG is invalidated and turns into a bullish IFVG, it suggests that selling pressure has diminished and buying interest is gaining momentum. Traders interpret this as a potential reversal point, providing context for the current market dynamics.

          Analysing Price Reactions

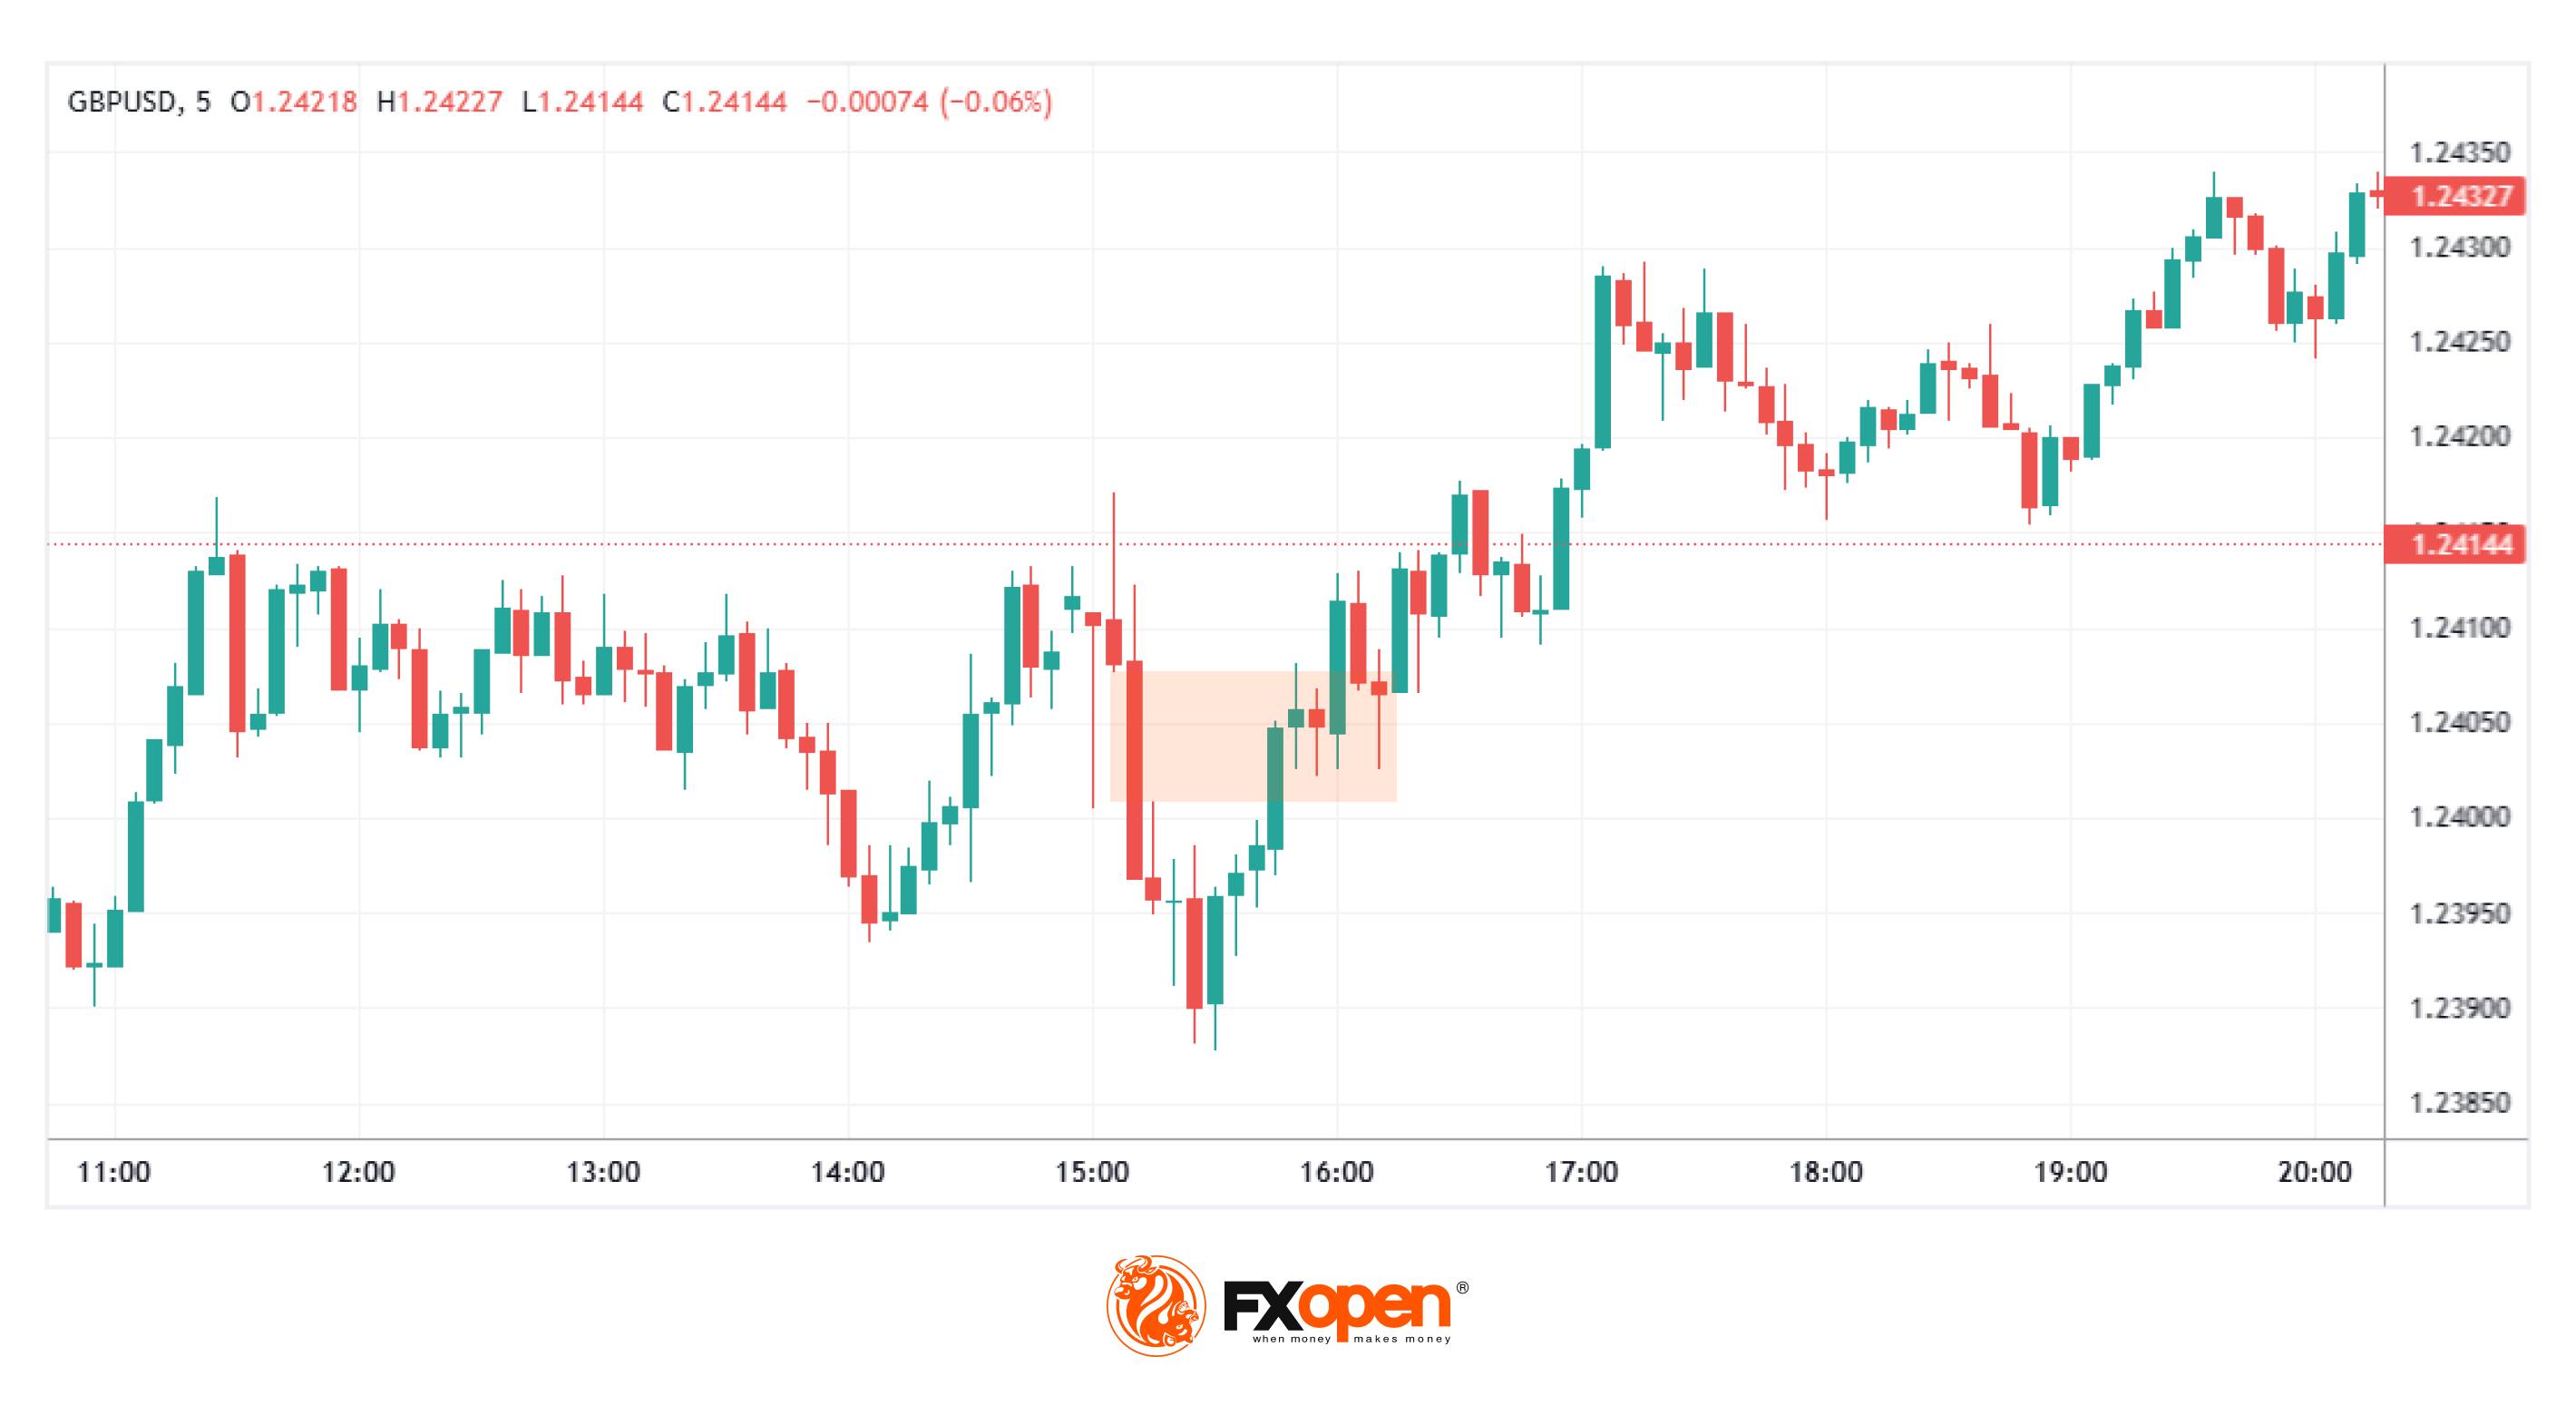
          Once an IFVG is identified, traders monitor how the price interacts with this zone. If the price revisits a bullish IFVG and shows signs of support—such as slowing down its decline or forming bullish candlestick patterns—it may indicate a strengthening upward movement. Conversely, if the price breaches the IFVG without hesitation, the anticipated reversal might not materialise.

          How Can You Trade IFVGs?

          IFVGs provide traders with a structured way to identify and analyse price levels where sentiment has shifted. The process typically looks like this:

          1. Establishing Market Bias

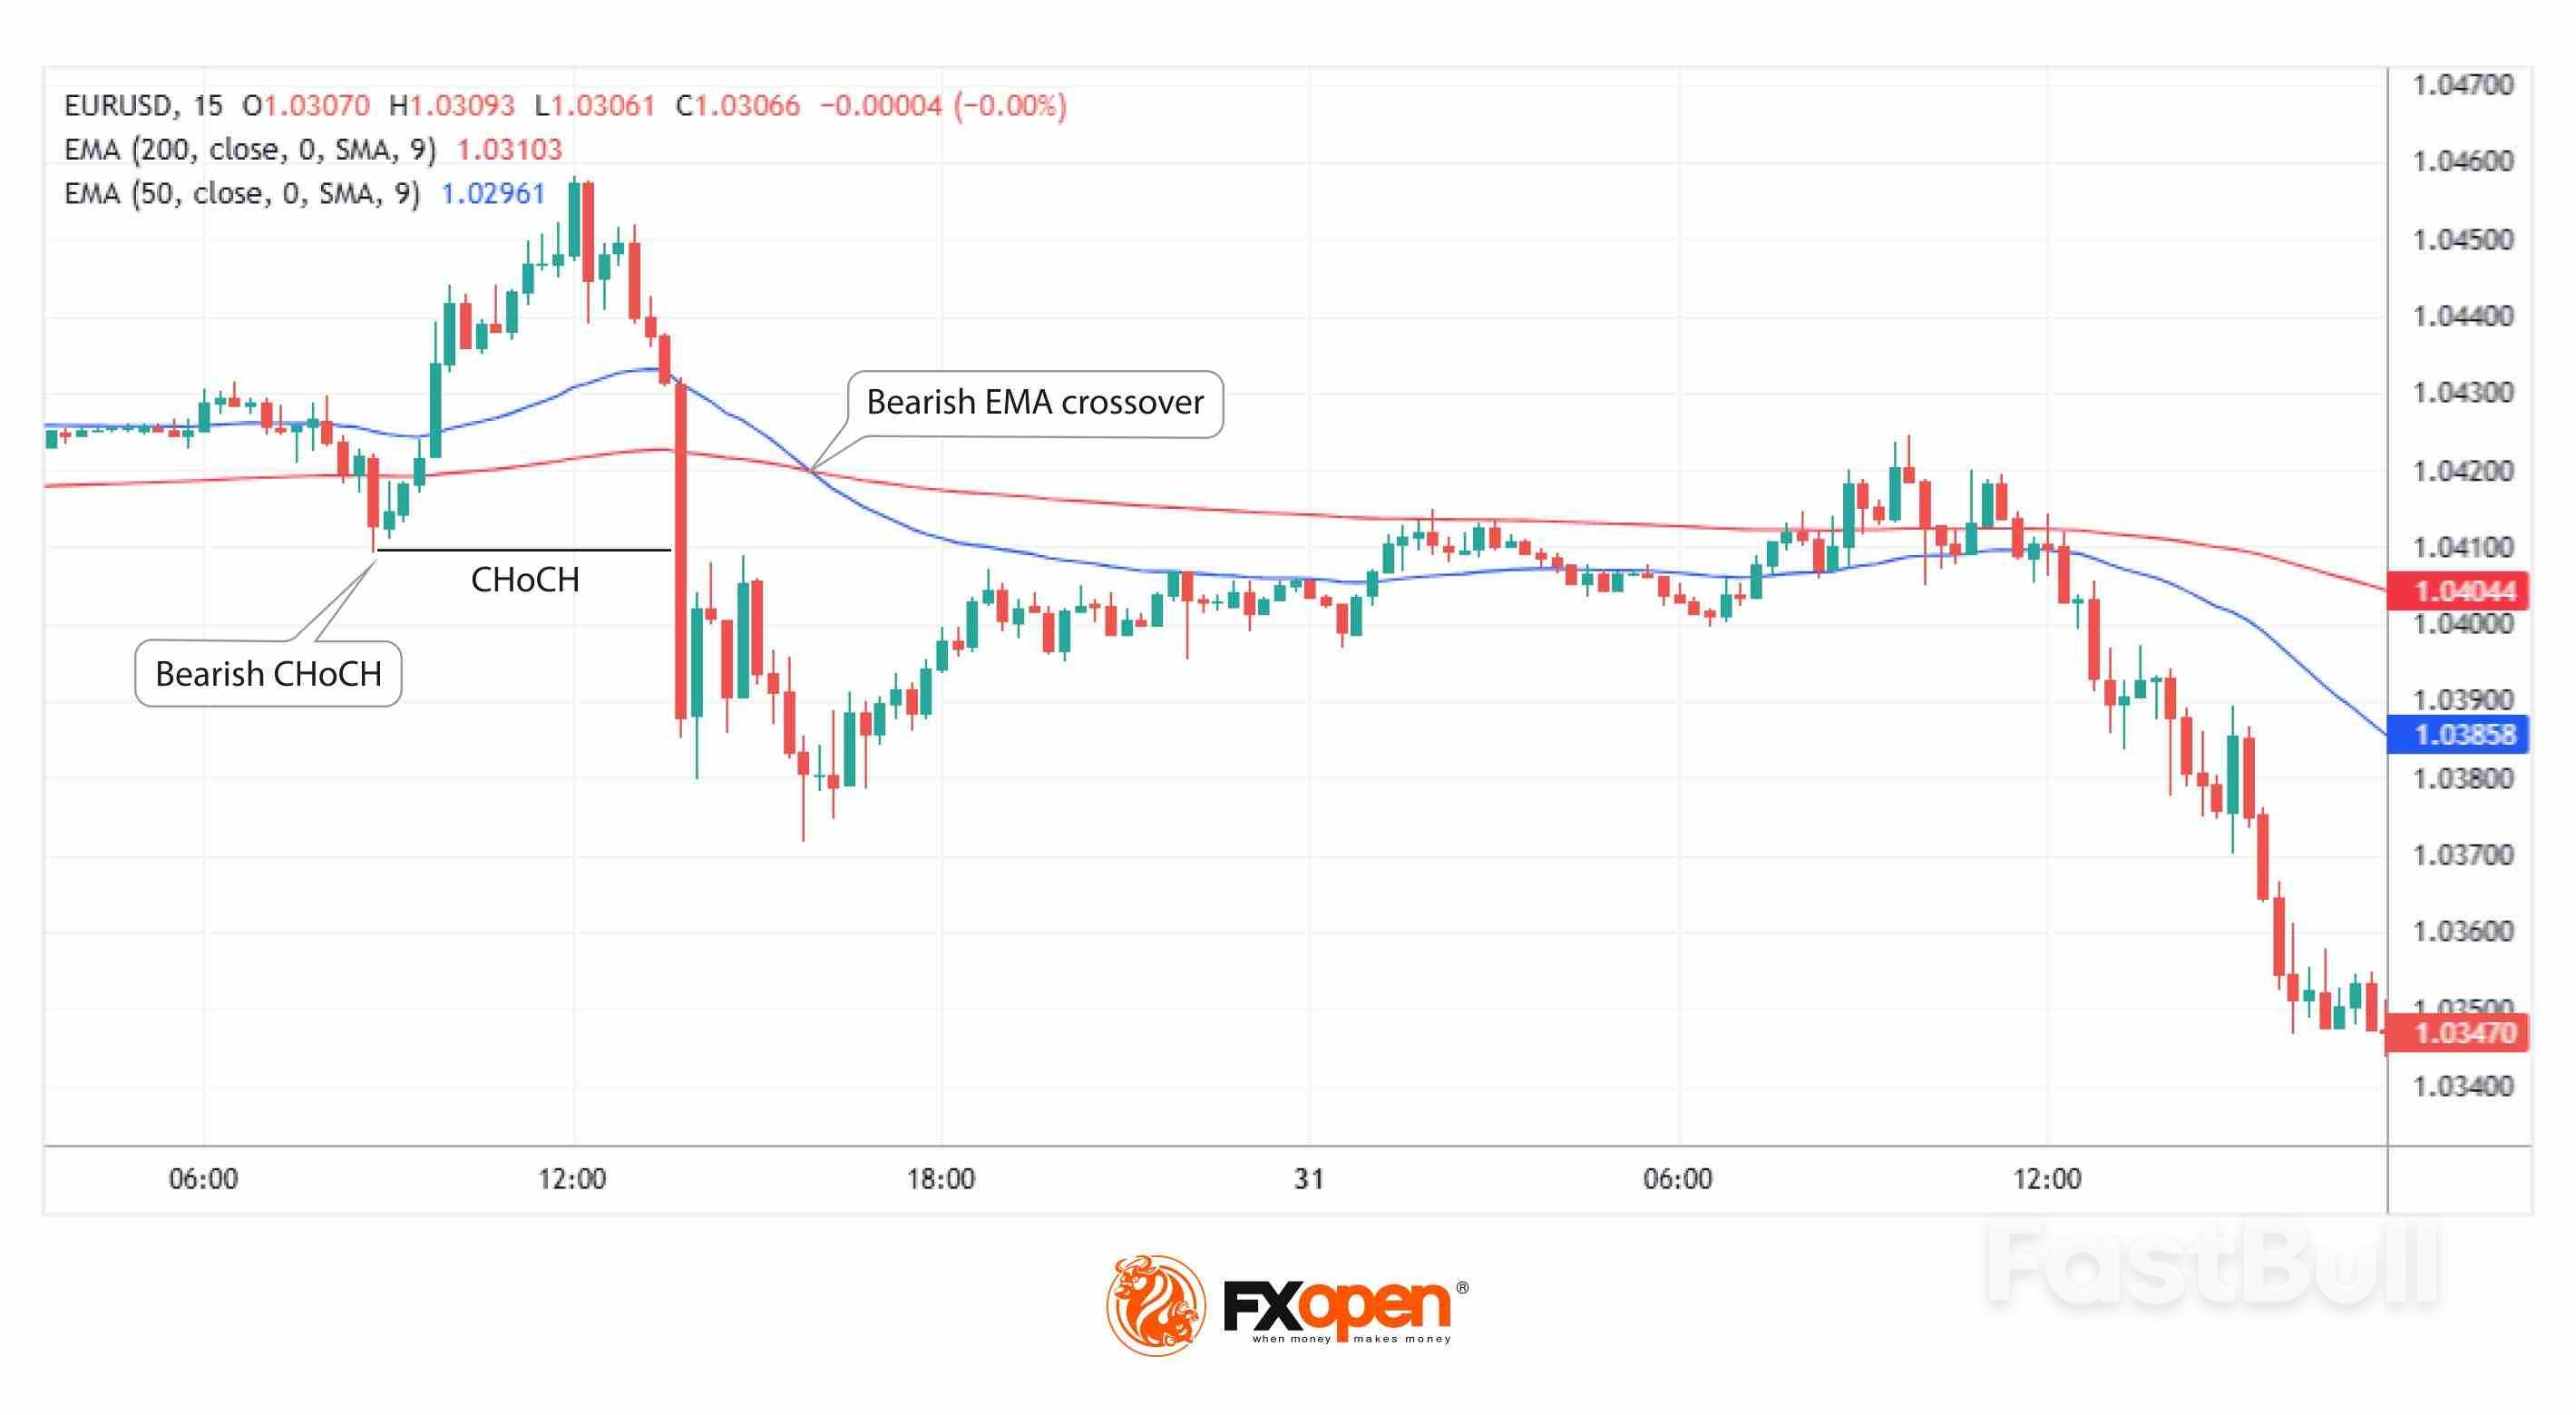
          Traders typically start by analysing the broader market direction. This often involves looking at higher timeframes, such as the daily or 4-hour charts, to identify trends or reversals. Tools like Breaks of Structure (BOS) or Changes of Character (CHoCH) within the ICT framework help clarify whether the market is leaning bullish or bearish.

          Indicators, such as moving averages or momentum oscillators, can also provide additional context for confirming directional bias. A strong bias ensures the trader is aligning setups with the dominant market flow.

          2. Identifying and Using IFVGs

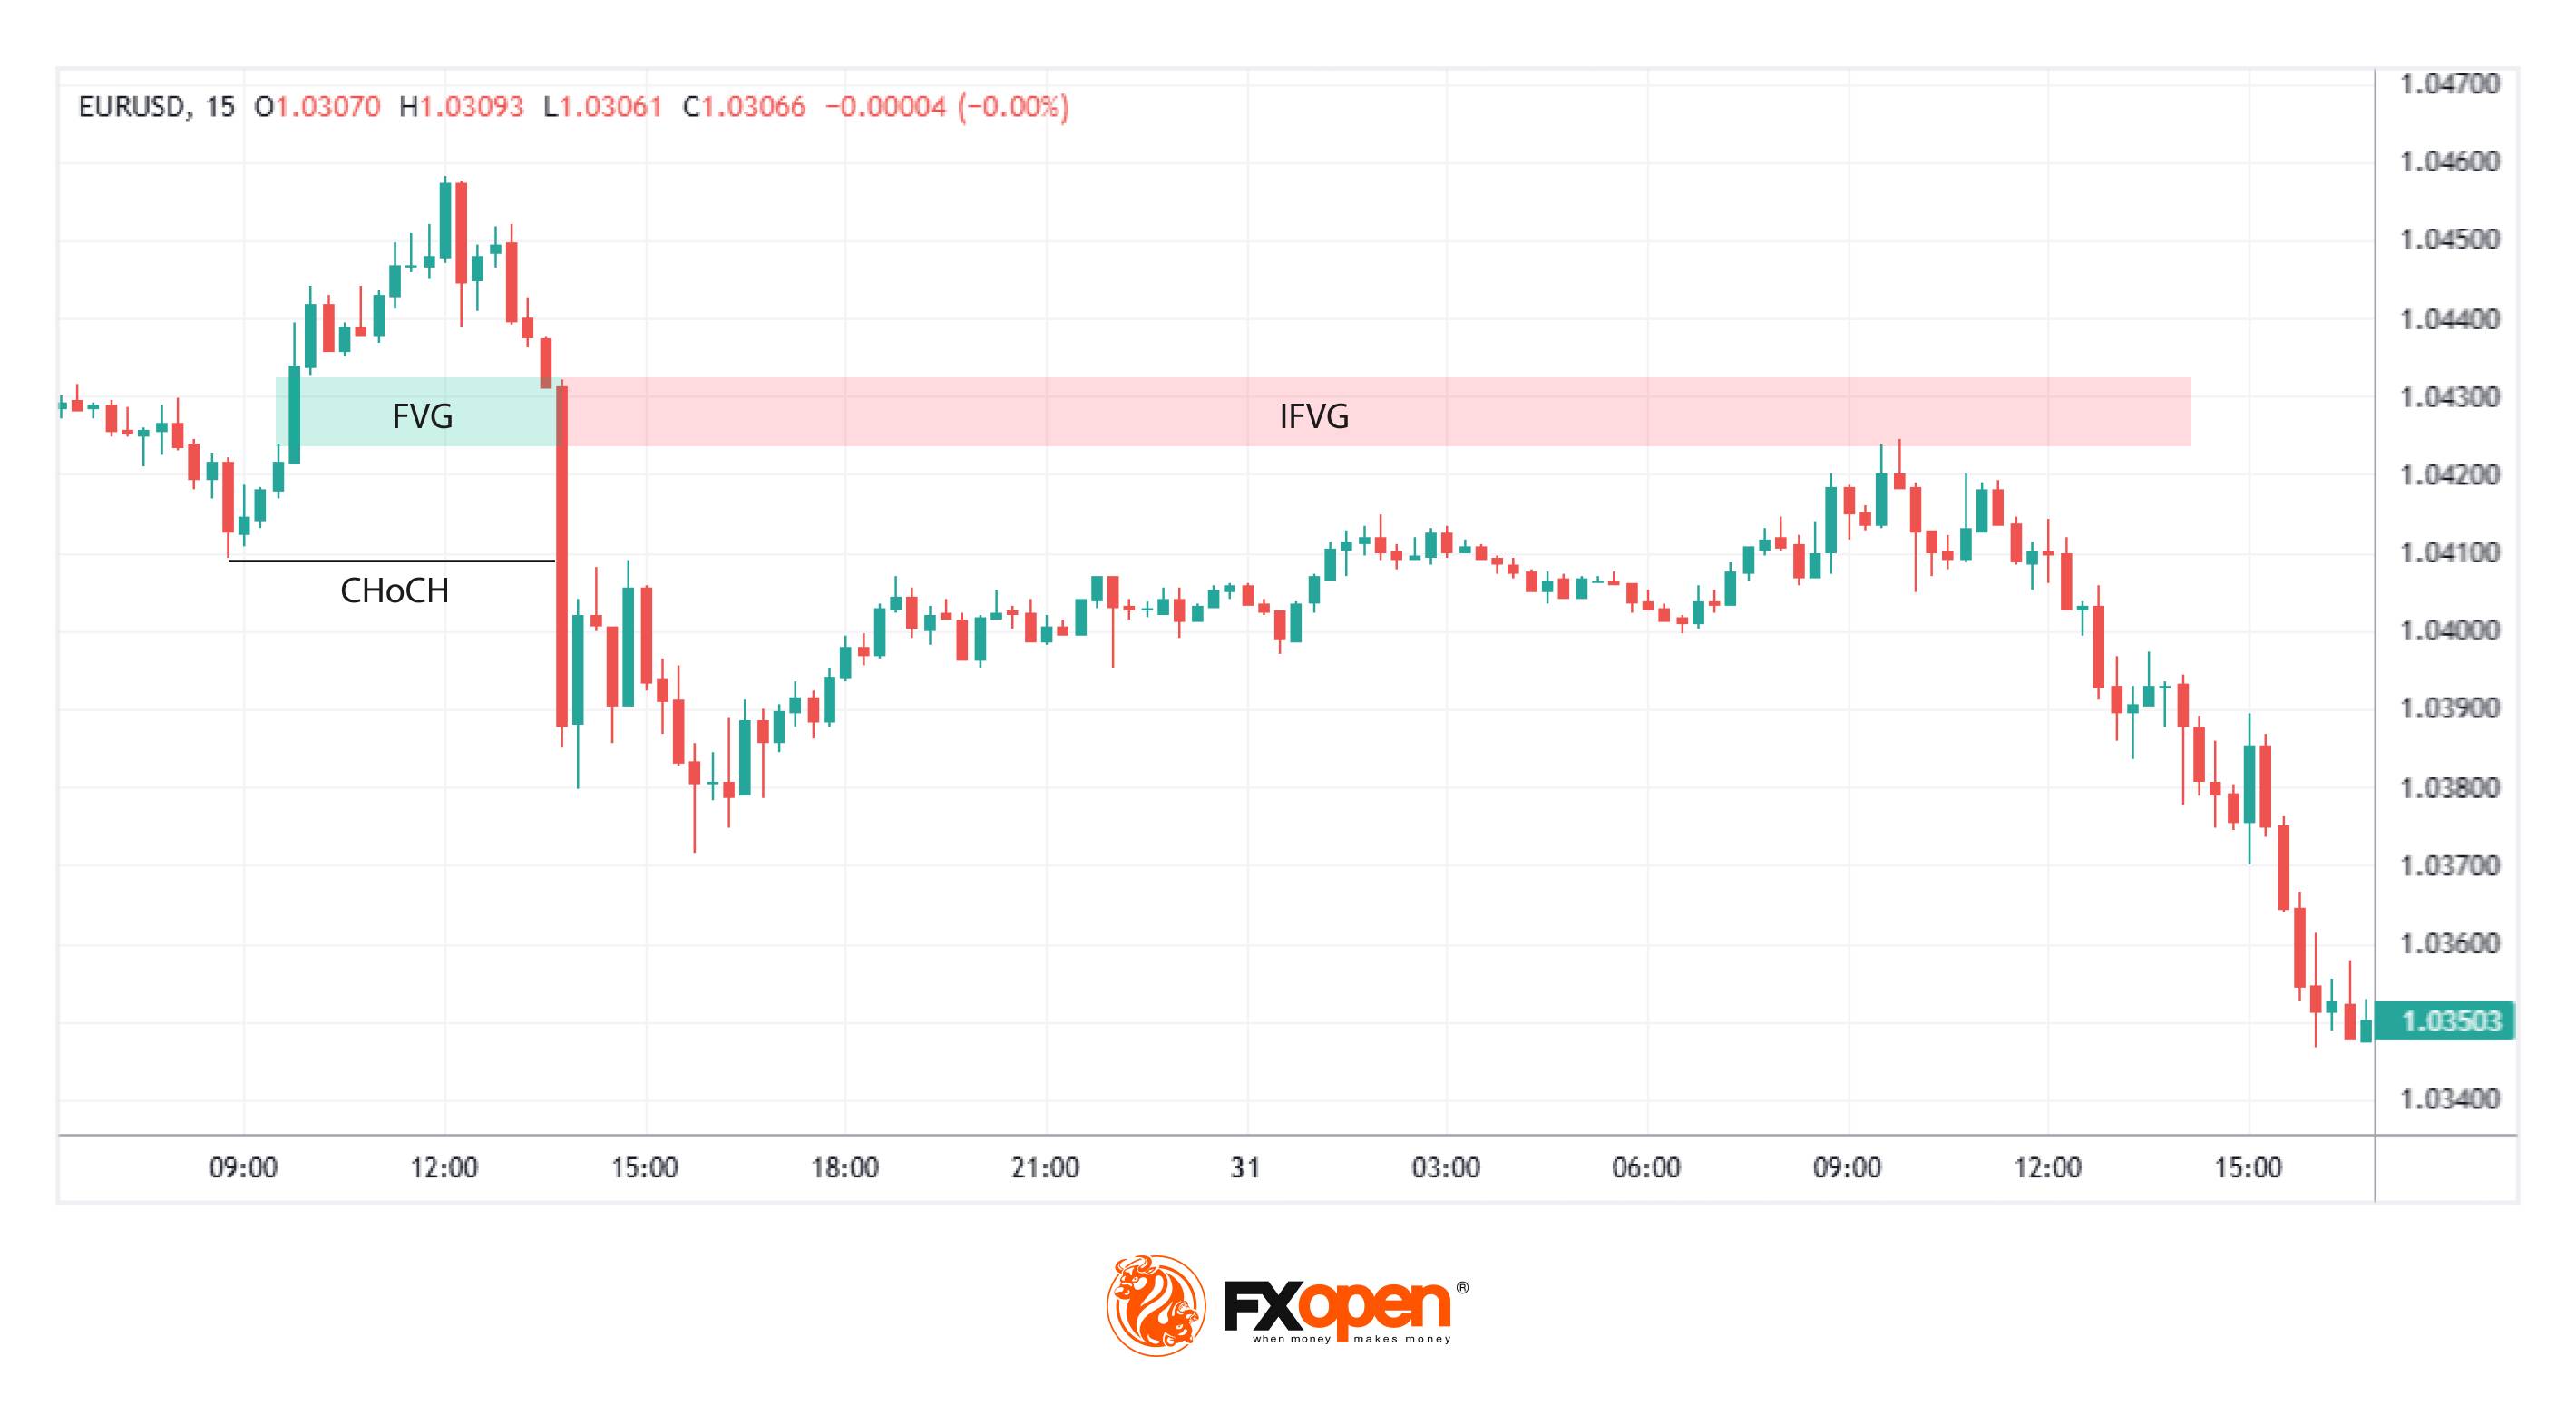
          Once a Fair Value Gap (FVG) is invalidated—indicating a significant shift in sentiment—it transforms into an Inverse Fair Value Gap (IFVG). Traders mark the IFVG zone as a key area of interest. If it aligns with their broader market bias, this zone can serve as a potential entry point. For instance, in a bearish bias, traders may focus on bearish IFVGs that act as potential resistance zones.

          3. Placing Orders and Risk Management

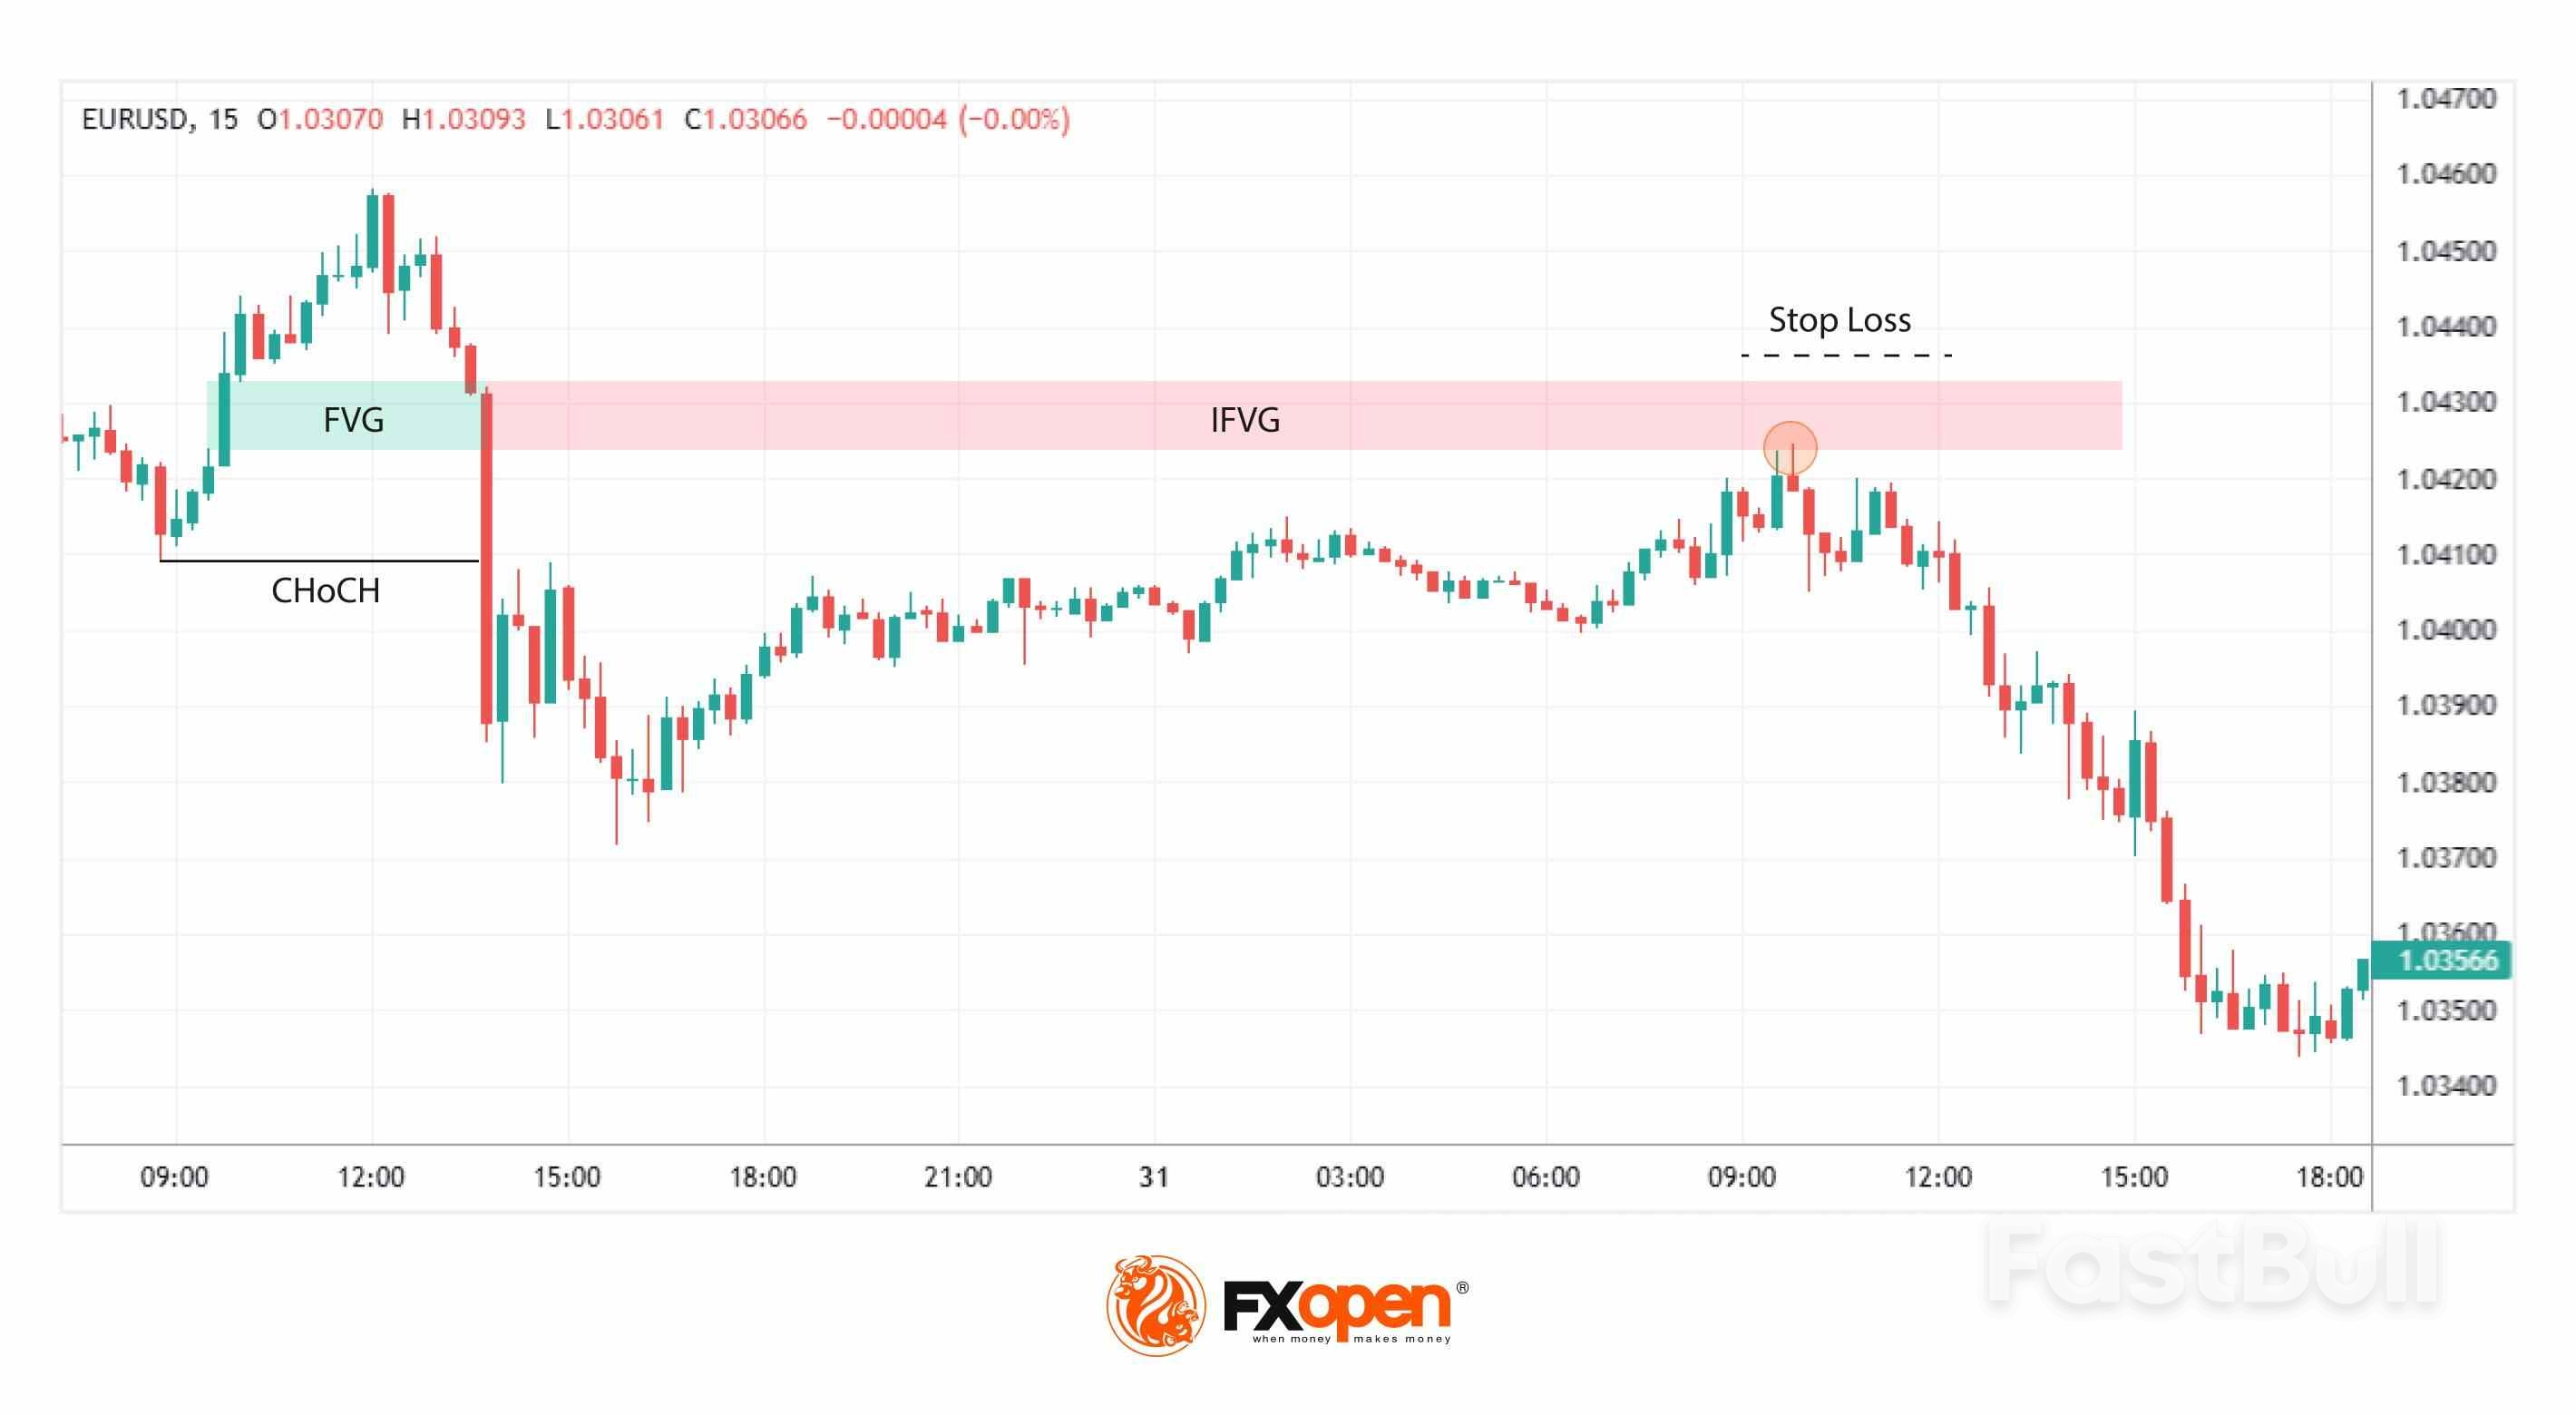
          Traders often set a limit order at the IFVG boundary, anticipating a retracement and for the area to hold. A stop loss is typically placed just beyond the IFVG or a nearby swing high/low to manage risk. For exits, targets might include a predefined risk/reward ratio, such as 1:3, or a significant technical level like an order block or support/resistance area. This approach ensures trades remain structured and grounded in analysis.

          Advantages and Disadvantages of IFVGs

          IFVGs offer traders a unique lens through which to analyse price movements, but like any tool, they come with both strengths and limitations. Understanding these can help traders incorporate IFVGs into their strategies.

          Advantages

          ● Highlight market sentiment shifts: IFVGs pinpoint areas where sentiment has reversed, helping traders identify key turning points.
          ● Refined entry zones: They provide precise areas for potential analysis, reducing guesswork and offering clear levels to watch.
          ● Flexibility across markets: IFVGs can be applied to any market, including forex, commodities, or indices, making them versatile.
          ● Complementary to other tools: They pair well with other ICT tools like BOS, CHoCH, and order blocks for enhanced analysis.

          Disadvantages

          ● Subject to interpretation: Identifying and confirming IFVGs can vary between traders, leading to inconsistencies.
          ● Limited standalone reliability: IFVGs need to be used alongside broader market analysis; relying solely on them increases risk.
          ● Higher timeframe dependence: Their effectiveness can diminish on lower timeframes, where noise often obscures true sentiment shifts.
          ● Potential for invalidation: While IFVGs signal potential opportunities, they aren’t guarantees; price can break through, rendering them ineffective.


          FAQ

          What Is an Inverse Fair Value Gap (IFVG)?

          The IFVG meaning refers to a formation that occurs when a Fair Value Gap (FVG) is invalidated. For example, a bearish FVG becomes bullish after the price breaks above it, creating a potential support zone. Similarly, a bullish FVG can transform into a bearish IFVG if the price breaks below it, creating a potential resistance zone. IFVGs highlight shifts in market sentiment, providing traders with areas of interest for analysing possible reversals or continuation zones.

          What Is the Difference Between a Fair Value Gap and an Inverse Fair Value Gap?

          A Fair Value Gap (FVG) is an imbalance caused by aggressive buying or selling, creating a price gap that may act as support or resistance. An Inverse Fair Value Gap (IFVG) occurs when the original FVG is invalidated—indicating a shift in sentiment—and its role flips. For instance, a bearish FVG invalidated by a price breakout becomes a bullish IFVG.

          What Is the Difference Between BPR and Inverse FVG?

          A Balanced Price Range (BPR) represents the overlap of two opposing Fair Value Gaps (FVGs), creating a sensitive zone for potential price reactions. In contrast, an Inverse Fair Value Gap (IFVG) is a concept based on a single FVG that has been invalidated, flipping its role. While both are useful, BPR reflects the equilibrium between buyers and sellers, whereas IFVG highlights sentiment reversal.

          Source: FXOpen

          Risk Warnings and Disclaimers
          You understand and acknowledge that there is a high degree of risk involved in trading. Following any strategies or investment methods may lead to potential losses. The content on the site is provided by our contributors and analysts for information purposes only. You are solely responsible for determining whether any trading assets, securities, strategy, or any other product is suitable for investing based on your own investment objectives and financial situation.
          Add to Favorites
          Share

          Oil Retreats Slightly After Supply-Driven Rally Amid Russian Sanction Fears

          Gerik

          Economic

          Commodity

          Oil Pauses After Surge, But Geopolitical Risks Keep Rally Alive

          Oil markets eased in early Tuesday trading, cooling slightly after Brent and WTI crude hit their highest levels in over two weeks on Monday. Brent fell by 42 cents to $67.80 per barrel, and WTI slipped 45 cents to $64.35 as of 0754 GMT. This mild correction came after a nearly 2% surge the day prior, driven by mounting concerns over disruptions to Russian oil infrastructure.
          Monday’s price gains were primarily sparked by intensified Ukrainian strikes on Russian energy facilities. These attacks caused substantial damage to Moscow’s refining capacity, disrupted fuel exports, and triggered localized gasoline shortages inside Russia. Analysts noted that this development could mark a turning point in market sentiment if further infrastructure attacks follow.

          Technical Breakout Signals Potential Further Upside

          WTI’s move above its 100-day moving average on Monday added a bullish tone to market dynamics. Analysts at IG pointed out that crude prices appear to be approaching a breakout point, particularly if WTI sustains a close above the $64–$65 resistance range. This level is seen as a critical threshold, where a sustained breach could invite further upside momentum.
          Barclays echoed the cautiously bullish stance in a client note, emphasizing that despite the geopolitical volatility, oil prices remain within a tight band, supported by robust underlying fundamentals and supply-side fears.

          Trump’s Sanction Threats Resurface as Risk Premium Builds

          A major driver of risk premium remains U.S. President Donald Trump’s revived threats to reimpose and expand sanctions on Russian oil unless Moscow engages in meaningful peace negotiations within two weeks. This stance, paired with the possibility of targeting third-party oil buyers, is raising alarm across the energy market.
          India now finds itself in Washington’s crosshairs, as a Department of Homeland Security notice confirmed an additional 25% tariff on Indian-origin goods starting Wednesday. This pushes total U.S. duties on Indian exports to as high as 50% levels usually reserved for strategic economic adversaries.
          With India being a major consumer of Russian oil under discounted terms, the dual threat of sanctions and tariffs could disrupt global trade flows and inject more volatility into oil markets. Indian exporters are already bracing for significant disruptions, which could have knock-on effects on refining demand and oil shipment logistics.
          The next immediate market catalyst will likely come from U.S. inventory data, with the American Petroleum Institute set to release figures later Tuesday. Consensus expectations point to a drawdown in crude and gasoline stocks, but a build-up in distillate inventories. If confirmed by Wednesday’s EIA report, this data could reinforce bullish sentiment and help sustain price gains.
          While oil prices took a breather Tuesday, the fundamental picture remains tight and filled with upside risks. Escalating conflict in Eastern Europe, looming U.S. sanctions, aggressive tariff policies, and shrinking inventories suggest that crude could continue climbing if key resistance levels are cleared. Volatility will remain elevated, and traders are increasingly pricing in geopolitical risk premiums not seen since early 2024.

          Source: Reuters

          To stay updated on all economic events of today, please check out our Economic calendar
          Risk Warnings and Disclaimers
          You understand and acknowledge that there is a high degree of risk involved in trading. Following any strategies or investment methods may lead to potential losses. The content on the site is provided by our contributors and analysts for information purposes only. You are solely responsible for determining whether any trading assets, securities, strategy, or any other product is suitable for investing based on your own investment objectives and financial situation.
          Add to Favorites
          Share

          Indonesia Says US Agrees Tariff Exemption For Its Palm Oil, Cocoa, Rubber

          Olivia Brooks

          Economic

          China–U.S. Trade War

          The United States has agreed in principle to exempt Indonesian exports of cocoa, palm oil and rubber from President Donald Trump's tariff of 19% imposed since August 7, the Southeast Asian nation's chief tariff negotiator said on Tuesday.

          The exemption will take effect once both sides reach a final pact, but no timeline was set as the U.S. was busy in tariff talks with other countries, Airlangga Hartarto, who is also the chief economic minister, told Reuters in an interview.

          Also figuring in tariff talks was discussion of a potential U.S. investment in fuel storage in Indonesia, together with its sovereign wealth fund Danantara and state energy firm Pertamina, Airlangga said.

          "We are waiting for their response, but during the meeting, basically, the principle (exemption) has been agreed for products not produced in the U.S., such as palm oil and cocoa and rubber ... it will be zero or close to zero," he added.

          The region's largest economy was among the first nations to strike a tariff deal with Trump in July, but Jakarta ended up facing the same rate as some other countries, such as Thailand and Malaysia, and just below Vietnam's figure of 20%.

          During the talks, Indonesia offered billions of dollars worth of investment in the United States and purchases of American crude, LPG, planes and farm products. It also promised zero tariffs on almost all American goods entering its market.

          Source: Yahoo Finance

          To stay updated on all economic events of today, please check out our Economic calendar
          Risk Warnings and Disclaimers
          You understand and acknowledge that there is a high degree of risk involved in trading. Following any strategies or investment methods may lead to potential losses. The content on the site is provided by our contributors and analysts for information purposes only. You are solely responsible for determining whether any trading assets, securities, strategy, or any other product is suitable for investing based on your own investment objectives and financial situation.
          Add to Favorites
          Share

          Trump’s Fed Showdown Sends Shockwaves to Japan: Rising Yields, Fiscal Stress Mount

          Gerik

          Economic

          Trump’s Pressure on the Fed Reverberates in Japan’s Bond Market

          The Japanese government bond (JGB) market long known for its stability is now flashing red as U.S. political turmoil spills across borders. On Tuesday, Japan’s 30-year JGB yield surged to match its all-time high of 3.215%, tracking a similar rise in long-dated U.S. Treasury yields after President Donald Trump announced plans to fire Federal Reserve Governor Lisa Cook.
          Trump’s move has intensified fears that the Fed could come under political pressure to tolerate higher inflation in favor of boosting employment. As a result, long-end Treasury yields rose by 5 basis points, while short-term yields fell, signaling a divergence between inflation expectations and policy certainty.

          Contagion Across Markets: JGBs Move in Lockstep with Treasuries

          Japan, as the world’s largest creditor nation, is particularly exposed to shifts in U.S. bond markets. With over $2 trillion in U.S. asset holdings at the end of 2023, Japanese institutional investors rely heavily on predictable U.S. interest rate trends to guide their strategies.
          As U.S. long-term yields rise in response to perceived Fed dovishness, Japanese yields follow suit, threatening Tokyo’s debt sustainability. Japan's public debt exceeds 250% of GDP, the highest among advanced economies, and rising interest costs could derail efforts to stabilize its fiscal position.
          Finance Minister Katsunobu Kato has already indicated that the Ministry of Finance is actively monitoring JGB movements, with Kyodo News reporting that next year’s debt-servicing budget request is projected to top 32 trillion yen a new record. That figure underscores the financial stress caused by even modest upticks in yields.

          Political and Market Headwinds: Domestic and International Forces Combine

          The JGB yield spike is not only a result of U.S. developments. Domestically, the political fallout from the ruling coalition’s defeat in recent upper house elections has injected uncertainty into fiscal policy. Opposition parties are calling for deficit-funded tax cuts, while Prime Minister Shigeru Ishiba’s refusal to resign has delayed supplementary budget talks, compounding investor unease.
          According to Harry Ishikawa, a former advisor to Japan’s Financial Services Agency, the Ministry of Finance will likely be forced to adjust its bond issuance strategy to cap yields. However, market participants such as Shoki Omori of Mizuho Securities argue that investor demand for long-term JGBs is practically nonexistent, and unless confidence is restored, yields will continue to climb.

          Waning Confidence in the Fed’s Independence Fuels Global Instability

          Lisa Cook has contested the legality of her removal, asserting that Trump lacks the authority to fire her. Yet, the mere attempt has undermined confidence in the Federal Reserve’s institutional independence a bedrock of global financial stability. With U.S. inflation expectations rising, and long-end yields surging, fears of a politically compromised Fed are cascading into international markets.
          “The Fed doesn’t look like an independent organization anymore,” Omori warned, reflecting widespread concern that Washington’s politicization of monetary policy could have far-reaching consequences beyond American shores.
          The intersection of U.S. political interference, rising inflation expectations, and Japan’s internal fiscal dilemmas have created a dangerous cocktail for Tokyo’s bond markets. Without a clear resolution in Washington or renewed investor confidence in Japanese debt, yields are likely to remain elevated, complicating the country’s already fragile fiscal management and raising the stakes for coordinated policy action in both capitals.

          Source: Reuters

          To stay updated on all economic events of today, please check out our Economic calendar
          Risk Warnings and Disclaimers
          You understand and acknowledge that there is a high degree of risk involved in trading. Following any strategies or investment methods may lead to potential losses. The content on the site is provided by our contributors and analysts for information purposes only. You are solely responsible for determining whether any trading assets, securities, strategy, or any other product is suitable for investing based on your own investment objectives and financial situation.
          Add to Favorites
          Share

          Swiss Engineering Firms Eye EU Shift Amid Soaring U.S. Tariffs and Strong Franc

          Gerik

          Economic

          Swiss Tech Manufacturers Hit Hard by Tariffs, Strong Franc, and Falling Orders

          Swiss industry leaders are sounding the alarm as U.S. trade policy and currency headwinds force major players in the Swiss mechanical and electrical engineering sector to rethink their global strategy. According to a recent survey conducted by Swissmem, 31% of the industry’s firms plan to relocate portions of their operations to the European Union. This comes in response to the sharp increase in U.S. tariffs and the surge of the Swiss franc.
          Since the U.S. imposed a 39% tariff on Swiss goods on August 7 more than double the 15% rate imposed on neighboring EU countries the Swiss tech sector has come under mounting pressure. At the same time, the Swiss franc has appreciated by approximately 13% against the U.S. dollar since January, further eroding the price competitiveness of Swiss exports.

          Exporters Under Siege: Orders and Output Decline

          The Swiss tech sector, heavily reliant on exports, has already begun to feel the squeeze. Swissmem reported that total goods exports for the first half of 2025 fell 0.9% year-on-year, a seemingly modest decline that masks a much more troubling picture in Q2, when U.S. order volumes plummeted. Orders dropped 13.4% year-on-year in the second quarter alone, largely due to a sharp pullback in U.S. demand after the April tariff threat.
          In the first quarter, Swiss tech exports to the U.S. had surged, but that momentum quickly reversed as firms scrambled to revise contracts and logistics in response to the looming tariff escalation. With demand already softening in Europe and Asia, the sudden evaporation of U.S. appetite for Swiss-made equipment leaves manufacturers exposed.

          Operational Shifts and Job Cuts on the Horizon

          Martin Hirzel, President of Swissmem, did not mince words when addressing the consequences: “Dismissals are inevitable,” he said in Bern. While the precise scale of job losses is still uncertain, Hirzel stressed that political action particularly around lowering the tariff rate is urgently needed to stem deeper economic fallout.
          He added that many Swiss companies are already preparing to streamline operations and shift production closer to the EU, where tariff barriers are lower and demand remains comparatively stable. This geographical repositioning may mitigate cost pressures, but it will also diminish Switzerland’s industrial base unless domestic conditions improve.
          With a strong franc making exports less competitive, U.S. tariffs slashing demand, and only tepid growth in Europe and Asia, Switzerland’s high-value engineering and technology sector finds itself cornered. The move to the EU may offer a lifeline for now, but the longer-term implications for Swiss innovation, employment, and export capacity are more uncertain than ever. Unless diplomatic or macroeconomic shifts occur, the country’s prized export machine may continue to shed capacity and jobs in the quarters ahead.

          Source: Reuters

          To stay updated on all economic events of today, please check out our Economic calendar
          Risk Warnings and Disclaimers
          You understand and acknowledge that there is a high degree of risk involved in trading. Following any strategies or investment methods may lead to potential losses. The content on the site is provided by our contributors and analysts for information purposes only. You are solely responsible for determining whether any trading assets, securities, strategy, or any other product is suitable for investing based on your own investment objectives and financial situation.
          Add to Favorites
          Share

          Trump Asserts U.S. Leverage Over China on Rare-Earth Magnets, Citing Aviation Dominance

          Gerik

          Economic

          Trump Leverages U.S. Aviation Strength Against China’s Rare-Earth Dominance

          In a high-stakes episode of U.S.–China economic diplomacy, President Donald Trump declared Monday that the United States holds “much bigger and better cards” in the ongoing trade tensions with China, asserting that U.S. control over aviation components especially Boeing aircraft parts gives Washington powerful leverage against Beijing’s dominance in rare-earth magnets.
          This statement follows Beijing’s April decision to halt most rare-earth magnet shipments to the U.S., weaponizing its control over roughly 90% of the global supply. Rare-earth magnets, particularly those using neodymium and praseodymium, are vital for electric vehicles, wind turbines, and defense systems. The blockade significantly disrupted American manufacturing but was eased in July as part of a temporary trade truce.

          A Fragile Truce Anchored in Strategic Resources

          The easing of China's rare-earth exports followed resumed talks and a provisional understanding brokered with the Trump administration. Yet, with Chinese negotiators expected to arrive in the U.S. this week, the underlying strategic friction remains. Trump underscored that while Beijing may possess magnet dominance, Washington controls a critical choke point: aviation technology.
          Trump revealed that hundreds of Chinese aircraft were grounded due to a U.S. freeze on Boeing parts, which he later lifted unilaterally “because of the relationship I have” with Chinese President Xi Jinping. He added that he could have continued the hold to pressure China but chose diplomacy over escalation.

          Xi-Trump Meeting on Horizon, But Terms Still in Flux

          Although both sides are “in close communication,” according to Chinese Foreign Ministry spokesperson Guo Jiakun, a high-level meeting between Trump and Xi hinges on a preliminary agreement. APEC's summit in South Korea this October is being floated as a possible venue for any handshake deal, though analysts like Feng Chucheng of Hutong Research warn that business confidence in China cannot recover without a durable resolution with the U.S.
          China’s response has been cautiously optimistic, expressing a desire for steady bilateral ties while reaffirming its resolve to protect sovereignty and strategic interests. Trump, in turn, described his relationship with Xi as “great” and said they spoke “fairly recently,” leaving the door open for diplomacy.

          Tariff Threats Remain Despite Thaw

          Despite the temporary détente, Trump reiterated that tariffs remain the U.S.’s most potent weapon. He floated the possibility of 100%–200% tariffs on Chinese goods if Beijing again restricts magnet supplies, though he added that the current situation seems stable and that China is providing magnets again.
          Trump also hinted that the U.S. is accelerating domestic magnet production. MP Materials Corp. America’s only rare-earth miner is set to begin commercial magnet manufacturing this year with Pentagon backing, but full-scale production will take years.
          The Trump-Xi magnet diplomacy underscores a broader shift in global supply chain politics where trade policy is increasingly wielded as a tool of national security. While the U.S. boasts leverage in aerospace and defense technology, China’s grip on rare-earths remains a potent counterbalance. The outcome of these negotiations may reshape how both nations approach industrial interdependence and economic resilience in the years ahead.

          Source: Bloomberg

          To stay updated on all economic events of today, please check out our Economic calendar
          Risk Warnings and Disclaimers
          You understand and acknowledge that there is a high degree of risk involved in trading. Following any strategies or investment methods may lead to potential losses. The content on the site is provided by our contributors and analysts for information purposes only. You are solely responsible for determining whether any trading assets, securities, strategy, or any other product is suitable for investing based on your own investment objectives and financial situation.
          Add to Favorites
          Share

          Trump’s 50% Tariff Blow to India Escalates Over Russia Ties Amid Stalled Peace Talks

          Gerik

          Economic

          Washington Escalates Trade Pressure on India Over Russian Oil Imports

          In a significant escalation of trade tensions, the Trump administration announced it will enforce a 50% tariff on Indian imports effective August 27, 2025. The move, unveiled in a draft notice by the Department of Homeland Security, targets goods “entered for consumption” from India, doubling the existing 25% rate. This development follows India’s continued purchase of discounted Russian oil despite U.S. demands to scale back energy ties with Moscow.
          The punitive action signals Washington’s frustration over stalled negotiations between Russia and Ukraine. President Trump has openly linked the tariff decision to India's oil diplomacy with Russia, asserting that the economic measure is intended to coerce Russian President Vladimir Putin into peace talks.

          New Delhi Pushes Back But Shows Limited Concessions

          India's government, led by Prime Minister Narendra Modi, has criticized the secondary tariffs as unfair and emphasized its sovereign right to pursue strategic energy partnerships. While India’s refiners may marginally cut Russian oil imports in the short term, Modi's administration has refused to sever ties with Moscow, instead deepening diplomatic outreach with both Russia and China.
          Foreign Minister Subrahmanyam Jaishankar clarified that no direct discussions on energy trade have occurred between India and the Trump administration since January. Moreover, he reaffirmed India’s hardline stance on protecting its domestic agriculture sector, rejecting U.S. demands for greater market access for American farm goods.
          In response to the anticipated economic fallout, the Indian government is accelerating domestic policy reforms, including overhauling its goods and services tax (GST) framework to support consumption and stimulate investor confidence.

          Equity Markets React as Uncertainty Rises

          The announcement triggered immediate market jitters. The NSE Nifty 50 Index fell by up to 0.9% during early trading Tuesday, underperforming regional peers. The tariffs cast a shadow over India’s broader emerging-market attractiveness, particularly as the country tries to project itself as a rising industrial and digital economy.
          Trump’s unsuccessful attempts to convene direct talks between Putin and Ukraine’s President Zelenskiy have stalled progress on any peace roadmap. The Alaska and Washington summits failed to bridge diplomatic divides, with Trump blaming Putin’s animosity for the impasse. The president warned that failure to reach a peace deal could lead to additional tariffs or sanctions on other nations engaging in Russian trade though China, a major buyer of Russian crude, remains untouched for now.
          As the U.S. continues using tariffs as a foreign policy lever, its evolving strategy risks reshaping alliances, supply chains, and investor sentiment across Asia. India’s resistance to pressure and its balancing act between East and West may define the trajectory of U.S.-India relations heading into 2026.

          Source: Bloomberg

          To stay updated on all economic events of today, please check out our Economic calendar
          Risk Warnings and Disclaimers
          You understand and acknowledge that there is a high degree of risk involved in trading. Following any strategies or investment methods may lead to potential losses. The content on the site is provided by our contributors and analysts for information purposes only. You are solely responsible for determining whether any trading assets, securities, strategy, or any other product is suitable for investing based on your own investment objectives and financial situation.
          Add to Favorites
          Share
          FastBull
          Copyright © 2025 FastBull Ltd

          728 RM B 7/F GEE LOK IND BLDG NO 34 HUNG TO RD KWUN TONG KLN HONG KONG

          TelegramInstagramTwitterfacebooklinkedin
          App Store Google Play Google Play
          Products
          Charts

          Chats

          Q&A with Experts
          Screeners
          Economic Calendar
          Data
          Tools
          Membership
          Features
          Function
          Markets
          Copy Trading
          Latest Signals
          Contests
          News
          Analysis
          24/7
          Columns
          Education
          Company
          Careers
          About Us
          Contact Us
          Advertising
          Help Center
          Feedback
          User Agreement
          Privacy Policy
          Business

          White Label

          Data API

          Web Plug-ins

          Poster Maker

          Affiliate Program

          Risk Disclosure

          The risk of loss in trading financial instruments such as stocks, FX, commodities, futures, bonds, ETFs and crypto can be substantial. You may sustain a total loss of the funds that you deposit with your broker. Therefore, you should carefully consider whether such trading is suitable for you in light of your circumstances and financial resources.

          No decision to invest should be made without thoroughly conducting due diligence by yourself or consulting with your financial advisors. Our web content might not suit you since we don't know your financial conditions and investment needs. Our financial information might have latency or contain inaccuracy, so you should be fully responsible for any of your trading and investment decisions. The company will not be responsible for your capital loss.

          Without getting permission from the website, you are not allowed to copy the website's graphics, texts, or trademarks. Intellectual property rights in the content or data incorporated into this website belong to its providers and exchange merchants.

          Not Logged In

          Log in to access more features

          FastBull Membership

          Not yet

          Purchase

          Become a signal provider
          Help Center
          Customer Service
          Dark Mode
          Price Up/Down Colors

          Log In

          Sign Up

          Position
          Layout
          Fullscreen
          Default to Chart
          The chart page opens by default when you visit fastbull.com