Markets
News
Analysis
User
24/7
Economic Calendar
Education
Data
- Names
- Latest
- Prev


Signal Accounts for Members
All Signal Accounts
All Contests


Euro Zone IHS Markit Construction PMI (Nov)A:--
F: --
P: --
Italy IHS Markit Construction PMI (Nov)A:--
F: --
P: --
U.K. Markit/CIPS Construction PMI (Nov)A:--
F: --
P: --
France 10-Year OAT Auction Avg. YieldA:--
F: --
P: --
Euro Zone Retail Sales MoM (Oct)A:--
F: --
P: --
Euro Zone Retail Sales YoY (Oct)A:--
F: --
P: --
Brazil GDP YoY (Q3)A:--
F: --
P: --
U.S. Challenger Job Cuts (Nov)A:--
F: --
P: --
U.S. Challenger Job Cuts MoM (Nov)A:--
F: --
P: --
U.S. Challenger Job Cuts YoY (Nov)A:--
F: --
P: --
U.S. Initial Jobless Claims 4-Week Avg. (SA)A:--
F: --
P: --
U.S. Weekly Initial Jobless Claims (SA)A:--
F: --
P: --
U.S. Weekly Continued Jobless Claims (SA)A:--
F: --
P: --
Canada Ivey PMI (SA) (Nov)A:--
F: --
P: --
Canada Ivey PMI (Not SA) (Nov)A:--
F: --
P: --
U.S. Non-Defense Capital Durable Goods Orders Revised MoM (Excl. Aircraft) (SA) (Sept)A:--
F: --
U.S. Factory Orders MoM (Excl. Transport) (Sept)A:--
F: --
P: --
U.S. Factory Orders MoM (Sept)A:--
F: --
P: --
U.S. Factory Orders MoM (Excl. Defense) (Sept)A:--
F: --
P: --
U.S. EIA Weekly Natural Gas Stocks ChangeA:--
F: --
P: --
Saudi Arabia Crude Oil ProductionA:--
F: --
P: --
U.S. Weekly Treasuries Held by Foreign Central BanksA:--
F: --
P: --
Japan Foreign Exchange Reserves (Nov)A:--
F: --
P: --
India Repo RateA:--
F: --
P: --
India Benchmark Interest RateA:--
F: --
P: --
India Reverse Repo RateA:--
F: --
P: --
India Cash Reserve RatioA:--
F: --
P: --
Japan Leading Indicators Prelim (Oct)A:--
F: --
P: --
U.K. Halifax House Price Index YoY (SA) (Nov)A:--
F: --
P: --
U.K. Halifax House Price Index MoM (SA) (Nov)A:--
F: --
P: --
France Current Account (Not SA) (Oct)--
F: --
P: --
France Trade Balance (SA) (Oct)--
F: --
P: --
France Industrial Output MoM (SA) (Oct)--
F: --
P: --
Italy Retail Sales MoM (SA) (Oct)--
F: --
P: --
Euro Zone Employment YoY (SA) (Q3)--
F: --
P: --
Euro Zone GDP Final YoY (Q3)--
F: --
P: --
Euro Zone GDP Final QoQ (Q3)--
F: --
P: --
Euro Zone Employment Final QoQ (SA) (Q3)--
F: --
P: --
Euro Zone Employment Final (SA) (Q3)--
F: --
Brazil PPI MoM (Oct)--
F: --
P: --
Mexico Consumer Confidence Index (Nov)--
F: --
P: --
Canada Unemployment Rate (SA) (Nov)--
F: --
P: --
Canada Labor Force Participation Rate (SA) (Nov)--
F: --
P: --
Canada Employment (SA) (Nov)--
F: --
P: --
Canada Part-Time Employment (SA) (Nov)--
F: --
P: --
Canada Full-time Employment (SA) (Nov)--
F: --
P: --
U.S. Personal Income MoM (Sept)--
F: --
P: --
U.S. Dallas Fed PCE Price Index YoY (Sept)--
F: --
P: --
U.S. PCE Price Index YoY (SA) (Sept)--
F: --
P: --
U.S. PCE Price Index MoM (Sept)--
F: --
P: --
U.S. Personal Outlays MoM (SA) (Sept)--
F: --
P: --
U.S. Core PCE Price Index MoM (Sept)--
F: --
P: --
U.S. UMich 5-Year-Ahead Inflation Expectations Prelim YoY (Dec)--
F: --
P: --
U.S. Core PCE Price Index YoY (Sept)--
F: --
P: --
U.S. Real Personal Consumption Expenditures MoM (Sept)--
F: --
P: --
U.S. 5-10 Year-Ahead Inflation Expectations (Dec)--
F: --
P: --
U.S. UMich Current Economic Conditions Index Prelim (Dec)--
F: --
P: --
U.S. UMich Consumer Sentiment Index Prelim (Dec)--
F: --
P: --
U.S. UMich 1-Year-Ahead Inflation Expectations Prelim (Dec)--
F: --
P: --
U.S. UMich Consumer Expectations Index Prelim (Dec)--
F: --
P: --


No matching data
Latest Views
Latest Views
Trending Topics
Top Columnists
Latest Update
White Label
Data API
Web Plug-ins
Affiliate Program
View All

No data
US and China agree to lower tariffs for 90 days as tensions take toll.But what are the prospects for a permanent deal?Markets are unsure if this is a true turning point.
The trade war between the United States and the rest of the world reached a boiling point in April after President Trump unveiled reciprocal tariffs that were far greater than what anyone was expecting and as he flagged a new round of sectoral tariffs. The response by other countries varied, with many, like Australia, Japan and the United Kingdom, deciding not to retaliate. But others, such as the European Union and China, have not held back in responding with some counter measures.
China’s response has been the most aggressive, likely taking the White House by surprise. As expected, though, the tit-for-tat retaliation only infuriated Trump, escalating into a full-blown trade conflict. Prior to the weekend talks between US and Chinese officials aimed at diffusing the situation, Chinese businesses were staring at a staggering 145% tax on their exports to the US, while American imports were being charged a somewhat lower 125% rate.
All this suggests that a truce was inevitable. Reports on who initiated the talks vary, depending on the source. But most likely, both sides were seeking an urgent de-escalation, as such punitive tariffs can only be harmful to the world’s two largest economies. Hopes were high heading into the weekend meetings in Switzerland as Trump had hinted that he was willing to lower tariffs on China to 80%.
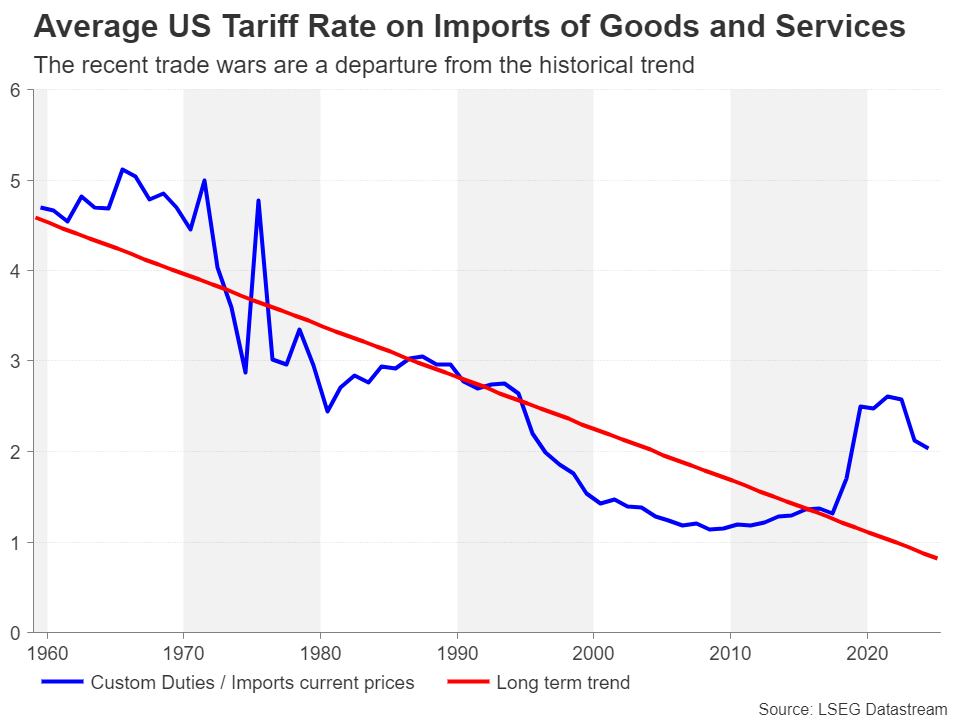
In a huge relief for investors, the outcome was far better than expected, as both sides agreed to slash each other’s tariffs by 115%, bringing the rate on Chinese imports to 30% and the rate on US goods entering China to 10%. Not forgetting the sectoral tariffs on steel and cars, this leaves the average level of levies between the two countries still above what it was prior to the start of the trade war in February.
More concerning for investors and other decision makers, especially business leaders and central bank policymakers, is that the temporary reprieve does little in removing the uncertainty. Reaching an initial trade deal was probably the easy part. Agreeing on a comprehensive trade pact that resolves differences on key areas such as intellectual property rights, the illegal flow of fentanyl and US access to Chinese markets will be much more difficult.
This leaves markets exposed and vulnerable to any potential setbacks during the 90-day pause, while failure to reach a more permanent agreement risks reviving fears about a US and global recession.
The easing trade tensions have helped the US dollar recover significant lost ground. The dollar index surged towards its 50-day moving average (MA) the day after the Sino-US deal was announced, extending its rebound from April’s three-year low of 97.92 to more than 4%. However, the 50-day MA has proven to be a tough obstacle to overcome, and the greenback has since retreated somewhat, casting doubt about its outlook even if trade frictions continue to de-escalate.
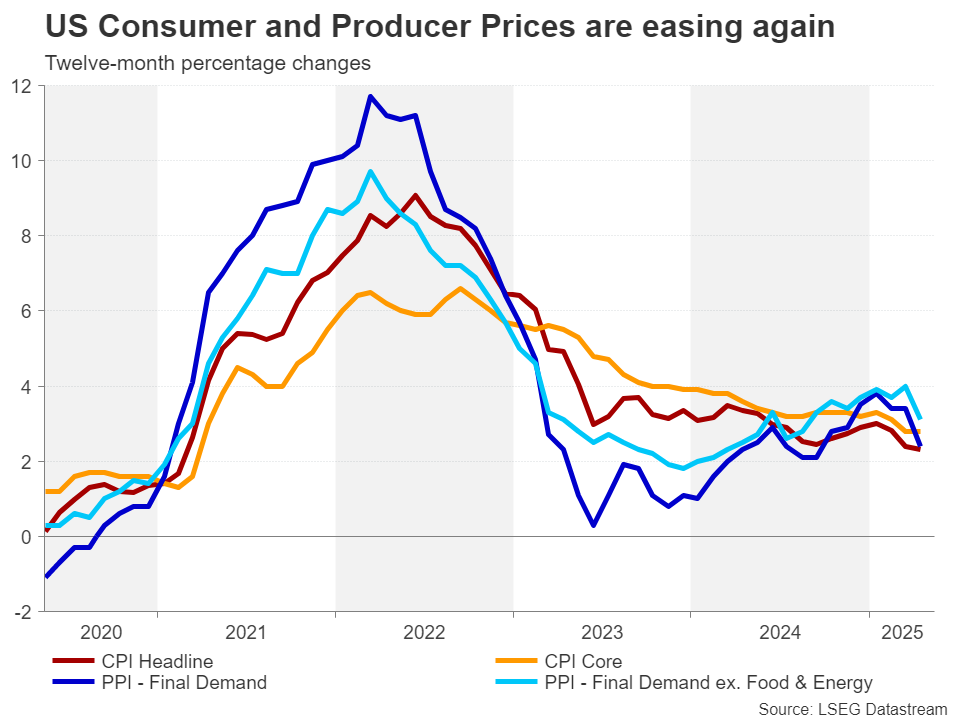
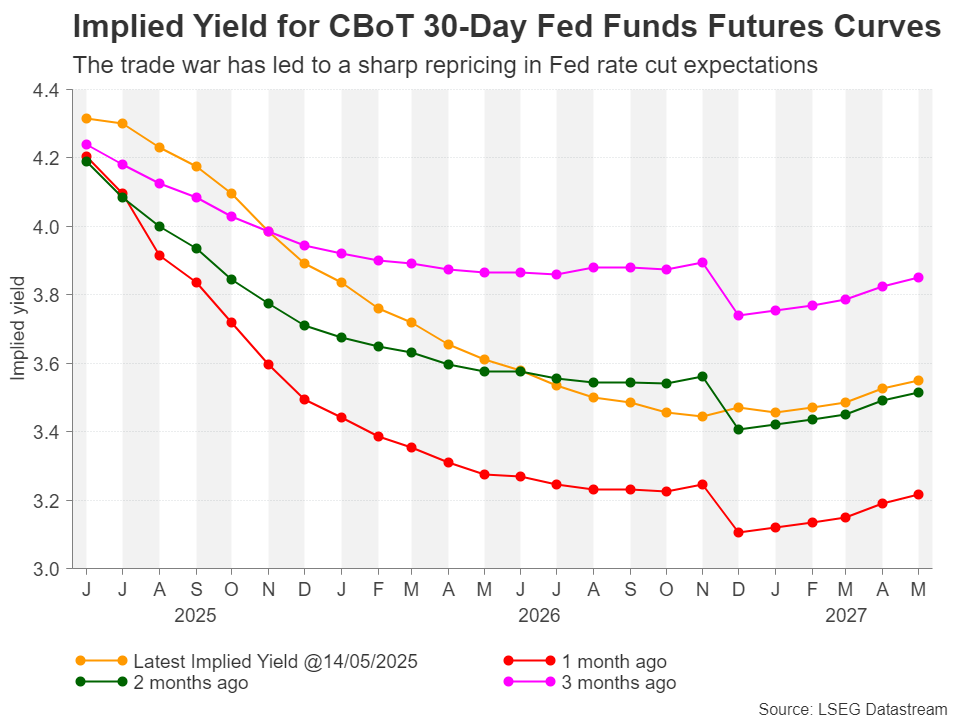
Apart from the ongoing risk that Trump could re-impose some of the suspended tariffs at any point, there is also huge uncertainty about what will happen to inflation. For now, US inflation appears to be gradually declining, putting the Fed in a strong position to resume its rate cuts at some point in the second half of the year.
However, the Trump administration has repeatedly indicated that the 10% baseline tariffs that were introduced on April 2 are here to stay. The 25% duties on specific sectors are also not likely to be abolished completely, even if there are some further exemptions in the future. Plus, tariffs on additional industries are possible.
This makes it difficult for the Fed to feel confident about inflation maintaining its current downward path as there’s bound to be some impact from the higher tariffs on US prices even in the best cast scenario. Investors currently foresee just two rate cuts this year, with a full 25-basis-point reduction not fully priced in until September.
A long pause seems more justifiable now that exorbitant tariff levels have been scaled back and no longer pose a threat to the economy. But then why is the dollar’s rebound looking shaky?
It’s likely that investors still see a significant risk of stagflation, as the uncertainty about Trump’s policies will probably hold back business and consumer spending to some extent, suppressing growth while costs go up. It’s also the case that the supply chain landscape will go through an inevitable transformation, as many businesses will be forced either way to shift some or all of their production to the US, pushing up costs.
Investors should not be fooled into thinking that America’s quest to decouple from China will stop when Washington and Beijing finalise their deal, which itself may not bring an end to the broader economic war.
One reason why Trump is coming down hard on China in his second term is because of the failure of the Phase I agreement signed in January 2020 during his first term. The Chinese did not live up to their commitment of buying more US goods, so the White House will be wary not to repeat the same mistake and will seek better safeguards for enforcement of the deal.
Hence, the stakes are a lot higher this time, meaning a resolution of the trade dispute may take a lot longer than anticipated. This explains why many investors are maintaining a substantial degree of caution until there is a more convincing breakthrough in the negotiations.
Nevertheless, some optimism in the short term is warranted, as all the signs suggest the Trump administration wants to avoid another stock market meltdown and is determined to get more preliminary deals across the finish line. It’s also highly likely that the existing 90-day delays on reciprocal tariffs will be extended, while the evidence from the latest announcements on the chip and pharmaceutical sectors is that the White House is toning down its stance amid outcry from industry leaders.
For the dollar, a break above the 50-day MA is vital if the recovery is to gain any traction, with the next critical barrier likely to be found around 103.35, followed by the 200-day MA. Though, the 200-day may be too bullish a target at the moment as downside risks persist.
Trump’s constant flip-flopping on trade and undermining of America’s democratic institutions is harming the dollar’s position as the world’s reserve currency. This may limit the dollar’s advances even if there is a further cooling in trade tensions.
But in the event that there is a re-escalation in the trade war and Fed rate cut expectations are ratcheted up, there is scope for the dollar index to slide all the way down to the 94.60 region towards 2021 lows.
Currency pair Euro Dollar EUR/USD concludes the trading week with a slight drop close to the level of 1.1203. Moving averages indicate an existing bearish trend for this pair. Prices broke through the area between signal lines upwards, which indicates pressure from buyers of the European currency and a likely continuation of growth already from current levels. In terms of the EUR/USD price forecast for the trading week, it is expected that there will be an attempt to develop growth in the quotations of this pair up to the resistance area near 1.1305, followed by a pullback downwards and further decline of the Euro Dollar currency pair on the current trading week. The potential target of growth stands below the level of 1.0765.
Additional confirmation of the EUR/USD currency pair’s decrease on Forex will be when the broken trend line is tested on the Relative Strength Index (RSI) indicator. The second signal will be a bounce off the bottom boundary of the bullish channel. Cancelling the option of decreasing the Euro/Dollar currency pair quotes for the current trading week from May 19 – 23, 2025, would be a strong rise and break through the level of 1.1705. This will indicate the resistance area and continuation of growth in the region above the level of 1.1985. A breakthrough of the support area and closing quotes below the level of 1.1045 should be expected to confirm a decline in prices, indicating a breakthrough the bottom boundary of the bullish channel.

EURUSD Weekly Forecast May 19 — 23, 2025 anticipates a bullish correction attempt and testing the resistance area close to level 1.1305. From which we can expect a price bounce downwards and continuation of the currency pair’s decline on the Forex market into an area below the level 1.0765. An additional signal for depreciation would be testing the resistance line on the Relative Strength Index (RSI) indicator. A reversal of the downward scenario for Euro Dollar will come from strong growth and breaking through the level 1.1705. In this case, we can expect continuation of the pair’s rise with a potential target at the level 1.1985.

On May 16, 2025, the University of Michigan released Michigan Consumer Sentiment report for May. The report indicated that Michigan Consumer Sentiment declined from 52.2 in April to 50.8 in May, compared to analyst forecast of 53.4.

Current Economic Conditions decreased from 59.8 in April to 57.6 in May, while Index of Consumer Expectations declined from 47.3 to 46.5.
Year-ahead inflation expectations continued to rise at a robust pace, surging from 6.5% in April to 7.3% in May. Long-run inflation expectations increased from 4.4% to 4.6%.
The University of Michigan commented: “Many survey measures showed some signs of improvement following the temporary reduction of China tariffs, but these initial upticks were too small to alter the overall picture – consumers continue to express somber views about the economy.”
U.S. Dollar Index moved higher as traders reacted to Michigan Consumer Sentiment Report. Currently, U.S. Dollar Index is trying to settle above the 100.85 level.
Gold remained under pressure after the release of the report. Gold settled below the $3185 level as the pullback continued.
SP500 settled near the 5925 level as traders focused on the weaker-than-expected report. Rising inflation expectations may force the Fed to be more hawkish than previously expected, which is bearish for stocks.
Daily Light Crude Oil Futures
U.S. import prices unexpectedly rose in April as a surge in the cost of capital goods offset cheaper energy products.
Import prices gained 0.1% last month after dropping 0.4% in March, the Labor Department's Bureau of Labor Statistics said on Friday. Economists polled by Reuters had forecast import prices, which exclude tariffs, would decrease 0.4%. In the 12 months through April, import prices edged up 0.1%.
Data this week showed benign consumer and producer price readings in April. Economists expect the impact of President Donald Trump's sweeping import duties to become evident in inflation data by the middle of this year.
The tariffs have raised fears of a slowdown in global growth, contributing to a dampening of oil prices.
Federal Reserve Chair Jerome Powell warned on Thursday that "we may be entering a period of more frequent, and potentially more persistent, supply shocks - a difficult challenge for the economy and for central banks."
Economists expect the U.S. central bank will resume cutting interest rates either in September or December. The Fed left its benchmark overnight interest rate in the 4.24%-4.50% range earlier this month.
Imported fuel prices fell 2.6% in April after decreasing by 3.4% in March. Food prices were unchanged after dipping 0.1% in the prior month. Excluding fuels and food, import prices shot up 0.5%. That followed a 0.1% dip in March. In the 12 months through March, the so-called core import prices increased 0.8%. Prices for imported capital goods jumped 0.6%, while those of consumer goods excluding motor vehicles increased 0.3%. Prices for imported motor vehicles, parts and engines rose 0.2%.
The weakness of the dollar is likely contributing to the firmness in these import prices.
Trump's aggressive trade policies have rattled investors' confidence in the dollar, leading to a sharp fall in U.S. assets. The trade-weighted dollar is down about 5.1% this year, with most of the depreciation occurring in April.
The underlying U.S. economy is more resilient to tariff-fueled pressures than investors give it credit for, according to analysts at BofA.
In a note to clients, the brokerage said that, while they have downgraded their forecasts for U.S. growth, they do not anticipate the world’s largest economy will slide into a recession because of U.S. President Donald Trump’s aggressive trade agenda.
"Despite the massive tariff hikes in early April, we stayed relatively sanguine because we anticipated de-escalation, along with fiscal easing, down the line," the analysts wrote.
Trump and U.S. officials have eased back from recently-punishing levies in recent days.
On Monday, the U.S. and China agreed to lower tit-for-tat tariffs and temporarily delay their respective levies for 90 days.
The move came after Trump slapped soaring duties of at least 145% on China, leading Beijing to respond with its own retaliatory tariffs of 125%.
Following the deal, the U.S. tariffs on China were brought down to 30%, folding in a baseline 10% levy and separate 20% duties related to Beijing’s alleged role in the flow of the illegal drug fentanyl. China, meanwhile, cut its tariffs on U.S. items to 10%.
Trump also previously announced -- and then paused -- so-called "reciprocal" tariffs on both friends and adversaries in April.
The BofA analysts said the so-called "Trump put" -- or the belief that the president will intervene to turn around falling markets -- was triggered. Deep ructions shook the stock and bond markets after Trump first instituted his elevated tariffs on April 2, and the president later noted these jitters as a factor behind his decision to postpone the duties.
However, the level at which the Federal Reserve will step in to prop up markets is "much lower", the BofA analysts said. Since January, the strategists have projected that the Fed will not slash interest rates this year.
"This is partly because our read on the underlying health of the economy, and the Trump administration’s response suggests there won’t be a recession," they wrote. "But we also think the markets’ view on the Fed reaction function is too dovish."
The Fed cannot afford to cut rates preemptively while inflation continues to overshoot its 2% target level and there are lingering risks of increased unemployment, the analysts said.
White Label
Data API
Web Plug-ins
Poster Maker
Affiliate Program
The risk of loss in trading financial instruments such as stocks, FX, commodities, futures, bonds, ETFs and crypto can be substantial. You may sustain a total loss of the funds that you deposit with your broker. Therefore, you should carefully consider whether such trading is suitable for you in light of your circumstances and financial resources.
No decision to invest should be made without thoroughly conducting due diligence by yourself or consulting with your financial advisors. Our web content might not suit you since we don't know your financial conditions and investment needs. Our financial information might have latency or contain inaccuracy, so you should be fully responsible for any of your trading and investment decisions. The company will not be responsible for your capital loss.
Without getting permission from the website, you are not allowed to copy the website's graphics, texts, or trademarks. Intellectual property rights in the content or data incorporated into this website belong to its providers and exchange merchants.
Not Logged In
Log in to access more features

FastBull Membership
Not yet
Purchase
Log In
Sign Up