• Trade
  • Markets
  • Copy
  • Contests
  • News
  • 24/7
  • Calendar
  • Q&A
  • Chats
Trending
Screeners
SYMBOL
LAST
BID
ASK
HIGH
LOW
NET CHG.
%CHG.
SPREAD
SPX
S&P 500 Index
6860.63
6860.63
6860.63
6895.79
6860.63
+3.51
+ 0.05%
--
DJI
Dow Jones Industrial Average
47892.81
47892.81
47892.81
48133.54
47873.62
+41.88
+ 0.09%
--
IXIC
NASDAQ Composite Index
23520.23
23520.23
23520.23
23680.03
23506.00
+15.10
+ 0.06%
--
USDX
US Dollar Index
98.970
99.050
98.970
99.060
98.740
-0.010
-0.01%
--
EURUSD
Euro / US Dollar
1.16377
1.16385
1.16377
1.16715
1.16277
-0.00068
-0.06%
--
GBPUSD
Pound Sterling / US Dollar
1.33227
1.33237
1.33227
1.33622
1.33159
-0.00044
-0.03%
--
XAUUSD
Gold / US Dollar
4209.86
4210.27
4209.86
4259.16
4194.54
+2.69
+ 0.06%
--
WTI
Light Sweet Crude Oil
59.986
60.016
59.986
60.236
59.187
+0.603
+ 1.02%
--

Community Accounts

Signal Accounts
--
Profit Accounts
--
Loss Accounts
--
View More

Become a signal provider

Sell trading signals to earn additional income

View More

Guide to Copy Trading

Get started with ease and confidence

View More

Signal Accounts for Members

All Signal Accounts

Best Return
  • Best Return
  • Best P/L
  • Best MDD
Past 1W
  • Past 1W
  • Past 1M
  • Past 1Y

All Contests

  • All
  • Trump Updates
  • Recommend
  • Stocks
  • Cryptocurrencies
  • Central Banks
  • Featured News
Top News Only
Share

Anthropic Executive Amodei Met With President Trump’s Administration Officials On Thursday And Also Met With A Bipartisan Group In The Senate

Share

Chechen Leader Kadyrov Says Grozny Was Attacked By Ukrainian Drone

Share

Cnn Brasil: Brazil Ex-President Bolsonaro Signals Support For Senator Flavio Bolsonaro As Presidential Candidate Next Year

Share

French Energy Minister: Request For State Aid Approval For EDF's Six Nuclear Reactor Projects Has Been Sent To Brussels

Share

Congo Orders Cobalt Exporters To Pre-Pay 10% Royalty Within 48 Hours Under New Export Rules, Government Circular Seen By Reuters Shows

Share

US Court Says Trump Can Remove Democrats From Two Federal Labor Boards

Share

In The Past 24 Hours, The Marketvector Digital Asset 100 Small Cap Index Fell 6.62%, Temporarily Reporting 4066.13 Points. The Overall Trend Continued To Decline, And The Decline Accelerated At 00:00 Beijing Time

Share

MSCI Nordic Countries Index Rose 0.5% To 358.24 Points, A New Closing High Since November 13, With A Cumulative Gain Of Over 0.66% This Week. Among The Ten Sectors, The Nordic Industrials Sector Saw The Largest Increase. Neste Oyj Rose 5.4%, Leading The Pack Among Nordic Stocks

Share

Brazil's Petrobras Could Start Production At New Tartaruga Verde Well In Two Years

Share

US President Trump: We Get Along Very Well With Canada And Mexico

Share

Trump: Have Meeting Set Up For After Event, Will Discuss Trade

Share

Canadian Prime Minister Mark Carney Met With Mexican President Jacinda Sinbaum And US President Donald Trump

Share

Trump: Working With Canada And Mexico

Share

Euro Down 0.14% At $1.1629

Share

USA Dollar Index At Session High, Last Up 0.02% At 99.08

Share

Dollar/Yen Up 0.15% At 155.355

Share

Germany's DAX 30 Index Closed Up 0.77% At 24,062.60 Points, Up About 1% For The Week. France's Stock Index Closed Down 0.05%, Italy's Stock Index Closed Down 0.04% And Its Banking Index Fell 0.34%, And The UK's Stock Index Closed Down 0.36%

Share

The STOXX Europe 600 Index Closed Up 0.05% At 579.11 Points, Up Approximately 0.5% For The Week. The Eurozone STOXX 50 Index Closed Up 0.20% At 5729.54 Points, Up Approximately 1.1% For The Week. The FTSE Eurotop 300 Index Closed Up 0.03% At 2307.86 Points

Share

Trump Says He Might Meet With President Of Mexico At Fifa Meeting

Share

Brazil's Real Weakens 2% Versus USA Dollar, To 5.42 Per Greenback In Spot Trading

TIME
ACT
FCST
PREV
U.K. Halifax House Price Index YoY (SA) (Nov)

A:--

F: --

P: --

France Current Account (Not SA) (Oct)

A:--

F: --

P: --

France Trade Balance (SA) (Oct)

A:--

F: --

P: --

France Industrial Output MoM (SA) (Oct)

A:--

F: --

P: --

Italy Retail Sales MoM (SA) (Oct)

A:--

F: --

P: --

Euro Zone Employment YoY (SA) (Q3)

A:--

F: --

P: --

Euro Zone GDP Final YoY (Q3)

A:--

F: --

P: --

Euro Zone GDP Final QoQ (Q3)

A:--

F: --

P: --

Euro Zone Employment Final QoQ (SA) (Q3)

A:--

F: --

P: --

Euro Zone Employment Final (SA) (Q3)

A:--

F: --

P: --
Brazil PPI MoM (Oct)

A:--

F: --

P: --

Mexico Consumer Confidence Index (Nov)

A:--

F: --

P: --

Canada Unemployment Rate (SA) (Nov)

A:--

F: --

P: --

Canada Labor Force Participation Rate (SA) (Nov)

A:--

F: --

P: --

Canada Employment (SA) (Nov)

A:--

F: --

P: --

Canada Part-Time Employment (SA) (Nov)

A:--

F: --

P: --

Canada Full-time Employment (SA) (Nov)

A:--

F: --

P: --

U.S. Personal Income MoM (Sept)

A:--

F: --

P: --

U.S. PCE Price Index YoY (SA) (Sept)

A:--

F: --

P: --

U.S. PCE Price Index MoM (Sept)

A:--

F: --

P: --

U.S. Personal Outlays MoM (SA) (Sept)

A:--

F: --

P: --

U.S. Core PCE Price Index MoM (Sept)

A:--

F: --

P: --

U.S. Core PCE Price Index YoY (Sept)

A:--

F: --

P: --

U.S. UMich 5-Year-Ahead Inflation Expectations Prelim YoY (Dec)

A:--

F: --

P: --

U.S. Real Personal Consumption Expenditures MoM (Sept)

A:--

F: --

P: --

U.S. 5-10 Year-Ahead Inflation Expectations (Dec)

A:--

F: --

P: --

U.S. UMich Current Economic Conditions Index Prelim (Dec)

A:--

F: --

P: --

U.S. UMich Consumer Sentiment Index Prelim (Dec)

A:--

F: --

P: --

U.S. UMich 1-Year-Ahead Inflation Expectations Prelim (Dec)

A:--

F: --

P: --

U.S. UMich Consumer Expectations Index Prelim (Dec)

A:--

F: --

P: --

U.S. Weekly Total Rig Count

--

F: --

P: --

U.S. Weekly Total Oil Rig Count

--

F: --

P: --

U.S. Consumer Credit (SA) (Oct)

--

F: --

P: --

China, Mainland Foreign Exchange Reserves (Nov)

--

F: --

P: --

China, Mainland Exports YoY (USD) (Nov)

--

F: --

P: --

China, Mainland Imports YoY (CNH) (Nov)

--

F: --

P: --

China, Mainland Imports YoY (USD) (Nov)

--

F: --

P: --

China, Mainland Imports (CNH) (Nov)

--

F: --

P: --

China, Mainland Trade Balance (CNH) (Nov)

--

F: --

P: --

China, Mainland Exports (Nov)

--

F: --

P: --

Japan Wages MoM (Oct)

--

F: --

P: --

Japan Trade Balance (Oct)

--

F: --

P: --

Japan Nominal GDP Revised QoQ (Q3)

--

F: --

P: --

Japan Trade Balance (Customs Data) (SA) (Oct)

--

F: --

P: --

Japan GDP Annualized QoQ Revised (Q3)

--

F: --

P: --
China, Mainland Exports YoY (CNH) (Nov)

--

F: --

P: --

China, Mainland Trade Balance (USD) (Nov)

--

F: --

P: --

Germany Industrial Output MoM (SA) (Oct)

--

F: --

P: --

Euro Zone Sentix Investor Confidence Index (Dec)

--

F: --

P: --

Canada Leading Index MoM (Nov)

--

F: --

P: --

Canada National Economic Confidence Index

--

F: --

P: --

U.S. Dallas Fed PCE Price Index YoY (Sept)

--

F: --

P: --

U.S. 3-Year Note Auction Yield

--

F: --

P: --

U.K. BRC Overall Retail Sales YoY (Nov)

--

F: --

P: --

U.K. BRC Like-For-Like Retail Sales YoY (Nov)

--

F: --

P: --

Australia Overnight (Borrowing) Key Rate

--

F: --

P: --

RBA Rate Statement
RBA Press Conference
Germany Exports MoM (SA) (Oct)

--

F: --

P: --

U.S. NFIB Small Business Optimism Index (SA) (Nov)

--

F: --

P: --

Mexico Core CPI YoY (Nov)

--

F: --

P: --

Q&A with Experts
    • All
    • Chatrooms
    • Groups
    • Friends
    Connecting
    .
    .
    .
    Type here...
    Add Symbol or Code

      No matching data

      All
      Trump Updates
      Recommend
      Stocks
      Cryptocurrencies
      Central Banks
      Featured News
      • All
      • Russia-Ukraine Conflict
      • Middle East Flashpoint
      • All
      • Russia-Ukraine Conflict
      • Middle East Flashpoint

      Search
      Products

      Charts Free Forever

      Chats Q&A with Experts
      Screeners Economic Calendar Data Tools
      Membership Features
      Data Warehouse Market Trends Institutional Data Policy Rates Macro

      Market Trends

      Market Sentiment Order Book Forex Correlations

      Top Indicators

      Charts Free Forever
      Markets

      News

      News Analysis 24/7 Columns Education
      From Institutions From Analysts
      Topics Columnists

      Latest Views

      Latest Views

      Trending Topics

      Top Columnists

      Latest Update

      Signals

      Copy Rankings Latest Signals Become a signal provider AI Rating
      Contests
      Brokers

      Overview Brokers Assessment Rankings Regulators News Claims
      Broker listing Forex Brokers Comparison Tool Live Spread Comparison Scam
      Q&A Complaint Scam Alert Videos Tips to Detect Scam
      More

      Business
      Events
      Careers About Us Advertising Help Center

      White Label

      Data API

      Web Plug-ins

      Affiliate Program

      Awards Institution Evaluation IB Seminar Salon Event Exhibition
      Vietnam Thailand Singapore Dubai
      Fans Party Investment Sharing Session
      FastBull Summit BrokersView Expo
      Recent Searches
        Top Searches
          Markets
          News
          Analysis
          User
          24/7
          Economic Calendar
          Education
          Data
          • Names
          • Latest
          • Prev

          View All

          No data

          Scan to Download

          Faster Charts, Chat Faster!

          Download App
          English
          • English
          • Español
          • العربية
          • Bahasa Indonesia
          • Bahasa Melayu
          • Tiếng Việt
          • ภาษาไทย
          • Français
          • Italiano
          • Türkçe
          • Русский язык
          • 简中
          • 繁中
          Open Account
          Search
          Products
          Charts Free Forever
          Markets
          News
          Signals

          Copy Rankings Latest Signals Become a signal provider AI Rating
          Contests
          Brokers

          Overview Brokers Assessment Rankings Regulators News Claims
          Broker listing Forex Brokers Comparison Tool Live Spread Comparison Scam
          Q&A Complaint Scam Alert Videos Tips to Detect Scam
          More

          Business
          Events
          Careers About Us Advertising Help Center

          White Label

          Data API

          Web Plug-ins

          Affiliate Program

          Awards Institution Evaluation IB Seminar Salon Event Exhibition
          Vietnam Thailand Singapore Dubai
          Fans Party Investment Sharing Session
          FastBull Summit BrokersView Expo

          Pump Prices Pause As A Hurricane Comes Ashore

          AAA

          Economic

          Summary:

          The national average for a gallon of gas wobbled by a few cents before ending up where it started a week ago at $3.22.

          The national average for a gallon of gas wobbled by a few cents before ending up where it started a week ago at $3.22. Pump prices have been sliding recently, but the rapid intensification of Hurricane Helene appears to be having an effect. Meanwhile, the average cost of public EV charging was unchanged.
          “Hurricane Helene will likely impact gasoline demand, but not supply,” said Andrew Gross, AAA spokesperson. “The storm is missing the Gulf’s oil production and refining centers as it lumbers through the Southeast. But power outages, structural damage, and road flooding will hinder people from fueling up for a few days. So any impact on the national average will probably be fleeting.”
          With an estimated 1.2 million AAA members living in households with one or more electric vehicles, AAA tracks the average kilowatt-per-hour cost for all levels of public charging by state. Today’s national average for a kilowatt of electricity at a public charging station is 35 cents.
          According to new data from the Energy Information Administration (EIA), gas demand rose from 8.77 million b/d last week to 9.20. Meanwhile, total domestic gasoline stocks fell slightly from 221.6 million barrels to 220.1, while gasoline production increased last week, averaging 9.8 million barrels daily. Tepid gasoline demand and low oil costs will likely keep pump prices sliding.
          Today’s national average for a gallon of gas is $3.22, 13 cents less than a month ago and 61 cents less than a year ago.
          To stay updated on all economic events of today, please check out our Economic calendar
          Risk Warnings and Disclaimers
          You understand and acknowledge that there is a high degree of risk involved in trading. Following any strategies or investment methods may lead to potential losses. The content on the site is provided by our contributors and analysts for information purposes only. You are solely responsible for determining whether any trading assets, securities, strategy, or any other product is suitable for investing based on your own investment objectives and financial situation.
          Add to Favorites
          Share

          Pending Home Sales Edged Up 0.6% in August

          NAR

          Economic

          Pending home sales in August rose 0.6%, according to the National Association of REALTORS. The Midwest, South and West posted monthly gains in transactions, while the Northeast recorded a loss. Year-over-year, the West registered growth, but the Northeast, Midwest and South declined.
          The Pending Home Sales Index (PHSI)– a forward-looking indicator of home sales based on contract signings – increased to 70.6 in August. Year over year, pending transactions were down 3.0%. An index of 100 is equal to the level of contract activity in 2001.
          “A slight upward turn reflects a modest improvement in housing affordability, primarily because mortgage rates descended to 6.5% in August,” said NAR Chief Economist Lawrence Yun. “However, contract signings remain near cyclical lows even as home prices keep marching to new record highs.”

          Pending Home Sales Regional Breakdown

          The Northeast PHSI diminished 4.6% from last month to 61.6, a drop of 2.2% from August 2023. The Midwest index intensified 3.2% to 70.0 in August, down 3.6% from one year ago.
          The South PHSI grew 0.1% to 83.6 in August, receding 5.3% from the prior year. The West index increased 3.2% in August to 58.0, up 2.7% from August 2023.
          “In terms of home sales and prices, the New England region has performed relatively better than other regions in recent months,” Yun said. “Contract signings rose in both the most affordable and most expensive regions – the Midwest and West, respectively – because mortgage rates have fallen nationally. Housing affordability will continue to see notable improvements.” “The Federal Reserve does not directly control mortgage rates, but the anticipation of more short-term interest rate cuts has pushed long-term mortgage rates down to near 6% in late September,” added Yun. “On a typical $300,000 mortgage, that translates to approximately $300 per month in mortgage payment savings compared to a few months ago.”
          To stay updated on all economic events of today, please check out our Economic calendar
          Risk Warnings and Disclaimers
          You understand and acknowledge that there is a high degree of risk involved in trading. Following any strategies or investment methods may lead to potential losses. The content on the site is provided by our contributors and analysts for information purposes only. You are solely responsible for determining whether any trading assets, securities, strategy, or any other product is suitable for investing based on your own investment objectives and financial situation.
          Add to Favorites
          Share

          Financial Stability Assessment

          RBA

          Economic

          While inflation has eased, the global economic outlook continues to be uncertain and vulnerabilities in the global financial system remain.

          The finances of many households and businesses in advanced economies continue to be resilient, despite ongoing pressure from tight monetary policy and inflation. This resilience has been supported by firm, albeit softening, conditions in labour markets, a stabilisation or pick-up in real household incomes, and solid corporate earnings. While there is a small but growing group of borrowers experiencing financial stress in these economies, a further easing in inflation − and with it, lower policy rates − is expected to support the balance sheets and cash flows of households and firms over the period ahead.
          The central expectation for many countries, including Australia, remains a modest economic cycle, but this outcome is by no means assured. Considerable uncertainty about the outlook remains, and there have been bouts of market volatility over recent months. A significant economic downturn, including a sharp deterioration in labour markets, is the principal risk to the resilience of borrowers. The sizeable capital buffers maintained by large banks worldwide position them well to handle rising loan impairments in such a scenario and continue supporting the economy. However, threats originating from outside the financial system – including geopolitical risks and risks associated with climate change – also continue to increase and have the potential to adversely interact with vulnerabilities in the global financial system.

          Three vulnerabilities stand out as having the potential to significantly impact financial stability in Australia:

          Operational vulnerabilities resulting from increased complexity and interconnectedness in the digital economy.Digitalisation and rapid technological development are transforming how the economy and financial system operate. This is delivering speed and efficiency gains, lowering costs and improving the consumer experience. But it also comes with an increase in complexity and interconnectedness. Technological innovations – such as artificial intelligence and cloud computing – have led to increasing concentration risk in third-party providers and raised the risks of central points of failure in the financial system. Recent incidents have highlighted the vulnerability of the economy and financial system to technological outages and underscored the need to strengthen operational resilience within firms and across their networks. Advancing digitalisation is occurring at a time of heightened geopolitical tensions, which increases the prospect of cyber-attacks that could have systemic implications.
          Low risk premia and leveraged positions increase the potential for a disorderly adjustment in global asset prices in response to negative news. Low risk premia in a number of major asset classes, particularly equities and credit, makes global asset prices sensitive to negative surprises. This could set off disorderly price adjustments and disrupt the funding markets that Australian businesses and financial institutions use extensively. The bout of heightened global market volatility in early August highlighted the risk that disappointing economic or earnings news, or worsening geopolitical tensions, could trigger such an event. Further increases in government debt in key advanced economies could also make these markets more sensitive to adverse shocks, including those that exacerbate concerns about debt sustainability. As recent years have shown, the leverage and interlinkages of non-bank financial intermediaries with banks could also amplify the effects of shocks to the global financial system.
          Imbalances in China’s financial sector. Longstanding vulnerabilities in part of the Chinese financial system – including banks, non-banks and local governments – have been exacerbated by the ongoing weakness in the Chinese real estate sector. A further loss of confidence – absent a timely and significant response from the Chinese authorities – could see stress spill over to the rest of the Chinese economy and financial system, which would likely affect the global economy and financial system

          Should these risks and vulnerabilities materialise, spillovers to the Australian financial system could occur in the following ways:

          Directly and rapidly through a severe operational disruption– including to national infrastructure or to a key financial institution.
          Via a significant increase in risk aversion in global financial markets– to the extent that it sharply raises costs and limits Australian firms’ and financial institutions’ access to funding and liquidity in global markets. This would exacerbate financial pressures on domestic borrowers and, to the extent this puts significant strain on financial institutions’ balance sheets, limit access to credit in the Australian economy. However, the exchange rate would also depreciate, providing an economic and financial stabilising mechanism.
          Via the impact on the real economy– through trade and investment channels, particularly in the case of a sharp downturn in China.

          Risks to the Australian financial system from lending to households, businesses and commercial real estate (CRE) remain contained.

          Budget pressures from high inflation and restrictive monetary policy continue to be felt across the Australian community, but the share of borrowers experiencing severe financial stress remains small. While a small but rising share of Australian households are falling behind on their mortgage repayments, the vast majority of borrowers continue to be able to service their debts and most have maintained, if not added, to their mortgage buffers. Many businesses also continue to manage pressure on their cash flows and balance sheets, supported by their strong financial positions prior to the rise of inflation and interest rates. Nevertheless, business conditions remain challenging for many firms, and small businesses in particular. Business insolvencies have increased sharply over the past couple of years following the removal of pandemic-era support, though they are only slightly above pre-pandemic levels as a share of all businesses.
          Financial pressures are expected to ease in the period ahead, but the economic outlook is highly uncertain. Based on the forecasts presented in the August Statement on Monetary Policy, budget pressures are expected to ease as inflation moderates further and Stage 3 tax cuts take effect. However, the expected easing in labour market conditions and subdued growth in activity will be challenging for some households and businesses. Stress on households and businesses would be magnified if economic conditions deteriorated further than anticipated and/or if inflation and interest rates were to remain high for longer than expected.
          The risk of widespread financial stress remains limited due to the generally strong financial positions of most borrowers. Very few mortgage borrowers are in negative equity, limiting the impact on lenders in the event of default and supporting their ability to continue providing credit to the economy. Most businesses that have entered insolvency are small and have little debt, limiting the broader impact on the labour market and thus household incomes, and on the capital position of lenders.
          Domestic vulnerabilities could increase if households respond to any easing in financial conditions by taking on excessive debt. Historically, periods of low and/or falling interest rates have coincided with borrowers taking on higher levels of debt and, in some cases, lenders extending credit to riskier borrowers. This could be magnified if lending standards drop. International experience has highlighted the danger of boom-bust asset price cycles, particularly those amplified by the widespread use of borrowed money. Residential property stands out in this regard.
          Conditions in segments of international and domestic CRE markets remain challenging, particularly in secondary grade office buildings, but the financial stability risks in Australia remain contained. Despite large declines in asset valuations over the past couple of years, overall indicators of financial stress in the Australian CRE market are low by historical standards. One risk scenario is that stress in overseas CRE markets spills over to Australian market conditions via interconnected sources of ownership and funding. While this could lead to losses for some investors and non-bank lenders, it is unlikely to materially affect the asset quality of domestic banks given their relatively limited CRE exposures and conservative lending standards to the sector.

          The Australian financial system continues to display a high level of resilience.

          Australian banks have maintained prudent lending standards and are well positioned to continue supplying credit to the economy. A deterioration in economic conditions or temporary disruption to funding markets is unlikely to halt lending activity. Banks have anticipated an increase in loan arrears and have capital and liquidity buffers well above regulatory requirements.
          Arrears in Australian non-bank lenders’ loan books have picked up, but system-wide risks to financial stability remain contained. The sector has continued to expand, including by taking market share from banks in business lending. However, systemic risks from the sector remain limited due to the sector’s small size and that its core funding is not sourced from banks. That said, detailed analysis of underlying credit quality is challenging due to limited data availability.
          The significant growth of the superannuation sector and its connections to Australian banks has increased its importance to financial system stability. The sector has historically posed little risk to the financial system owing to its smaller footprint in funding Australian banks and corporations, limited use of leverage, and steady inflows of defined contributions that simply pass-through (rather than guarantee) returns to members. However, the sector’s rapid growth (now making up one-quarter of the financial system), the rise in herding around common benchmarks and increased exposure to margin calls (including from the hedging of foreign asset exposures) mean the sector’s investment decisions and liquidity risk management practices have a greater potential than before to amplify shocks in the financial system. For this reason, APRA is stepping up the intensity of its prudential supervision of superannuation funds.

          Lifting and maintaining operational resilience in an increasingly digitalised and interconnected financial system will require a sustained and proactive effort.

          The operational resilience of financial institutions and infrastructures is crucial for the stability of the Australian financial system. Digitalisation brings many benefits, but also new and more complex operational risks and vulnerabilities. These could interact with (and amplify) other risks, including geopolitical risk, with potentially severe consequences.
          Strengthening operational resilience remains a regulatory priority in Australia and globally. Strong governance and operational risk management practices by financial institutions is essential in today’s high-threat environment. This requires an ongoing effort by industry, and regulators in Australia and internationally are stepping up the intensity of their demands in response.
          To stay updated on all economic events of today, please check out our Economic calendar
          Risk Warnings and Disclaimers
          You understand and acknowledge that there is a high degree of risk involved in trading. Following any strategies or investment methods may lead to potential losses. The content on the site is provided by our contributors and analysts for information purposes only. You are solely responsible for determining whether any trading assets, securities, strategy, or any other product is suitable for investing based on your own investment objectives and financial situation.
          Add to Favorites
          Share

          A Rising Tide Lifts All Boats

          Cohen

          Economic

          Markets

          A rising tide lifts all boats. Or in this case, a rising Chinese stock market lifts global risk sentiment. More fiscal spending, measures to stabilize the property sector, potential capital injections in the largest banks and forceful rate cuts are now also part of the toolkit announced earlier this week. European stock markets closed up to 2.35% (!) higher for the Eurostoxx50 with main US benchmarks extending their record race (+0.4%-0.6%) though closing off the day’s best levels. Most Asian stock markets show signs of some consolidation this morning, apart from China which adds another 5%-7% to an already record-week.

          US eco data included a minor upward revision in the final Q2 print (3% Q/Qa), but especially consensus-beating durable goods orders (August) and lower weekly jobless claims (218k). Although second tier and coming ahead of PCE deflators (today) and ISM’s, ADP employment change and payrolls (next week) they did manage to swing the November Fed pendulum more into balance between a 25 bps and a 50 bps rate cut. Changes on the US yield curve ranged between +7 bps (2-yr) and -0.9 bps (30-yr).

          Lower oil prices partly help explain the strong curve shift with Brent crude prices dropping from $75/b to $71/b over the past two days. The move is linked to talk that Saudi Arabia is ready to abandon its unofficial $100/b oil price target. The FT reported that they would boost output from December 1st to regain market share. Bullish risk sentiment and lower oil prices balanced out interest rate support for the dollar. The greenback was going nowhere for most of the session and even lost some ground in the final stages of US trading. EUR/USD closed at 1.1177 from a start at 1.1133.

          Today’s agenda contains first national European CPI indications for September (France, Spain, Belgium). Together with already released awful September PMI’s, they are the only input for the ECB in the short intermeeting period between September and October. PMI brough the possibility of a 25 bps rate cut back on the radar from a market point of view. We’re still in favour of a pause. When it comes to inflation numbers, ECB Lagarde at the press conference already “hedged” today and next month’s numbers by saying that they could fall somewhat further now before ticking up into year-end as energy-related base effects turn around.

          We’d be surprised though if markets pick up that nuance today, suggesting that lower inflation numbers could add to short term easing bets. Any potential euro weakness should remain short-lived going into next week’s big US eco week.

          News & Views

          Tokyo core inflation excluding fresh food printed at 2% Y/Y (from 2.4%) this month, matching the BoJ target. This move was mainly due to a reinstalment of measures to ease the cost of utilities (gas and electricity). The government measures are estimated to have reduced inflation by about 0.5%. A more strict core measure, excluding fresh food and energy was unchanged at 1.6%. Tokyo CPI data are seen as a good pointer for the national figure that will be released later next month.

          The October CPI reports are more important for BoJ policy setting as they might include price adjustments at the start of the fiscal second half of the year and give an indication on the degree that corporates are passing through the cost of higher wages. The Japanese yen didn’t respond to the inflation data, but suffered a setback (USD/JPY 146.50 from 145) after BoJ easing advocate Takaichi made it to the LDP leadership contest runoff (facing Ishiba).

          The Bank of Mexico for the second consecutive meeting lowered its policy rate by 25 bps to 10.50%. Vice governor Jonathan Heath vote for an unchanged decision. The bank was mildly constructive in the inflation outlook going forward. Annual headline inflation decreased from 5.57% in July to 4.66% in the first fortnight of September. Core inflation continued trending downwards(3.95% Y/Y). It estimated that, although the outlook for inflation still calls for a restrictive monetary policy stance, its evolution implies that it is adequate to reduce the level of monetary restriction.

          The forecasts for headline and core inflation were revised slightly downwards for some quarters in the short term. Headline inflation is still expected to converge to the target in the fourth quarter of 2025. The Mexican CB targets 3.0% +/- a 1.0% tolerance band. The Mexican peso which traded in the defensive since April but came off the early September lows recently, closed yesterday’s session little changed near USD/MXN 19.63.

          Graphs

          GE 10y yield

          The ECB cut policy rates by 25 bps in June and in September. Stubborn inflation (core, services) make follow-up moves less evident. We expect the central bank to stick with the quarterly reduction pace. Disappointing US and unconvincing-to-outright-weak EMU activity data dragged the long end of the curve down. The move accelerated during the early August market meltdown.

          US 10y yield

          The Fed kicked off its easing cycle with a 50 bps move. It is headed towards a neutral stance now that inflation and employment risks are in balance. Conservative SEP unemployment forecasts risk being caught up by reality and with it the dot plot (50 bps more cuts in 2024). We hold our call for two more 50 bps cuts this year. Pressure on the front of the curve and weakening eco data keeps the long end in the defensive for now as well.
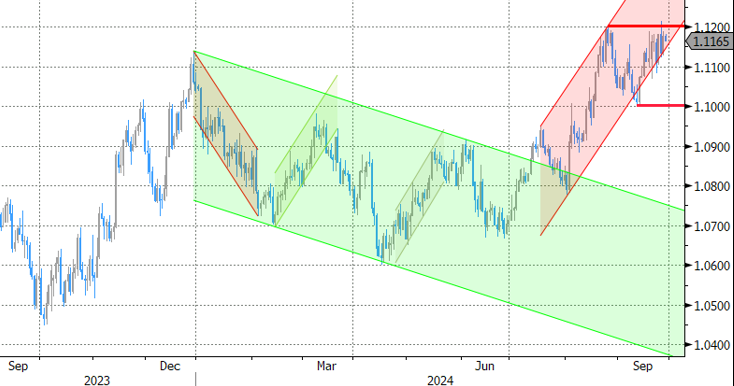
          EUR/USD

          EUR/USD moved above the 1.09 resistance area as the dollar lost interest rate support at stealth pace. US recession risks and bets on fast and large rate cuts trumped traditional safe haven flows into USD. An ailing euro(pean economy) only briefly offset some of the general USD weakness. EUR/USD’s dollar-driven ascent is nearing resistance around 1.12 again.
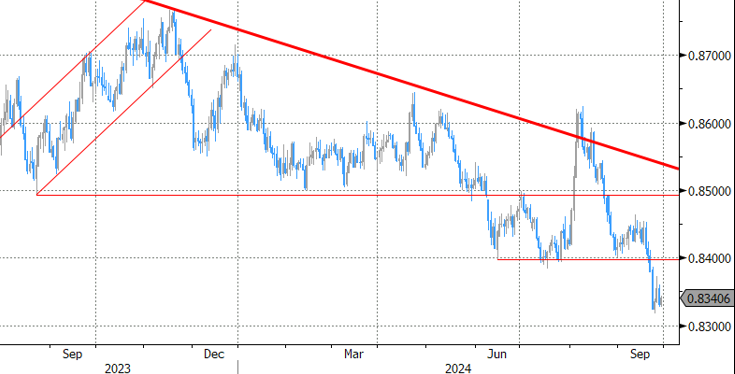
          EUR/GBP

          The BoE delivered a hawkish cut in August. Policy restrictiveness will be further unwound gradually on a pace determined by a broad range of data. The strategy similar to the ECB’s balances out EUR/GBP in a monetary perspective. But the economic picture is increasingly diverging to the benefit of sterling. EUR/GBP succumbed to horrible European September PMI’s. Support at 0.84 broke and brings the 2022 low (0.8203) on the radar.

          Source: ACTIONFOREX

          To stay updated on all economic events of today, please check out our Economic calendar
          Risk Warnings and Disclaimers
          You understand and acknowledge that there is a high degree of risk involved in trading. Following any strategies or investment methods may lead to potential losses. The content on the site is provided by our contributors and analysts for information purposes only. You are solely responsible for determining whether any trading assets, securities, strategy, or any other product is suitable for investing based on your own investment objectives and financial situation.
          Add to Favorites
          Share

          Markets Round-Up: China Growth Measures Drive Up European Stocks

          Warren Takunda

          Economic

          Following the Fed’s rate cut last week, risk-on sentiment continued to buoy global stock markets, bolstered by China’s substantial stimulus measures announced this week.
          European markets have been the primary beneficiaries of China’s additional easing policies, with sectors such as luxury and automotive stocks - more exposed to Chinese markets - experiencing a strong rally.
          In commodities, metal prices surged, with gold reaching a new high once again, while silver and copper also soared amid optimism surrounding increased demand in China.
          In contrast, crude oil dropped to a two-week low after news that OPEC+ would proceed with a planned output hike in December.

          Europe

          Major benchmarks are set to extend weekly gains, with the Euro Stoxx 600 rising by 0.93%, the DAX climbing by 2.77%, the CAC 40 advancing by 3.22%, and the FTSE 100 increasing by 0.67% over the past five trading days.
          Both the Euro Stoxx 600 and DAX reached new highs on Thursday, buoyed by gains in the luxury consumer and automotive sectors, spurred by Chinese policies. Technology stocks also outperformed, mirroring Wall Street’s trend, as US chipmaker Micron raised its revenue forecast.
          Over the week, LVMH surged by 11.5%, ASML rose by 5.38%, Hermès jumped by 13.63%, L’Oréal was up by 9.91%, and Siemens AG soared by 7.97%.
          Additionally, strong metal prices boosted mining stocks, with Rio Tinto up by 11.28%, Glencore rising by 8.10%, and Anglo American jumping by 11.70% during the same period.
          Conversely, energy stocks underperformed due to falling oil prices, with Shell down by 6.45%, BP slumping by 7.49%, and TotalEnergies falling by 4.37% over the five-day trading period.
          Commerzbank shares surged to a fresh 12-year high after Italian lender UniCredit increased its stake to 21% on Monday, following the acquisition of a 9% holding the previous week.
          A potential full takeover may become unavoidable, given this substantial shareholding, with the German government holding 12%.
          On the economic front, eurozone business activity in both the manufacturing and services sectors contracted sharply in September, according to flash data from S&P Global.
          The weak readings have heightened expectations that the European Central Bank will accelerate rate cuts.

          Wall Street

          US stock markets are likely to end the week higher as the Fed’s rate cuts continue to support the market rally.
          Over the past five trading days, the Dow Jones Industrial Average rose by 0.27%, the S&P 500 climbed by 0.75%, and the Nasdaq Composite advanced by 1.35%.
          At a sector level, six out of eleven sectors posted weekly gains, with materials leading the way, up by 3.04%, driven by surging metal prices.
          Technology and consumer discretionary sectors also outperformed, rising by 2.4% and 4.61%, respectively. In contrast, the energy sector slumped by 3.48% due to a sharp decline in oil prices.
          The semiconductor sector regained momentum as Micron’s positive guidance boosted its share price by 13% on Thursday, lifting other chipmakers, with both Nvidia and AMD rising more than 7% for the week.
          The US manufacturing PMI contracted for the third consecutive month in September, according to S&P Global, alongside a sharp drop in consumer confidence, indicating a gloomy economic outlook.
          However, the country’s GDP growth was confirmed at 3% for the second quarter, and employment data showed positive signs. Nevertheless, markets continue to price in deeper rate cuts by the Fed.

          Asia Pacific

          Chinese stock markets surged following the Chinese central bank’s easing measures.
          Chinese benchmarks, including the Hang Seng Index, China A50, and the three mainland averages, all soared by more than 10% compared to last week.
          The People’s Bank of China (PBOC) announced a 0.5% cut to the Reserve Requirement Ratio and reduced rates on short-term lending facilities.
          It also gave financial institutions the green light to buy stocks using central bank borrowings. In addition, the PBOC unveiled measures to boost the property market.
          Meanwhile, Japan's Nikkei 225 Index rose by more than 4% as the Japanese yen weakened against the dollar following the Bank of Japan’s dovish stance last week.
          In contrast, the Australian market underperformed the global trend, with the ASX 200 lagging due to the Reserve Bank of Australia’s hawkish stance.
          The central bank kept the cash rate unchanged at 4.35% and reiterated its restrictive monetary policy to curb inflation. The country’s consumer price index rose by 2.7% in August, remaining above the target level of 2%.

          Source: EuroNews

          To stay updated on all economic events of today, please check out our Economic calendar
          Risk Warnings and Disclaimers
          You understand and acknowledge that there is a high degree of risk involved in trading. Following any strategies or investment methods may lead to potential losses. The content on the site is provided by our contributors and analysts for information purposes only. You are solely responsible for determining whether any trading assets, securities, strategy, or any other product is suitable for investing based on your own investment objectives and financial situation.
          Add to Favorites
          Share

          Rates Spark: Markets Are Positioned For Disappointment

          ING

          Economic

          US Treasury curve dives into cuts and risks being caught by upside surprises

          While markets are prepared for more US data disappointments, the durable goods orders and jobless claims both performed better than consensus. The outperformance wasn’t much, but nevertheless moved the 2Y UST yield higher by some 5bp and shaved off 4bp of cuts for 2024. Such a reaction really underlines the pessimistic positioning of markets and the expectation of an economy grinding to a halt.

          In a broader sense, recent economic surprises have improved recently, yet the front end of the US Treasury curve continues to dive deeper into cuts. Of course, positive economic surprises are also more likely when consensus turns more pessimistic, but even then the latest data points are far from recessionary territory. A slowdown is still our baseline, but the sentiment in rates markets may see some recovery if the data doesn’t deteriorate as promptly as feared, potentially helping the back end of the curve retrace higher.

          Next move in EUR curve likely to be driven by US

          EUR markets remain sensitive to the idea of an October European Central Bank cut and news headlines about Governing Council members supporting an October cut have added fuel to the fire. At the same time, EUR rates are very sensitive to the US economic outlook, which based on Thursday’s data is showing pockets of resilience. Netting these two out meant little change in the EUR rates curves.

          Overall we expect EUR rates to trade sideways for the time being. And although we don’t think an October cut will happen, we also don’t think there will be enough data until then to conclude that with more certainty. The next move for the EUR curve could therefore come from the US, where a recovery in sentiment could provide some upward pressure on the back end of global curves.

          US economic surprises making a recovery

          Today's events and market view

          Friday’s data highlight is the personal income and spending report, with the core personal consumer expenditure deflator the key number within it. Core CPI came in at a relatively “hot” 0.3% month-on-month, but the core PCE should come in at 0.2% given the lower weighting for housing. As such, this should confirm that inflation is not a barrier to further Fed cuts. We will also get the final University of Michigan consumer sentiment index which could be followed more closely after the Conference Board's disappointing report earlier this week. There will also be a busier slate of Fed speakers to watch including Susan Collins, Adriana Kugler and Michelle Bowman.

          In the eurozone, the main events are ECB related, with speeches from Olli Rehn, Joachim Nagel and Philip Lane. On the data side, only the ECB's results of the consumer inflation expectations survey are of note.

          Italy will be auctioning 5Y and 10Y bonds as well as floating rate notes for a total of up to €8.75bn.

          To stay updated on all economic events of today, please check out our Economic calendar
          Risk Warnings and Disclaimers
          You understand and acknowledge that there is a high degree of risk involved in trading. Following any strategies or investment methods may lead to potential losses. The content on the site is provided by our contributors and analysts for information purposes only. You are solely responsible for determining whether any trading assets, securities, strategy, or any other product is suitable for investing based on your own investment objectives and financial situation.
          Add to Favorites
          Share

          Global Market Quick Take: Asia – September 27, 2024

          SAXO

          Economic

          Global Market Quick Take: Asia – September 27, 2024_1

          Macro:

          US initial jobless claims, for the week ending 21st September, fell to 218k from 222k (revised up from 219k), despite expectations for a rise to 218k - a sign of a robust labour market, while the 4wk average fell to 224.75k from 228.25k (revised up from 227.5k). The continued claims, for the week ending 14th September, which coincides with the usual NFP survey week, rose to 1.834mln from 1.821mln (revised down from 1.829mln), but was slightly below the expected 1.838mln.The final estimate for
          US Q2 GDP was unrevised at 3.0%, in line with expectations, and accelerating from the 1.6% growth seen in Q1. Upward revisions to private inventory investment and federal government spending were offset by downward revisions to non-residential fixed investment, exports, consumer spending, and residential fixed investment.The
          Swiss National Bank cut rates for a third time to 1% as expected and also guided for more cuts to come to ensure price stability over the medium term. Containing the strength of the franc was also a key message, but with the central bank reaching its neutral rate, room for further easing may be limited which could force them to switch to FX interventions.
          Japan’s Tokyo CPI for September came in as expected and softer than previous month. Headline Tokyo CPI was at 2.2% YoY from 2.6% previous while core measures eased to 2.0% from 2.4% YoY. Core-core measure remained steady at 1.6% YoY and focus now shifts to LDP election outcome later today. The new Prime Minister could re-set the agenda for the domestic economy and lean on the BOJ on rates. Focus also turns to US PCE release.
          Macro events: Japan’s ruling LDP party leadership election, China Industrial Profits (Aug), German Unemployment (Sep), EZ Consumer Confidence Final (Sep), US PCE (Aug), Uni. of Michigan Final (Sep)
          Earnings: No major earnings
          Equities: On Thursday, the S&P 500 rose 0.4% to reach a new record high, while the Nasdaq gained 0.6%, and the Dow Jones added 260 points. Investor sentiment was buoyed by strong corporate earnings and positive economic data. Micron Technology led the charge, surging 14.7% after an optimistic earnings forecast, which sparked gains across the semiconductor sector. Applied Materials climbed 6.2%, and Lam Research advanced 5.4%. The rally was further supported by encouraging economic reports, including weekly jobless claims falling to a four-month low, indicating a strong labor market. Additionally, second-quarter GDP growth was confirmed at a robust 3%. China stimulus continues to boost sentiment with the Golden Dragon Index up 10.8% and KraneShares CSI China Internet ETF up 11.5%. Hang Seng Index was also up 4.1% in Asia session yesterday and Hang Seng futures were up a further 2.7% overnight. For more on how China stimulus measures can impact markets, read this article.
          Fixed income: The Treasuries curve flattened significantly as long-end yields declined and 2-year yields rose by 6 basis points from Wednesday's close, reflecting a reduced Fed rate cut premium in overnight swaps. Losses intensified ahead of the 7-year note auction, which concluded strongly, trading 0.7 basis points through the when-issued yield. Treasury yields were up to 6 basis points higher at the front end, with the 2s10s spread flattening by 6 basis points on the day. The US 10-year yield hovered around 3.785%, nearly unchanged, as the curve pivoted around this sector. The 2s10s spread saw its most significant flattening in over a month, dropping to as low as 16.2 basis points late in the session. Additionally, the amount of reserves in the banking system, a key factor for the Federal Reserve's balance sheet reduction, fell to its lowest level since April 2023.
          Commodities: Gold rose by 0.57% to settle at $2,672, supported by China's stimulus commentary. It remains a strong uncorrelated hedge for equity portfolios, bolstered by central bank buying, though it may face profit-taking as momentum appears stretched. Silver extended its strong momentum to reach $32.5 per ounce in late September, its highest in 12 years, driven by expectations of incoming rate cuts by the Federal Reserve. WTI crude futures declined overnight and failed to rally despite positive China stimulus news and favorable economic data. The November contract fell by 2.9% to $67.67, while Brent dropped by 2.53% to $71.60. A Financial Times report suggested that Saudi Arabia might abandon its $100 per barrel target and increase production to regain market share, likely driving the price decline despite attempts by bulls to counter the story. Copper futures rose by 3.33% to $463.90, hovering close to over two-month highs on reports that top consumer China will be rolling out more stimulus measures to support the economy.
          FX: The US dollar pared much of its gains as risk-on returned due to the optimism on China’s stimulus measures. The Chinese yuan was back below the 7-handle against the US dollar while the Australian dollar and kiwi dollar outperformed as commodity currencies remain in the spotlight amid optimism that China’s demand could return. High-beat British pound also rose higher. The Swiss franc also defied any pressures given the SNB rate cut was well-expected and there was also an odd chance of a 50bps cut. The only G10 currency that ended lower against the US dollar was the Japanese yen, but losses have been constrained ahead of the LDP elections due today and US PCE out later. The euro and Canadian dollar also underperformed.
          To stay updated on all economic events of today, please check out our Economic calendar
          Risk Warnings and Disclaimers
          You understand and acknowledge that there is a high degree of risk involved in trading. Following any strategies or investment methods may lead to potential losses. The content on the site is provided by our contributors and analysts for information purposes only. You are solely responsible for determining whether any trading assets, securities, strategy, or any other product is suitable for investing based on your own investment objectives and financial situation.
          Add to Favorites
          Share
          FastBull
          Copyright © 2025 FastBull Ltd

          728 RM B 7/F GEE LOK IND BLDG NO 34 HUNG TO RD KWUN TONG KLN HONG KONG

          TelegramInstagramTwitterfacebooklinkedin
          App Store Google Play Google Play
          Products
          Charts

          Chats

          Q&A with Experts
          Screeners
          Economic Calendar
          Data
          Tools
          Membership
          Features
          Function
          Markets
          Copy Trading
          Latest Signals
          Contests
          News
          Analysis
          24/7
          Columns
          Education
          Company
          Careers
          About Us
          Contact Us
          Advertising
          Help Center
          Feedback
          User Agreement
          Privacy Policy
          Business

          White Label

          Data API

          Web Plug-ins

          Poster Maker

          Affiliate Program

          Risk Disclosure

          The risk of loss in trading financial instruments such as stocks, FX, commodities, futures, bonds, ETFs and crypto can be substantial. You may sustain a total loss of the funds that you deposit with your broker. Therefore, you should carefully consider whether such trading is suitable for you in light of your circumstances and financial resources.

          No decision to invest should be made without thoroughly conducting due diligence by yourself or consulting with your financial advisors. Our web content might not suit you since we don't know your financial conditions and investment needs. Our financial information might have latency or contain inaccuracy, so you should be fully responsible for any of your trading and investment decisions. The company will not be responsible for your capital loss.

          Without getting permission from the website, you are not allowed to copy the website's graphics, texts, or trademarks. Intellectual property rights in the content or data incorporated into this website belong to its providers and exchange merchants.

          Not Logged In

          Log in to access more features

          FastBull Membership

          Not yet

          Purchase

          Become a signal provider
          Help Center
          Customer Service
          Dark Mode
          Price Up/Down Colors

          Log In

          Sign Up

          Position
          Layout
          Fullscreen
          Default to Chart
          The chart page opens by default when you visit fastbull.com