• Trade
  • Markets
  • Copy
  • Contests
  • News
  • 24/7
  • Calendar
  • Q&A
  • Chats
Trending
Screeners
SYMBOL
LAST
BID
ASK
HIGH
LOW
NET CHG.
%CHG.
SPREAD
SPX
S&P 500 Index
6857.13
6857.13
6857.13
6865.94
6827.13
+7.41
+ 0.11%
--
DJI
Dow Jones Industrial Average
47850.93
47850.93
47850.93
48049.72
47692.96
-31.96
-0.07%
--
IXIC
NASDAQ Composite Index
23505.13
23505.13
23505.13
23528.53
23372.33
+51.04
+ 0.22%
--
USDX
US Dollar Index
98.890
98.970
98.890
98.980
98.890
-0.090
-0.09%
--
EURUSD
Euro / US Dollar
1.16538
1.16545
1.16538
1.16555
1.16408
+0.00093
+ 0.08%
--
GBPUSD
Pound Sterling / US Dollar
1.33389
1.33399
1.33389
1.33391
1.33165
+0.00118
+ 0.09%
--
XAUUSD
Gold / US Dollar
4216.26
4216.71
4216.26
4218.25
4194.54
+9.09
+ 0.22%
--
WTI
Light Sweet Crude Oil
59.269
59.306
59.269
59.469
59.187
-0.114
-0.19%
--

Community Accounts

Signal Accounts
--
Profit Accounts
--
Loss Accounts
--
View More

Become a signal provider

Sell trading signals to earn additional income

View More

Guide to Copy Trading

Get started with ease and confidence

View More

Signal Accounts for Members

All Signal Accounts

Best Return
  • Best Return
  • Best P/L
  • Best MDD
Past 1W
  • Past 1W
  • Past 1M
  • Past 1Y

All Contests

  • All
  • Trump Updates
  • Recommend
  • Stocks
  • Cryptocurrencies
  • Central Banks
  • Featured News
Top News Only
Share

India's NIFTY IT Index Last Up 1.3%

Share

India's Nifty 50 Index Rises 0.35%

Share

Israel Sets 2026 Defence Budget At $34 Billion

Share

Russia Says Azov Sea's Port Of Temryuk Damaged In Ukrainian Attack

Share

Israel's Defense Budget For 2026 Will Be 112 Billion Israeli Shekels - Defense Minister Office

Share

One India Rate Panel Member Ram Singh Was Of View That Stance Should Be Changed To 'Accommodative' From 'Neutral' - Monetary Policy Committee Statement

Share

Reserve Bank Of India Chief: Will Continue To Meet Productive Needs Of Economy In Proactive Manner

Share

Reserve Bank Of India Chief: System Level Financial Parameters Of Nbfcs Sound

Share

Reserve Bank Of India Chief: Dollar Rupee Swap To Be For 3 Years, To Be Conducted This Month

Share

India's Nifty Realty Index Extend Gains, Last Up 1.4%

Share

India's Nifty Psu Bank Index Rises 1%

Share

Reserve Bank Of India Chief: Commited To Providing Sufficient Durable Liquidity

Share

Reserve Bank Of India Chief: Transmission Has Been Broad Based Across Sectors, Satisfactory

Share

Reserve Bank Of India Chief: As Of Nov 28, India's Forex Reserves Stood At $686 Billion

Share

Reserve Bank Of India Chief: Healthy Services Exports With Strong Remittances To Keep Cad Modest In This Year

Share

Reserve Bank Of India Chief: CPI Inflation Seen At 0.6% In Q3 Fy26

Share

Reserve Bank Of India Chief: Fy26 CPI Inflation Seen At 2% Versus 2.6% Previously

Share

India's Nifty Realty Index Up 1% After Reserve Bank Of India's Rate Cut

Share

India's Nifty Psu Bank Index Turns Positive, Up 0.43% After Reserve Bank Of India's Rate Cut

Share

Reserve Bank Of India Chief: Merchandise Exports Face Some Headwinds

TIME
ACT
FCST
PREV
Turkey Trade Balance

A:--

F: --

P: --

Germany Construction PMI (SA) (Nov)

A:--

F: --

P: --

Euro Zone IHS Markit Construction PMI (Nov)

A:--

F: --

P: --

Italy IHS Markit Construction PMI (Nov)

A:--

F: --

P: --

U.K. Markit/CIPS Construction PMI (Nov)

A:--

F: --

P: --

France 10-Year OAT Auction Avg. Yield

A:--

F: --

P: --

Euro Zone Retail Sales MoM (Oct)

A:--

F: --

P: --

Euro Zone Retail Sales YoY (Oct)

A:--

F: --

P: --

Brazil GDP YoY (Q3)

A:--

F: --

P: --

U.S. Challenger Job Cuts (Nov)

A:--

F: --

P: --

U.S. Challenger Job Cuts MoM (Nov)

A:--

F: --

P: --

U.S. Challenger Job Cuts YoY (Nov)

A:--

F: --

P: --

U.S. Initial Jobless Claims 4-Week Avg. (SA)

A:--

F: --

P: --

U.S. Weekly Initial Jobless Claims (SA)

A:--

F: --

P: --

U.S. Weekly Continued Jobless Claims (SA)

A:--

F: --

P: --

Canada Ivey PMI (SA) (Nov)

A:--

F: --

P: --

Canada Ivey PMI (Not SA) (Nov)

A:--

F: --

P: --

U.S. Non-Defense Capital Durable Goods Orders Revised MoM (Excl. Aircraft) (SA) (Sept)

A:--

F: --

P: --
U.S. Factory Orders MoM (Excl. Transport) (Sept)

A:--

F: --

P: --

U.S. Factory Orders MoM (Sept)

A:--

F: --

P: --

U.S. Factory Orders MoM (Excl. Defense) (Sept)

A:--

F: --

P: --

U.S. EIA Weekly Natural Gas Stocks Change

A:--

F: --

P: --

Saudi Arabia Crude Oil Production

A:--

F: --

P: --

U.S. Weekly Treasuries Held by Foreign Central Banks

A:--

F: --

P: --

Japan Foreign Exchange Reserves (Nov)

A:--

F: --

P: --

India Repo Rate

A:--

F: --

P: --

India Benchmark Interest Rate

A:--

F: --

P: --

India Reverse Repo Rate

A:--

F: --

P: --

India Cash Reserve Ratio

A:--

F: --

P: --

Japan Leading Indicators Prelim (Oct)

A:--

F: --

P: --

U.K. Halifax House Price Index YoY (SA) (Nov)

--

F: --

P: --

U.K. Halifax House Price Index MoM (SA) (Nov)

--

F: --

P: --

France Current Account (Not SA) (Oct)

--

F: --

P: --

France Trade Balance (SA) (Oct)

--

F: --

P: --

France Industrial Output MoM (SA) (Oct)

--

F: --

P: --

Italy Retail Sales MoM (SA) (Oct)

--

F: --

P: --

Euro Zone Employment YoY (SA) (Q3)

--

F: --

P: --

Euro Zone GDP Final YoY (Q3)

--

F: --

P: --

Euro Zone GDP Final QoQ (Q3)

--

F: --

P: --

Euro Zone Employment Final QoQ (SA) (Q3)

--

F: --

P: --

Euro Zone Employment Final (SA) (Q3)

--

F: --

P: --
Brazil PPI MoM (Oct)

--

F: --

P: --

Mexico Consumer Confidence Index (Nov)

--

F: --

P: --

Canada Unemployment Rate (SA) (Nov)

--

F: --

P: --

Canada Labor Force Participation Rate (SA) (Nov)

--

F: --

P: --

Canada Employment (SA) (Nov)

--

F: --

P: --

Canada Part-Time Employment (SA) (Nov)

--

F: --

P: --

Canada Full-time Employment (SA) (Nov)

--

F: --

P: --

U.S. Dallas Fed PCE Price Index YoY (Sept)

--

F: --

P: --

U.S. PCE Price Index YoY (SA) (Sept)

--

F: --

P: --

U.S. PCE Price Index MoM (Sept)

--

F: --

P: --

U.S. Personal Outlays MoM (SA) (Sept)

--

F: --

P: --

U.S. Core PCE Price Index MoM (Sept)

--

F: --

P: --

U.S. UMich 5-Year-Ahead Inflation Expectations Prelim YoY (Dec)

--

F: --

P: --

U.S. Core PCE Price Index YoY (Sept)

--

F: --

P: --

U.S. 5-10 Year-Ahead Inflation Expectations (Dec)

--

F: --

P: --

U.S. UMich Current Economic Conditions Index Prelim (Dec)

--

F: --

P: --

U.S. UMich Consumer Sentiment Index Prelim (Dec)

--

F: --

P: --

U.S. UMich 1-Year-Ahead Inflation Expectations Prelim (Dec)

--

F: --

P: --

U.S. UMich Consumer Expectations Index Prelim (Dec)

--

F: --

P: --

Q&A with Experts
    • All
    • Chatrooms
    • Groups
    • Friends
    Connecting
    .
    .
    .
    Type here...
    Add Symbol or Code

      No matching data

      All
      Trump Updates
      Recommend
      Stocks
      Cryptocurrencies
      Central Banks
      Featured News
      • All
      • Russia-Ukraine Conflict
      • Middle East Flashpoint
      • All
      • Russia-Ukraine Conflict
      • Middle East Flashpoint

      Search
      Products

      Charts Free Forever

      Chats Q&A with Experts
      Screeners Economic Calendar Data Tools
      Membership Features
      Data Warehouse Market Trends Institutional Data Policy Rates Macro

      Market Trends

      Market Sentiment Order Book Forex Correlations

      Top Indicators

      Charts Free Forever
      Markets

      News

      News Analysis 24/7 Columns Education
      From Institutions From Analysts
      Topics Columnists

      Latest Views

      Latest Views

      Trending Topics

      Top Columnists

      Latest Update

      Signals

      Copy Rankings Latest Signals Become a signal provider AI Rating
      Contests
      Brokers

      Overview Brokers Assessment Rankings Regulators News Claims
      Broker listing Forex Brokers Comparison Tool Live Spread Comparison Scam
      Q&A Complaint Scam Alert Videos Tips to Detect Scam
      More

      Business
      Events
      Careers About Us Advertising Help Center

      White Label

      Data API

      Web Plug-ins

      Affiliate Program

      Awards Institution Evaluation IB Seminar Salon Event Exhibition
      Vietnam Thailand Singapore Dubai
      Fans Party Investment Sharing Session
      FastBull Summit BrokersView Expo
      Recent Searches
        Top Searches
          Markets
          News
          Analysis
          User
          24/7
          Economic Calendar
          Education
          Data
          • Names
          • Latest
          • Prev

          View All

          No data

          Scan to Download

          Faster Charts, Chat Faster!

          Download App
          English
          • English
          • Español
          • العربية
          • Bahasa Indonesia
          • Bahasa Melayu
          • Tiếng Việt
          • ภาษาไทย
          • Français
          • Italiano
          • Türkçe
          • Русский язык
          • 简中
          • 繁中
          Open Account
          Search
          Products
          Charts Free Forever
          Markets
          News
          Signals

          Copy Rankings Latest Signals Become a signal provider AI Rating
          Contests
          Brokers

          Overview Brokers Assessment Rankings Regulators News Claims
          Broker listing Forex Brokers Comparison Tool Live Spread Comparison Scam
          Q&A Complaint Scam Alert Videos Tips to Detect Scam
          More

          Business
          Events
          Careers About Us Advertising Help Center

          White Label

          Data API

          Web Plug-ins

          Affiliate Program

          Awards Institution Evaluation IB Seminar Salon Event Exhibition
          Vietnam Thailand Singapore Dubai
          Fans Party Investment Sharing Session
          FastBull Summit BrokersView Expo

          Is The Silver Price Preparing to Challenge Its Record High?

          FXOpen

          Commodity

          Summary:

          The United States is celebrating Thanksgiving, meaning trading activity across financial markets will be lower than usual today (and to some extent tomorrow). Yesterday, we noted a decline in volatility in the gold market.

          The United States is celebrating Thanksgiving, meaning trading activity across financial markets will be lower than usual today (and to some extent tomorrow). Yesterday, we noted a decline in volatility in the gold market.

          Against this backdrop, the silver market is drawing attention – and may not allow traders to relax. As the XAG/USD chart shows, silver has risen by more than 7% since the start of the week.

          It is reasonable to assume that the holiday-induced drop in liquidity has opened the door to broader price movements. It is not impossible that we may soon see an attempt to break the all-time high (around $54.45 per ounce), which as of this morning lies roughly 1% away.

          Technical Analysis of XAG/USD

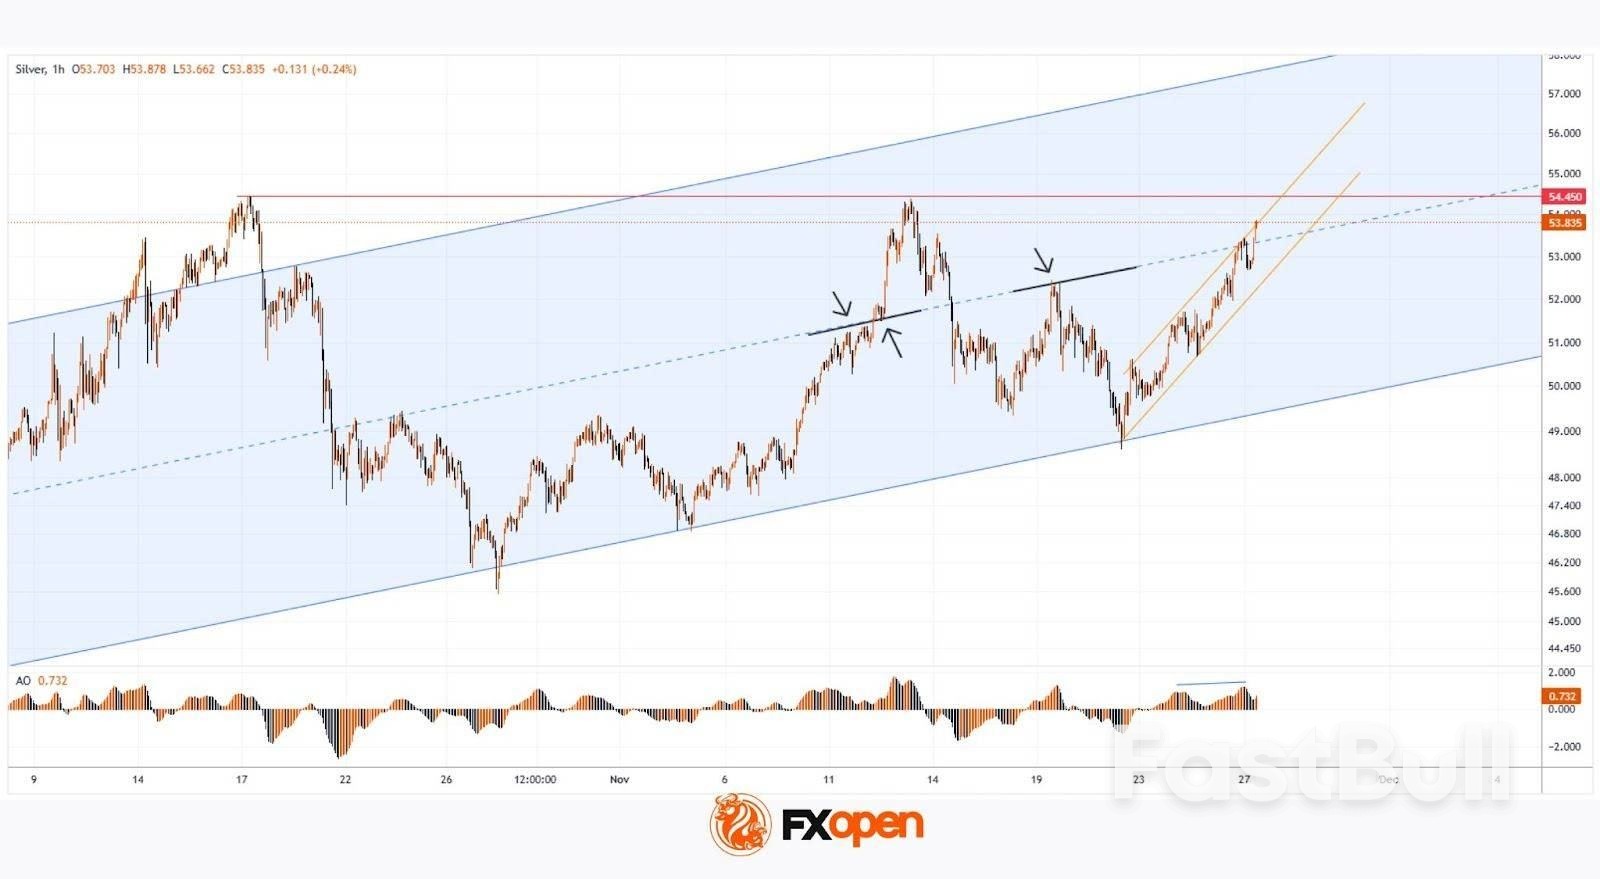
          Examining the XAG/USD chart, we can identify key swing points that allow us to outline an ascending channel. This week's strong advance has pushed silver into the upper half of that channel.

          The bulls' strength is reflected in:
          → the steep slope of the orange channel, within which we see impulsive bullish candles followed by brief corrections – a classic pattern of a strong market;
          → a higher peak on the Awesome Oscillator.

          Given this context, it is plausible that the median line could switch from resistance to support (as it has previously – shown by arrows), potentially helping the bulls gather the confidence needed to challenge the record high.

          Source: FXOpen

          Risk Warnings and Disclaimers
          You understand and acknowledge that there is a high degree of risk involved in trading. Following any strategies or investment methods may lead to potential losses. The content on the site is provided by our contributors and analysts for information purposes only. You are solely responsible for determining whether any trading assets, securities, strategy, or any other product is suitable for investing based on your own investment objectives and financial situation.
          Add to Favorites
          Share

          Chinese Tech Firms Shift AI Model Training Abroad to Circumvent U.S. Chip Restrictions

          Gerik

          Economic

          Chinese Tech Giants Turn to Southeast Asia for AI Advancement

          Facing increasingly stringent U.S. export restrictions on cutting-edge semiconductor technology, leading Chinese technology firms are reportedly shifting their AI model training operations overseas. According to a Financial Times report, companies like Alibaba and ByteDance have begun utilizing data centers in Southeast Asia to train their most recent large language models (LLMs) using Nvidia hardware specifically chips now restricted in sales to China.
          The move reflects an escalating workaround strategy by Chinese firms to maintain momentum in the highly competitive AI race, particularly in generative AI development. The Biden administration has introduced successive rounds of export controls targeting high-performance AI chips like Nvidia’s A100 and H100, widely considered critical to training sophisticated models. These restrictions, aimed at preventing China’s military and surveillance sectors from acquiring advanced computing capabilities, have unintentionally disrupted the commercial R&D pipelines of major private-sector firms as well.

          Strategic Implications for China’s AI Industry

          By outsourcing AI training tasks to offshore data centers outside U.S. jurisdiction especially in countries like Singapore, Malaysia, and Thailand Chinese companies are leveraging legal and logistical gray zones to circumvent domestic limitations. This strategy allows continued access to Nvidia’s high-powered GPUs, which remain indispensable for the computational requirements of training large-scale models, including those that rival OpenAI’s GPT or Google’s Gemini.
          This approach is not without risks. Outsourcing data-intensive operations to foreign infrastructure introduces concerns over data security, regulatory compliance, and strategic exposure. However, the shift also reflects the adaptability of Chinese tech firms as they face tightening access to core technology, especially from American and allied suppliers.

          Global AI Supply Chain Fragmentation Accelerates

          This development signals a further fragmentation of the global AI supply chain, with national security policies increasingly intersecting with commercial innovation. As Chinese firms deepen their reliance on offshore facilities for chip access, the traditional model of domestic end-to-end development becomes less viable. Meanwhile, it also underscores Southeast Asia’s emerging role as a regional AI infrastructure hub, potentially attracting increased investment from both Chinese and Western technology players seeking jurisdictional neutrality.
          The reported offshore training by Alibaba and ByteDance represents a tactical response to geopolitical technology constraints. While it allows continuity in AI development, it may also invite closer scrutiny from both U.S. and host-country regulators. More broadly, it reflects how technology firms are now compelled to recalibrate operations in response to the reshaping of global semiconductor and AI trade dynamics. As U.S.–China tech decoupling deepens, such maneuvers are likely to become more common, pushing the boundaries of innovation beyond conventional geopolitical borders.

          Source: Reuters

          To stay updated on all economic events of today, please check out our Economic calendar
          Risk Warnings and Disclaimers
          You understand and acknowledge that there is a high degree of risk involved in trading. Following any strategies or investment methods may lead to potential losses. The content on the site is provided by our contributors and analysts for information purposes only. You are solely responsible for determining whether any trading assets, securities, strategy, or any other product is suitable for investing based on your own investment objectives and financial situation.
          Add to Favorites
          Share

          German Consumer Sentiment Improves Slightly Heading Into Holidays, Survey Finds

          Michelle

          Forex

          Economic

          Consumer sentiment in Germany is set to improve slightly in December as households show more willingness to spend money ahead of the holiday season, though less rosy income prospects are preventing a stronger recovery, a survey showed on Thursday.

          The consumer sentiment index, published by the GfK market research institute and the Nuremberg Institute for Market Decisions (NIM), rose to -23.2 points for December from -24.1 points the month before, in line with analysts' expectations.

          Overall sentiment was boosted by a 3.3-point rise in consumers' willingness to buy for a second month in a row, bringing it to the same level as a year earlier at -6.0 points.

          A 2.1-point dip in their readiness to save also helped.

          "Consumer sentiment is currently at almost exactly the same level as last year. This is good news for retailers with an eye to year-end business: The data points to stable Christmas sales," said Rolf Buerkl, head of consumer climate at NIM.

          "On one hand this shows a certain stability in consumer sentiment but on the other hand, it shows that consumers do not expect a drastic recovery in the short term," he added.

          Households' economic expectations for the next 12 months fell nearly 2 points month on month, to -1.1 points, but were still 2.5 points higher compared with last year's level.

          Germany's economy is expected to grow by only 0.2% in 2025 after two years of contraction as Chancellor Friedrich Merz's spending measures need time to translate into better conditions.

          DEC NOV DEC

          2025 2025 2024

          Consumer climate -23.2 -24.1 -23.1

          Consumer climate components

          NOV OCT NOV

          2025 2025 2024

          - economic expectations -1.1 0.8 -3.6

          - income expectations -0.1 2.3 -3.5

          - willingness to buy -6.0 -9.3 -6.0

          - willingness to save 13.7 15.8 11.9

          The survey period was from October 30 to November 10, 2025.

          An indicator reading above zero signals year-on-year growth in private consumption. A value below zero indicates a drop compared with the same period a year earlier.

          According to GfK, a one-point change in the indicator corresponds to a year-on-year change of 0.1% in private consumption.

          The "willingness to buy" indicator represents the balance between positive and negative responses to the question: "Do you think now is a good time to buy major items?"

          The income expectations sub-index reflects expectations about the development of household finances in the coming 12 months.

          The economic expectations index reflects respondents' assessment of the general economic situation over the next 12 months.

          ($1 = 0.8618 euros)

          Source: Investing

          To stay updated on all economic events of today, please check out our Economic calendar
          Risk Warnings and Disclaimers
          You understand and acknowledge that there is a high degree of risk involved in trading. Following any strategies or investment methods may lead to potential losses. The content on the site is provided by our contributors and analysts for information purposes only. You are solely responsible for determining whether any trading assets, securities, strategy, or any other product is suitable for investing based on your own investment objectives and financial situation.
          Add to Favorites
          Share

          India’s Labor Reform Reshapes Workforce Landscape Amid Push for Investment and Industrial Growth

          Gerik

          Economic

          Structural Overhaul: A Reform Decades in the Making

          India’s new labor codes implemented just months after a major GST revision signal a robust push by Prime Minister Narendra Modi’s government to reshape economic fundamentals. By merging 29 fragmented laws into four streamlined labor codes, the government is addressing a long-standing barrier to industrial expansion: rigid labor regulation. These changes are set against the broader ambition of achieving a $10 trillion economy by 2047.
          The reforms aim to create a unified framework for employment, social security, wages, and occupational safety. For investors and multinational manufacturers, this simplification offers a clearer compliance path. HSBC has noted that restrictive labor laws historically discouraged firms from scaling due to high compliance burdens, preventing them from realizing economies of scale. The removal of such barriers could catalyze industrial growth and attract both foreign direct investment and domestic capital.

          Balancing Flexibility with Worker Protections

          At the heart of the new codes is a dual objective: increase formal workforce participation while protecting worker rights. Gig workers, previously excluded from welfare programs, will now gain access to social security. Startups must allocate up to 2% of their turnover to welfare funds for these workers, institutionalizing a social safety net in one of India’s fastest-growing employment segments.
          The extension of permanent employee benefits leave, medical coverage, and social security to fixed-term and contract workers is expected to raise labor costs significantly in labor-intensive sectors such as construction, real estate, and manufacturing. Real estate developers like Tru Realty estimate a 5%–10% increase in baseline labor costs over the next 18 months. However, this rise may be partially offset by productivity improvements made possible by new provisions such as longer shift durations and simplified retrenchment processes.

          Political Resistance and Legal Implications

          Despite its economic rationale, the reform has faced immediate pushback from labor unions and opposition parties. Protests erupted across cities like Hyderabad, with union leaders criticizing the government for allegedly pushing through reforms without adequate stakeholder consultation. Notably, the threshold for mandatory government permission for retrenchment has been raised from 100 to 300 employees, which trade unions argue weakens worker bargaining power and restricts their right to strike.
          The legal flexibility granted to states in implementing procedural rules could lead to policy fragmentation. While the central government will set a national minimum wage floor, individual states retain authority to enforce higher standards or tweak operational thresholds, creating possible regulatory divergence. Experts such as BDO India’s Preeti Sharma suggest that this divergence could reflect states’ competition for investment, much like China's provincial strategies.

          E-commerce and Gig Economy Under Pressure

          India’s booming gig economy, projected to grow from 10 million workers in FY2025 to over 23 million by FY2030, will be directly affected. E-commerce platforms and delivery service providers such as Zomato, Swiggy, and Amazon face the dual challenge of rising labor costs and reduced flexibility. Legal experts warn that mandated welfare contributions and minimum wage adjustments may compress operating margins, at least in the short term, with those costs eventually passed on to consumers.
          Yet, major aggregators have responded with cautious optimism, welcoming the move as a step toward institutional legitimacy for platform-based work. This response suggests a broader acceptance that long-term scalability of gig platforms depends on improved trust and transparency with the labor force.
          India's labor market is overwhelmingly informal, with only around 1 million of its estimated 63 million enterprises formally registered. The new codes aim to bridge this divide by reducing bureaucratic hurdles. Observer Research Foundation highlights that simplified documentation and digital compliance mechanisms reduce the burden of corruption and administrative discretion, encouraging informal businesses to transition into the formal economy.
          While the initial transition may increase regulatory compliance costs, the broader economic rationale hinges on the belief that formalization will lead to improved productivity, better tax compliance, and stronger legal protections for workers factors that could boost long-term investor confidence.

          A Reform with Short-Term Pain, Long-Term Gain

          India’s labor reform initiative is both ambitious and controversial. Its impact will vary by sector and geography, depending on how states implement operational guidelines. In the near term, businesses will face higher costs and legal ambiguity, especially those reliant on non-permanent labor. Yet, the reform’s structural goals greater formalization, scalable employment, and improved business climate align with India’s long-term growth vision.
          The ability of the central and state governments to coordinate effectively will determine whether these reforms accelerate industrialization or generate further complexity. For now, India has taken a bold step toward aligning its labor market with its aspirations as a global economic powerhouse.

          Source: CNBC

          To stay updated on all economic events of today, please check out our Economic calendar
          Risk Warnings and Disclaimers
          You understand and acknowledge that there is a high degree of risk involved in trading. Following any strategies or investment methods may lead to potential losses. The content on the site is provided by our contributors and analysts for information purposes only. You are solely responsible for determining whether any trading assets, securities, strategy, or any other product is suitable for investing based on your own investment objectives and financial situation.
          Add to Favorites
          Share

          USD/JPY Extends Decline As Yen Recovers on Intervention Fears

          Blue River

          Forex

          Technical Analysis

          The USD/JPY pair fell to 156.13 on Thursday, with the Japanese yen recouping recent losses as markets remain on high alert for potential intervention by Japanese authorities.

          Traders are speculating that the US Thanksgiving holiday, which typically sees lower liquidity and thinner market conditions, could provide a strategic "window" for regulators to intervene and support the yen. Notably, the mere risk of intervention is already acting as a deterrent, effectively capping the currency's recent decline.

          Fundamentally, sentiment is also shifting as investors reassess the Bank of Japan's (BoJ) policy trajectory. Recent media reports suggest the central bank is actively preparing for a potential rate hike as early as next month. This shift is driven by persistent inflationary pressures, the pass-through effects of a weak yen, and a perceived easing of political pressure to maintain ultra-loose monetary settings.

          Externally, the yen has found additional support from a broadly weaker US dollar. Markets have increased bets on further Fed easing, weighing on the greenback across the board.
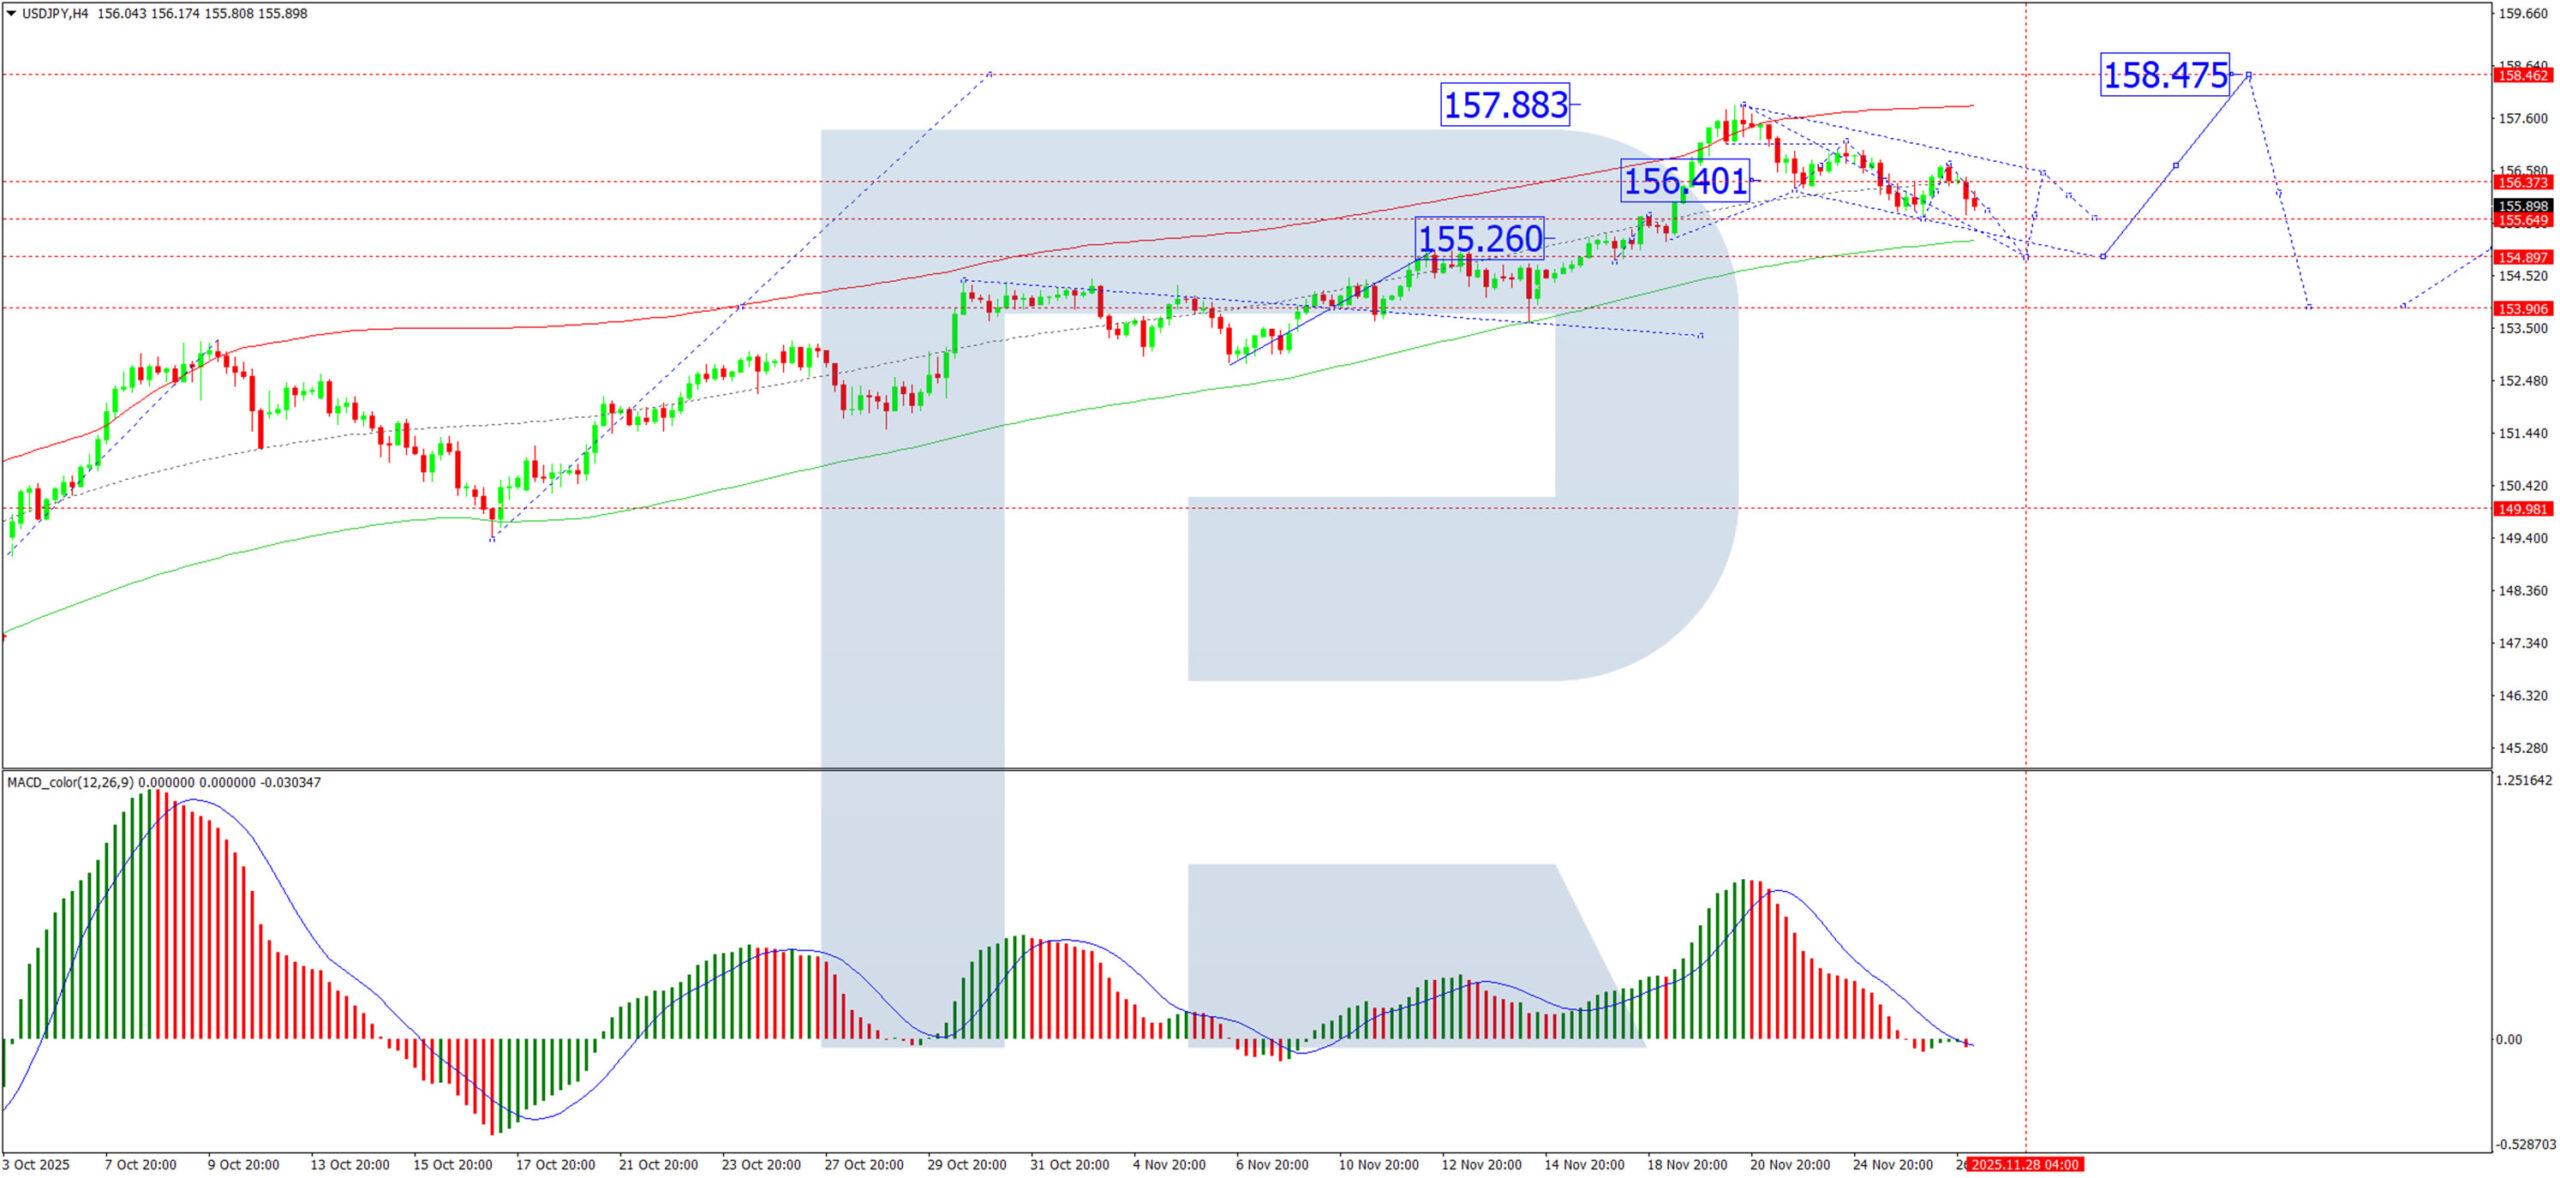
          Technical Analysis: USD/JPY

          H4 Chart:

          On the H4 chart, USD/JPY is forming a consolidation range around 156.40. We anticipate a near-term decline to 154.90, which is likely to be followed by a technical rebound to retest the 156.40 level. A decisive upward breakout above this resistance would open the path for a more significant rally towards 158.47. However, following such a move, we would expect the formation of a new lower high and the start of a fresh downward impulse, targeting 154.00 and potentially extending the correction to 153.30. The MACD indicator supports this bearish medium-term bias. Its signal line is below zero, pointing downward, confirming that selling momentum remains strong.
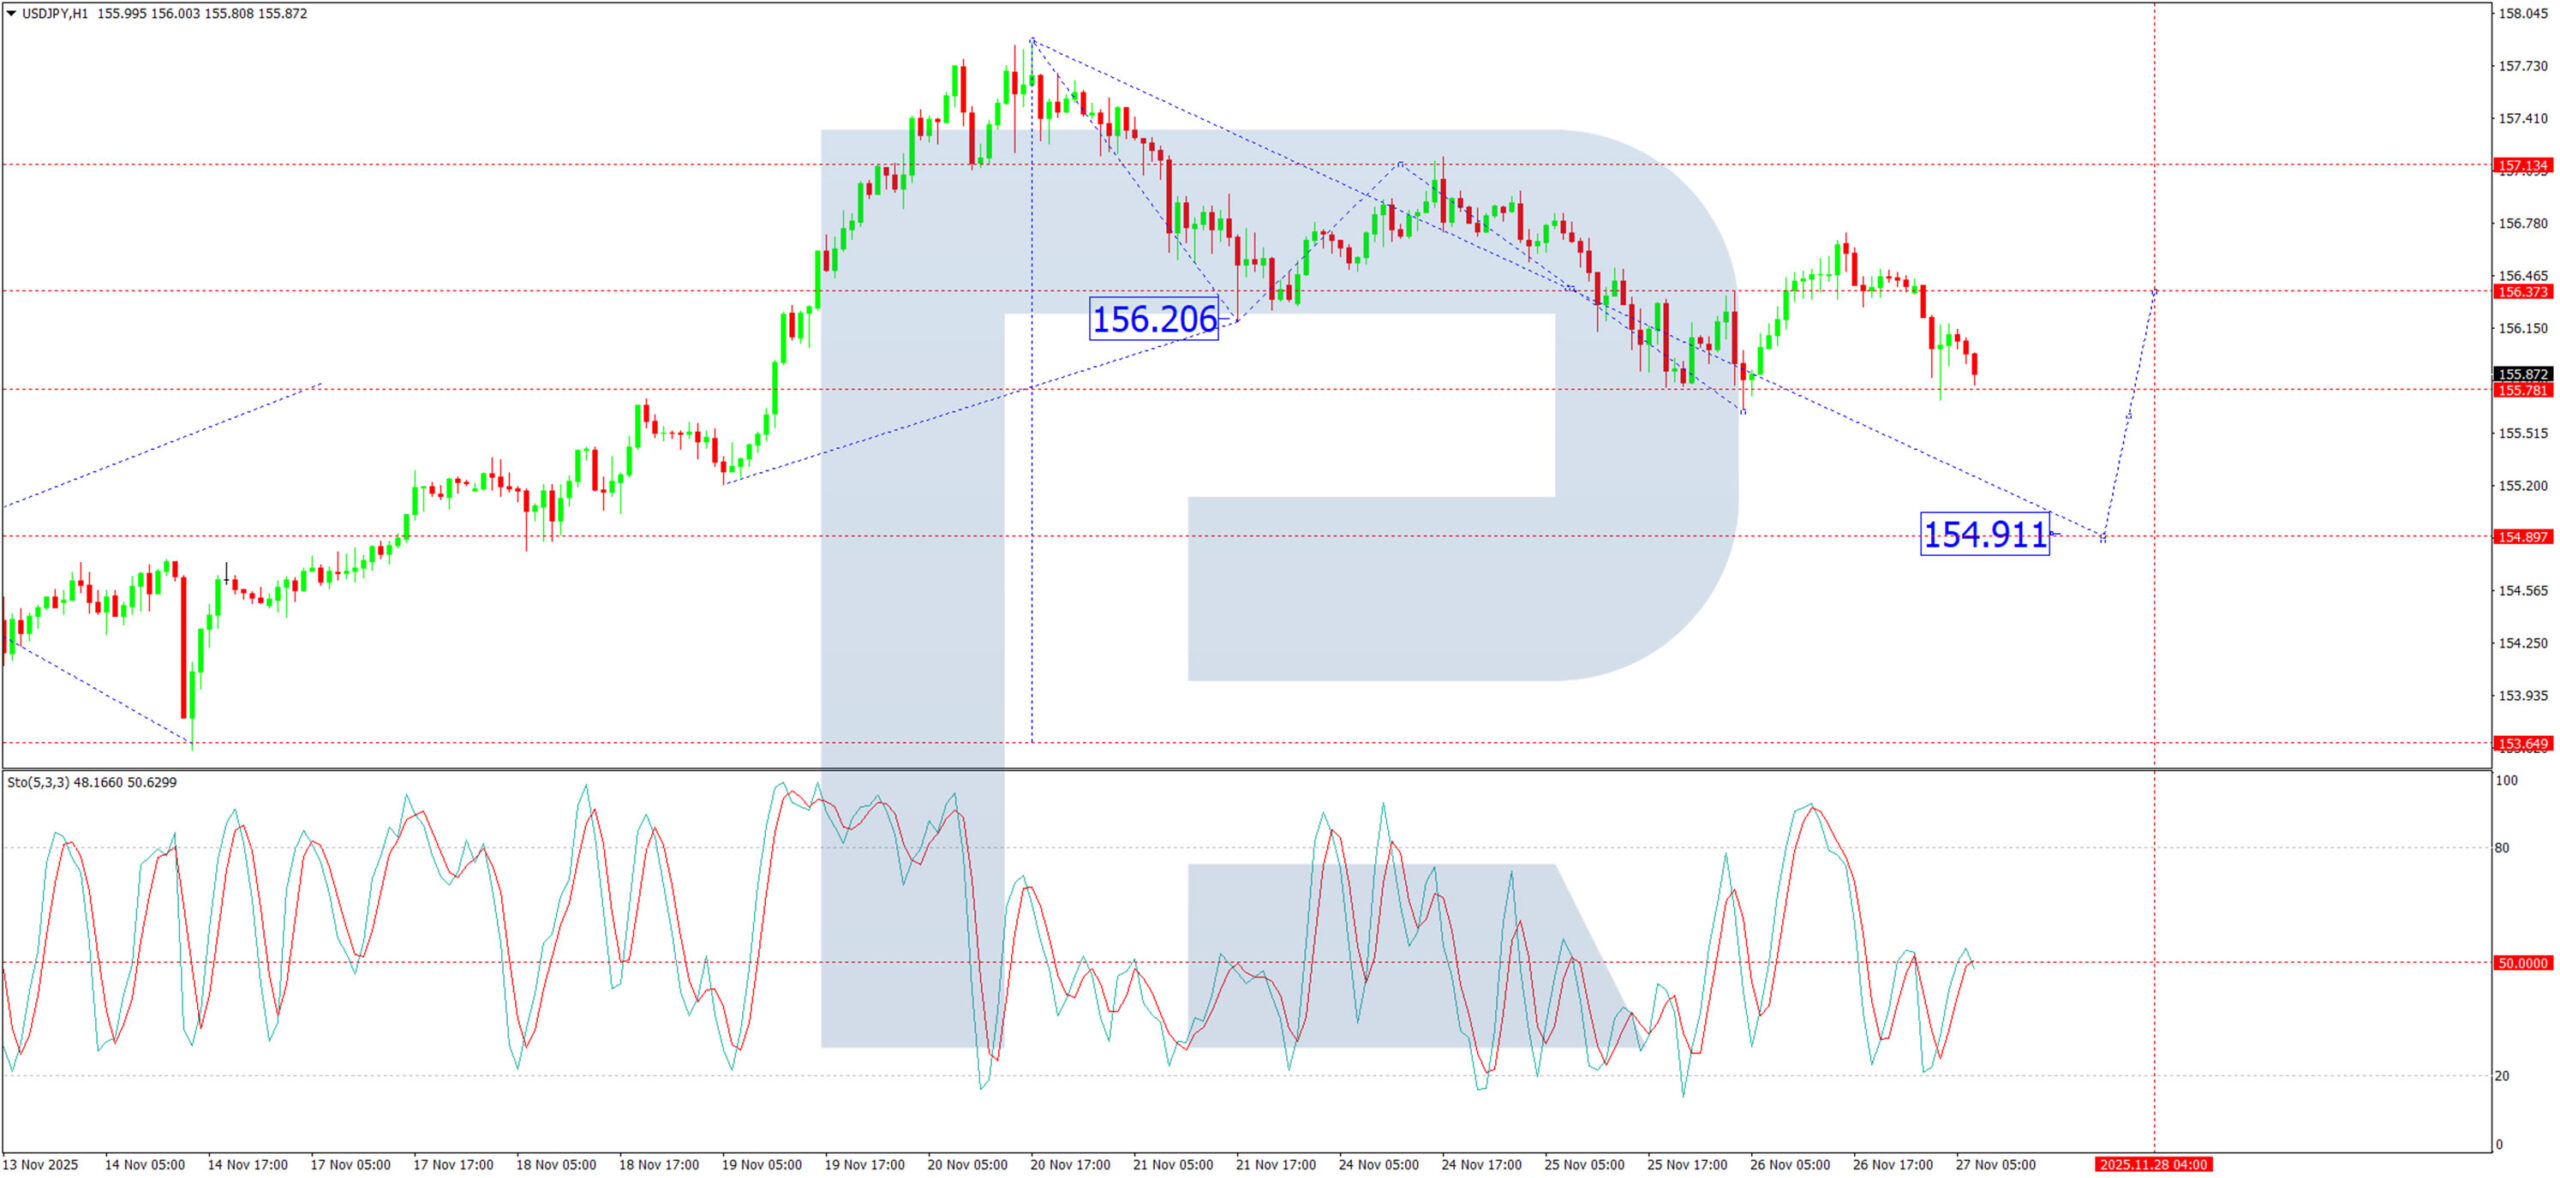
          H1 Chart:

          On the H1 chart, the pair is developing a clear downward wave structure with an initial target at 154.90. We expect this target to be reached, after which a corrective wave of growth should emerge, retesting the 156.40 level from below. The Stochastic oscillator corroborates this near-term bearish view. Its signal line is below 50 and falling towards 20, indicating that short-term downward momentum remains intact for now.

          Conclusion

          The yen is strengthening on a confluence of intervention threats and a fundamental reassessment of BoJ policy. Technically, USD/JPY is in a corrective phase with an immediate target at 154.90. While a rebound to 156.40 is expected thereafter, the broader risk is tilted to the downside. A break above 158.47 would be required to invalidate the current bearish corrective structure. Traders should remain vigilant for intervention-driven volatility, particularly during periods of low liquidity.

          Source: ACTIONFOREX

          Risk Warnings and Disclaimers
          You understand and acknowledge that there is a high degree of risk involved in trading. Following any strategies or investment methods may lead to potential losses. The content on the site is provided by our contributors and analysts for information purposes only. You are solely responsible for determining whether any trading assets, securities, strategy, or any other product is suitable for investing based on your own investment objectives and financial situation.
          Add to Favorites
          Share

          Gold (XAUUSD) & Silver Price Forecast: Dovish Fed Signals Hit Dollar, Metals Eye Breakout

          Glendon

          Commodity

          Economic

          Market Overview

          Gold softened in early European trading as improving risk sentiment and rising expectations of a December Federal Reserve rate cut pulled investors away from haven assets. Recent remarks from senior Fed officials signaled growing support for policy easing, prompting markets to reassess the US rate outlook.

          New York Fed President John Williams called policy "modestly restrictive" and said rate adjustments remain possible if inflation keeps easing. Governor Christopher Waller added that labor-market cooling provides room for a cut, while former Fed official Stephen Miran argued that weakening economic conditions warrant "a quicker shift toward neutral."

          Rate expectations moved sharply. Futures markets now assign an added 85% probability to a quarter-point cut next month, up from roughly 50% a week earlier. The shift pushed the US Dollar to a one-week low, though stronger risk appetite limited gold's upside.

          Mixed US Data Keeps Traders Cautious

          US economic figures delivered a mixed signal. Durable goods orders rose 0.5%, beating forecasts but slowing from the prior month, while unemployment claims fell to 216,000, the lowest in seven months. However, the Chicago PMI dropped to 36.3, its deepest contraction in months, highlighting ongoing business weakness.

          Despite the divergence, traders focused more on the Fed's dovish tone than the data itself, keeping pressure on gold and silver as markets rotated into risk assets.

          Silver Tracks Gold as Risk Appetite Improves

          Silver eased alongside gold, with sentiment supported by signs of progress in geopolitical negotiations and firming global equities. As an industrial-linked metal, silver remains particularly sensitive to shifting growth expectations, and the improved risk backdrop tempered haven demand.

          For now, both metals remain anchored to the Fed's policy trajectory. With markets heavily pricing in a December cut, upcoming inflation data and scheduled Fed speeches will likely guide the next move.

          Short-Term Forecast

          Gold may range between $4,122–$4,179 as traders await a breakout from the triangle, while silver holds a bullish bias above $52.26, eyeing $53.46–$54.44 if momentum strengthens.

          Gold Prices Forecast: Technical Analysis

          Gold – Chart

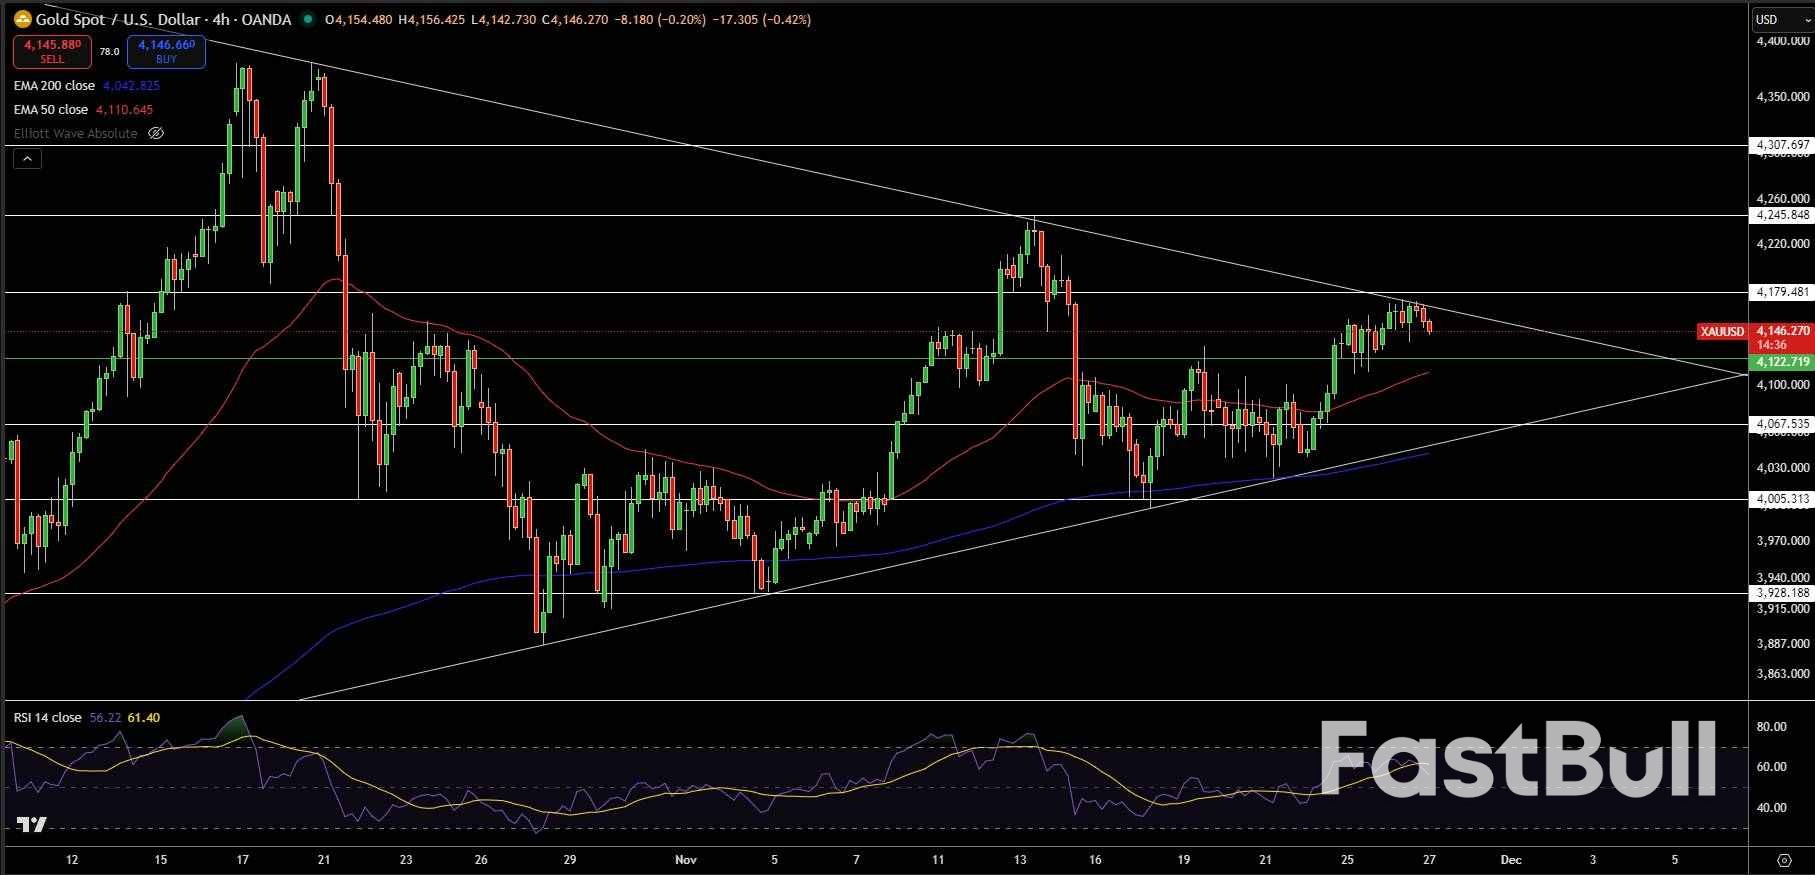
          Gold is consolidating near $4,146, trading inside a tightening symmetrical triangle that has been developing through November. The metal continues to respect its rising trendline from the November 13 low, while the upper boundary near $4,180 remains firm resistance. Price is holding above the 50-EMA and 200-EMA, signaling underlying support even as upside momentum slows.

          The RSI sits around 56, reflecting steady but controlled buying interest. A breakout above $4,179 would expose $4,245, while a close below $4,122 threatens a move back toward $4,067 and the triangle's lower trendline.

          Gold remains at an inflection point, with traders watching for a decisive break before positioning for the next directional move.
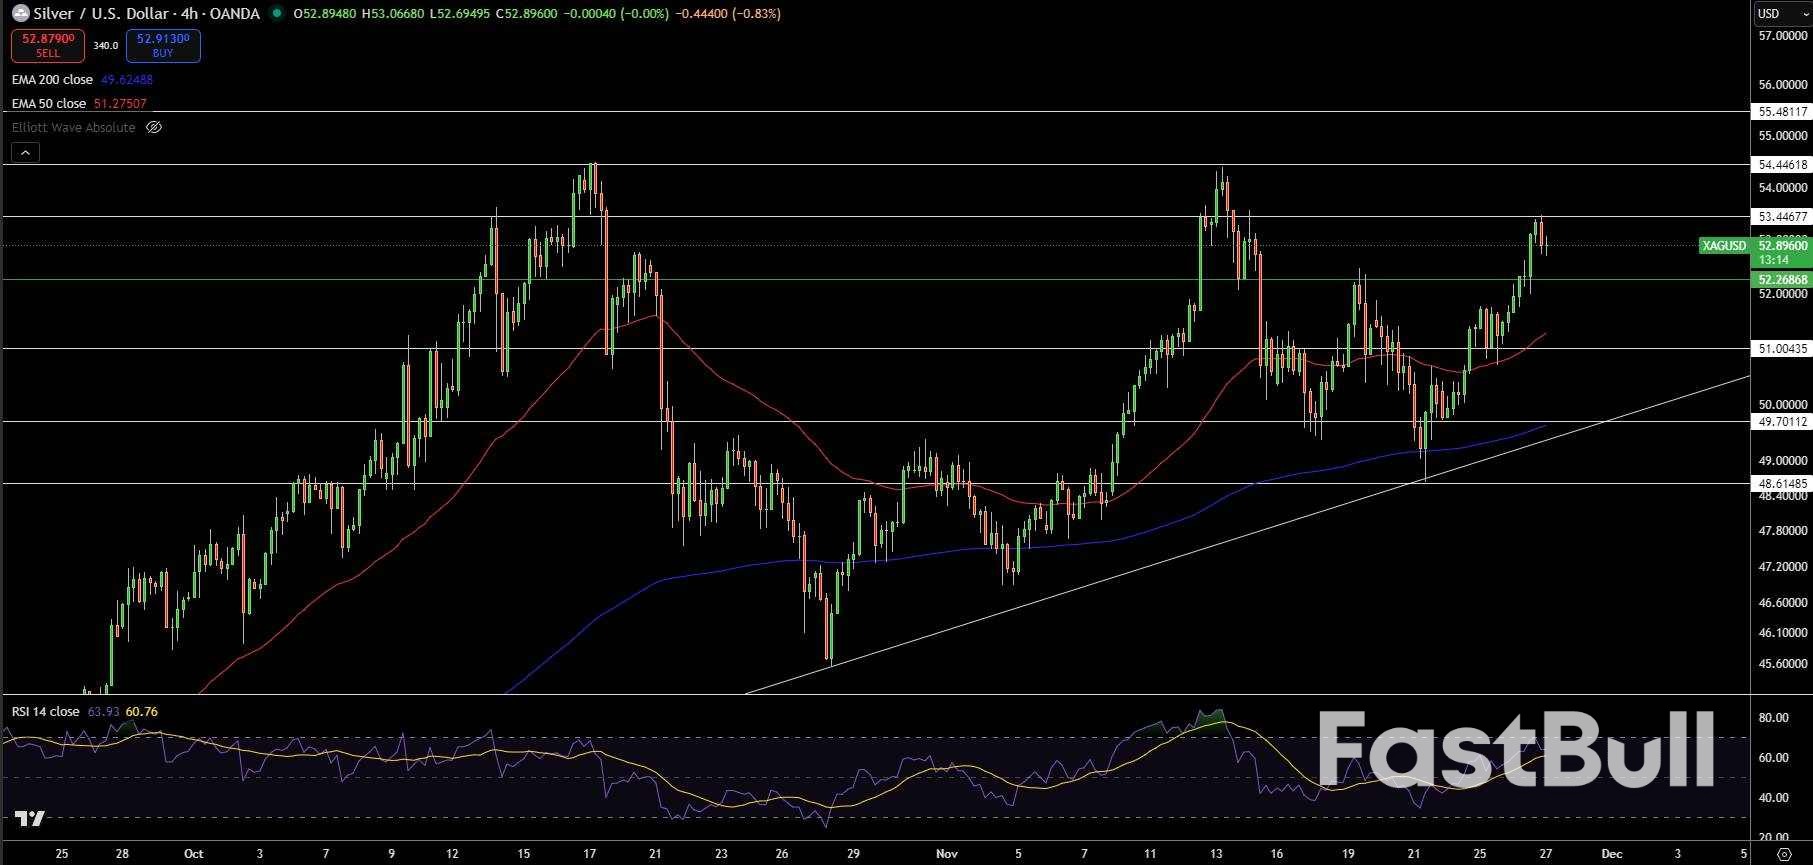
          Silver (XAG/USD) Price Forecast: Technical Outlook

          Silver – Chart

          Silver is consolidating near $52.89, holding firmly above the key support at $52.26 after a strong recovery from the $49.70 region. Price continues to trade above the 50-EMA and 200-EMA, signaling a stable bullish bias while respecting the broader ascending trendline from late October. The RSI sits around 63, showing improving momentum without overextended conditions.

          Immediate resistance is positioned at $53.46, a level that capped the previous rally. A decisive break above this zone could open a continuation move toward $54.44.

          If sellers return, support at $52.26 and $51.00 becomes the first downside cushion. Silver remains in a constructive structure, with traders watching for a clean breakout before confirming the next direction.

          Source: FX Empire

          To stay updated on all economic events of today, please check out our Economic calendar
          Risk Warnings and Disclaimers
          You understand and acknowledge that there is a high degree of risk involved in trading. Following any strategies or investment methods may lead to potential losses. The content on the site is provided by our contributors and analysts for information purposes only. You are solely responsible for determining whether any trading assets, securities, strategy, or any other product is suitable for investing based on your own investment objectives and financial situation.
          Add to Favorites
          Share

          Asian Markets Rally on Wall Street Momentum as Fed Rate Cut Bets Strengthen

          Gerik

          Economic

          Stocks

          Asian Equities Climb as Global Markets Ride Wall Street’s Upward Wave

          Equity markets across Asia traded higher on Thursday, drawing clear momentum from Wall Street's sustained rally. The Nasdaq, S&P 500, and Dow Jones all posted solid gains for a fourth straight session, with investor sentiment buoyed by rising confidence in a forthcoming U.S. interest rate cut.
          Japan’s Nikkei 225 jumped 1% to 50,069.33, bolstered by expectations that the Federal Reserve will lower its benchmark rate during the December 10 meeting. The rally was further amplified by reports that Tokyo plans to inject 11 trillion yen ($70.5 billion) via bond issuance into economic stimulus supporting corporate earnings prospects and financial system liquidity.

          Regional Gains Mixed as Domestic Headwinds Persist

          Elsewhere in Asia, markets also posted modest gains, though underlying data and domestic factors tempered enthusiasm. The Hang Seng index in Hong Kong rose 0.3% to 25,927.96 and the Shanghai Composite edged up 0.1% to 3,883.01. However, sentiment in China remained fragile due to lackluster industrial profit growth. Earnings at large Chinese industrial firms rose just 1.9% year-on-year in the first ten months of 2025, a marked slowdown from the previous 3.2%, indicating persistent challenges in the manufacturing and export sectors. This weak profit momentum though correlated with broader economic softness also highlights potential structural concerns that may require more forceful policy responses.
          In South Korea, the Kospi advanced 0.7% to 3,986.54 as the Bank of Korea maintained its policy rate at 2.5%, seeking to support financial stability amid rising household debt and ongoing currency weakness. This rate hold aligns with efforts to stabilize both housing markets and capital flows, suggesting that domestic policy remains tightly coupled to inflation and credit risk dynamics.
          Australia's S&P/ASX 200 inched up less than 0.1%, while Taiwan’s tech-heavy Taiex index gained 0.2%, reflecting limited movement amid regional caution and mixed earnings sentiment.

          U.S. Market Momentum Continues on Rate Cut Optimism and Strong Earnings

          In the U.S., the S&P 500 closed up 0.7% at 6,812.61, the Dow gained 0.7% to 47,427.12, and the Nasdaq climbed 0.8% to 23,214.69. The rally was supported by market participants increasingly betting at an estimated 83% probability per CME Group data that the Fed will lower rates next month. This optimism has helped reverse much of the early November selloff, particularly in rate-sensitive sectors like technology and real estate.
          Strong performances in the tech sector, led by AI-related optimism, pushed the market higher. Dell Technologies surged 5.8% on record AI server orders, while Nvidia rose 1.4%, Microsoft added 1.8%, and Broadcom advanced 3.3%. These gains suggest a continued causal link between AI infrastructure demand and equity performance in the tech space.
          Financials also participated in the rally. Robinhood Markets posted the strongest S&P 500 gain, rising 10.9% after announcing plans to launch a futures and derivatives exchange signaling a potential business model expansion and capturing investor excitement over diversified revenue streams.
          Retail stocks added further breadth to the rally. Urban Outfitters jumped 13.5% after beating Wall Street forecasts, extending a trend of upbeat retail earnings that reflect stronger-than-expected consumer demand in the final quarter of the year.

          Bond Market and Commodities Reflect Mixed Signals

          The bond market presented a nuanced picture. The 10-year Treasury yield fell to 3.99%, reflecting increased demand for long-term government securities likely driven by expectations of looser monetary policy. Meanwhile, the 2-year yield edged up to 3.48%, suggesting a slight divergence in investor views on short-term rate paths an indication of near-term uncertainty despite broader optimism.
          Oil prices fell modestly, with U.S. crude dipping 28 cents to $58.37 and Brent crude losing 33 cents to $61.84. The decline reflects a combination of anticipated supply adjustments from OPEC+ and ongoing geopolitical negotiations, particularly U.S.-led Ukraine peace talks.
          Currency movements were largely muted. The U.S. dollar softened to 156.14 yen from 156.40, while the euro made a marginal gain to $1.1609 from $1.1601. These shifts are likely the result of investors rebalancing positions ahead of expected central bank moves in both the U.S. and Japan.

          Rate Cuts, Earnings, and Liquidity Conditions to Drive Momentum

          With U.S. markets closed Thursday and trading hours shortened Friday due to the Thanksgiving holiday, volumes are expected to be light. However, market direction will remain sensitive to new economic data, forward guidance from Fed officials, and developments in corporate earnings.
          Investor focus is likely to remain fixated on December’s monetary policy decision, which may serve as the key catalyst to either extend the current rally or trigger renewed caution. Meanwhile, Asian markets will continue tracking both external sentiment and local economic data, particularly in China where industrial and property sector risks remain elevated.
          In sum, global markets are in a fragile rebound phase, driven by soft expectations of monetary easing and selective earnings strength. The sustainability of the rally, however, will depend on whether economic fundamentals can catch up with investor optimism.

          Source: AP

          To stay updated on all economic events of today, please check out our Economic calendar
          Risk Warnings and Disclaimers
          You understand and acknowledge that there is a high degree of risk involved in trading. Following any strategies or investment methods may lead to potential losses. The content on the site is provided by our contributors and analysts for information purposes only. You are solely responsible for determining whether any trading assets, securities, strategy, or any other product is suitable for investing based on your own investment objectives and financial situation.
          Add to Favorites
          Share
          FastBull
          Copyright © 2025 FastBull Ltd

          728 RM B 7/F GEE LOK IND BLDG NO 34 HUNG TO RD KWUN TONG KLN HONG KONG

          TelegramInstagramTwitterfacebooklinkedin
          App Store Google Play Google Play
          Products
          Charts

          Chats

          Q&A with Experts
          Screeners
          Economic Calendar
          Data
          Tools
          Membership
          Features
          Function
          Markets
          Copy Trading
          Latest Signals
          Contests
          News
          Analysis
          24/7
          Columns
          Education
          Company
          Careers
          About Us
          Contact Us
          Advertising
          Help Center
          Feedback
          User Agreement
          Privacy Policy
          Business

          White Label

          Data API

          Web Plug-ins

          Poster Maker

          Affiliate Program

          Risk Disclosure

          The risk of loss in trading financial instruments such as stocks, FX, commodities, futures, bonds, ETFs and crypto can be substantial. You may sustain a total loss of the funds that you deposit with your broker. Therefore, you should carefully consider whether such trading is suitable for you in light of your circumstances and financial resources.

          No decision to invest should be made without thoroughly conducting due diligence by yourself or consulting with your financial advisors. Our web content might not suit you since we don't know your financial conditions and investment needs. Our financial information might have latency or contain inaccuracy, so you should be fully responsible for any of your trading and investment decisions. The company will not be responsible for your capital loss.

          Without getting permission from the website, you are not allowed to copy the website's graphics, texts, or trademarks. Intellectual property rights in the content or data incorporated into this website belong to its providers and exchange merchants.

          Not Logged In

          Log in to access more features

          FastBull Membership

          Not yet

          Purchase

          Become a signal provider
          Help Center
          Customer Service
          Dark Mode
          Price Up/Down Colors

          Log In

          Sign Up

          Position
          Layout
          Fullscreen
          Default to Chart
          The chart page opens by default when you visit fastbull.com