

Markets
News
Analysis
User
24/7
Economic Calendar
Education
Data
- Names
- Latest
- Prev


Signal Accounts for Members
All Signal Accounts
All Contests
 Japan Tankan Small Manufacturing Outlook Index (Q4)
A:--
F: --
P: --
Japan Tankan Large Non-Manufacturing Outlook Index (Q4)A:--
F: --
P: --
Japan Tankan Large Manufacturing Outlook Index (Q4)A:--
F: --
P: --
Japan Tankan Small Manufacturing Diffusion Index (Q4)A:--
F: --
P: --
Japan Tankan Large Manufacturing Diffusion Index (Q4)A:--
F: --
P: --
Japan Tankan Large-Enterprise Capital Expenditure YoY (Q4)A:--
F: --
P: --
 U.K. Rightmove House Price Index YoY (Dec)
A:--
F: --
P: --
 China, Mainland Industrial Output YoY (YTD) (Nov)
A:--
F: --
P: --
China, Mainland Urban Area Unemployment Rate (Nov)A:--
F: --
P: --
 Saudi Arabia CPI YoY (Nov)
A:--
F: --
P: --
 Euro Zone Industrial Output YoY (Oct)
A:--
F: --
P: --
Euro Zone Industrial Output MoM (Oct)A:--
F: --
P: --
 Canada Existing Home Sales MoM (Nov)
A:--
F: --
P: --
Canada National Economic Confidence IndexA:--
F: --
P: --
Canada New Housing Starts (Nov)A:--
F: --
 U.S. NY Fed Manufacturing Employment Index (Dec)
A:--
F: --
P: --
U.S. NY Fed Manufacturing Index (Dec)A:--
F: --
P: --
Canada Core CPI YoY (Nov)A:--
F: --
P: --
Canada Manufacturing Unfilled Orders MoM (Oct)A:--
F: --
P: --
U.S. NY Fed Manufacturing Prices Received Index (Dec)A:--
F: --
P: --
U.S. NY Fed Manufacturing New Orders Index (Dec)A:--
F: --
P: --
Canada Manufacturing New Orders MoM (Oct)A:--
F: --
P: --
Canada Core CPI MoM (Nov)A:--
F: --
P: --
Canada Trimmed CPI YoY (SA) (Nov)A:--
F: --
P: --
Canada Manufacturing Inventory MoM (Oct)A:--
F: --
P: --
Canada CPI YoY (Nov)A:--
F: --
P: --
Canada CPI MoM (Nov)A:--
F: --
P: --
Canada CPI YoY (SA) (Nov)A:--
F: --
P: --
Canada Core CPI MoM (SA) (Nov)A:--
F: --
P: --
Canada CPI MoM (SA) (Nov)A:--
F: --
P: --
Federal Reserve Board Governor Milan delivered a speech U.S. NAHB Housing Market Index (Dec)--
F: --
P: --
 Australia Composite PMI Prelim (Dec)
--
F: --
P: --
Australia Services PMI Prelim (Dec)--
F: --
P: --
Australia Manufacturing PMI Prelim (Dec)--
F: --
P: --
Japan Manufacturing PMI Prelim (SA) (Dec)--
F: --
P: --
U.K. 3-Month ILO Employment Change (Oct)--
F: --
P: --
U.K. Unemployment Claimant Count (Nov)--
F: --
P: --
U.K. Unemployment Rate (Nov)--
F: --
P: --
U.K. 3-Month ILO Unemployment Rate (Oct)--
F: --
P: --
U.K. Average Weekly Earnings (3-Month Average, Including Bonuses) YoY (Oct)--
F: --
P: --
U.K. Average Weekly Earnings (3-Month Average, Excluding Bonuses) YoY (Oct)--
F: --
P: --
 France Services PMI Prelim (Dec)
--
F: --
P: --
France Composite PMI Prelim (SA) (Dec)--
F: --
P: --
France Manufacturing PMI Prelim (Dec)--
F: --
P: --
 Germany Services PMI Prelim (SA) (Dec)
--
F: --
P: --

No matching data
Latest Views
Latest Views
Trending Topics
Top Columnists
Latest Update
White Label
Data API
Web Plug-ins
Affiliate Program
View All
No data
Since last month, AUD/USD price movements have been forming a descending channel (highlighted in red), and this week’s reversal from the August high reinforces its relevance.
This week, forex traders’ attention is firmly on the AUD/USD market following key news releases from Australia:
→ Tuesday: Interest rate decision. According to ForexFactory, analysts’ forecasts were confirmed as the Reserve Bank of Australia (RBA) cut the cash rate from 3.85% to 3.60%.
→ Today: Labour market statistics revealed that the unemployment rate fell from 4.3% to 4.2%.
This dynamic fundamental backdrop has driven a rich technical setup on the AUD/USD chart, where bearish sentiment currently prevails.
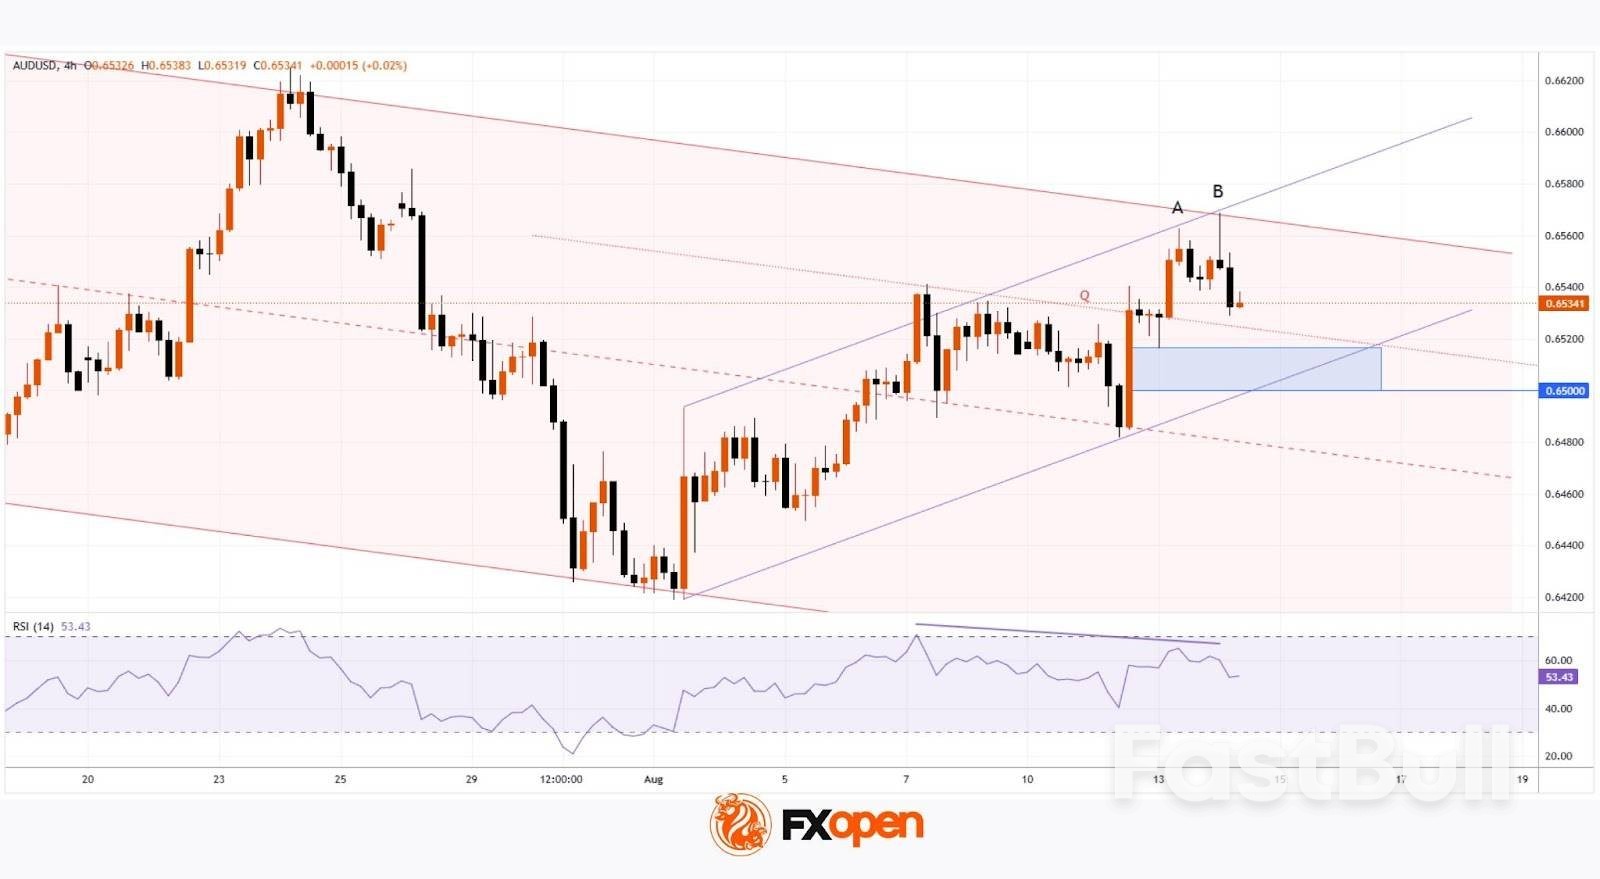
Since last month, AUD/USD price movements have been forming a descending channel (highlighted in red), and this week’s reversal from the August high reinforces its relevance.
Key factors emphasising the market’s bearish bias include:
→ Double top pattern formed by recent highs A and B. Notably, the long upper wicks of the candlesticks reflect increasing selling pressure.
→ The August upward move, marked by purple trendlines, may represent a corrective bear flag within the dominant downtrend.
→ Bearish RSI divergence – present not only between highs A and B, but also relative to the 7 July peak.
Potential Support Levels:
→ Lower purple trendline;
→ Line Q, which divides the upper half of the channel into two quarters;
→ The 0.65 psychological level – previously defended strongly by bulls, as evidenced by the wide bullish candle on 12 August, when price surged easily (a sign of buying imbalance).
These supports collectively form a key demand zone (shaded in purple). Bears will need significant momentum to break through this area and extend the prevailing downtrend in AUD/USD through August 2025.
Credit rating agency S&P Global upgraded India's long-term unsolicited sovereign credit ratings to "BBB" from "BBB-" on Thursday, citing economic resilience and sustained fiscal consolidation.
The agency had revised the outlook on India's rating in May last year to positive from stable on robust growth and improved quality of government expenditure.
"The upgrade of India reflects its buoyant economic growth, against the backdrop of an enhanced monetary policy environment that anchors inflationary expectations," the rating agency said in a statement.
"Together with the government's commitment to fiscal consolidation and efforts to improve spending quality, we believe these factors have coalesced to benefit credit metrics," it added.
The Indian rupee strengthened to 87.58 against the dollar from 87.66, while the benchmark 10-year bond yield fell 7 basis points to 6.38% soon after the announcement.
The rating agency also revised its transfer and convertibility assessment to 'A-' from 'BBB+', it said.
S&P may lower the country's ratings if it sees an erosion of political commitment to consolidate public finances, while downward pressure could also come from economic growth slowing materially on a structural basis such that it undermines fiscal sustainability, it said.
Ratings could be further raised if fiscal deficits narrow meaningfully such that the net change in general government debt falls below 6% of GDP on a structural basis, it added.
Euro zone industrial output dipped more than expected in June even as overall economic growth held up in the second quarter, challenging views that the 20 nation currency union remains resilient to the fallout from a global trade war.Industrial output fell 1.3% on the month in June, driven by a big dip in Germany and weak consumer goods production, underperforming expectations for a 1.0% fall, data from Eurostat showed on Thursday.
Adding to the negative surprise, Eurostat also revised its output growth estimate for May to 1.1% from 1.7%, suggesting that the underlying trend is weaker than thought.Meanwhile GDP grew by 0.1% on the quarter, in line with a preliminary estimate, and employment rose just 0.1% on the quarter, in line with expectations in a Reuters poll, but below the 0.2% in the previous three months.A recent string of relatively upbeat indicators from purchasing managers (PMI) data to the European Commission's sentiment reading have fuelled a narrative that consumption is keeping the bloc resilient to trade tensions, but more recent numbers, like industrial orders and a key sentiment reading from Germany, have challenged this view.
Still, investors continue to bet on a modest upturn on the premise that a recent EU trade deal with the U.S. provides much needed certainty and Germany's plans to sharply boost budget spending will support growth.This is why financial investors think the ECB may be done cutting interest rates and policymakers will sit out a temporary dip in inflation below the 2% target, as price pressures over the medium term are already building up.Growth is unlikely to take off, however, and the euro zone is facing modest expansion of only around 1% a year in the coming years, trailing other major economies, given structural inefficiencies.
Compared to a year earlier, second quarter economic growth was 1.4%, a figure that is boosted by a one-off demand surge before U.S. tariffs took effect. This figure is now seen slowing steadily before picking up in 2026.The monthly industrial fall was driven by a 2.3% drop in Germany and an 11.3% fall in Ireland, a figure that is unlikely to concern many, since Irish data is exceptionally volatile due to activity among big multinational companies, mostly in pharmaceuticals, based there for tax purposes.Industry figures showed that besides energy production, every sector took a dip last month, led by a 4.7% fall in non-durable consumer goods and a 2.2% fall in capital goods production.
728 RM B 7/F GEE LOK IND BLDG NO 34 HUNG TO RD KWUN TONG KLN HONG KONG


White Label
Data API
Web Plug-ins
Poster Maker
Affiliate Program
The risk of loss in trading financial instruments such as stocks, FX, commodities, futures, bonds, ETFs and crypto can be substantial. You may sustain a total loss of the funds that you deposit with your broker. Therefore, you should carefully consider whether such trading is suitable for you in light of your circumstances and financial resources.
No decision to invest should be made without thoroughly conducting due diligence by yourself or consulting with your financial advisors. Our web content might not suit you since we don't know your financial conditions and investment needs. Our financial information might have latency or contain inaccuracy, so you should be fully responsible for any of your trading and investment decisions. The company will not be responsible for your capital loss.
Without getting permission from the website, you are not allowed to copy the website's graphics, texts, or trademarks. Intellectual property rights in the content or data incorporated into this website belong to its providers and exchange merchants.
Not Logged In
Log in to access more features

FastBull Membership
Not yet
Purchase


Log In
Sign Up


