• Trade
  • Markets
  • Copy
  • Contests
  • News
  • 24/7
  • Calendar
  • Q&A
  • Chats
Trending
Screeners
SYMBOL
LAST
BID
ASK
HIGH
LOW
NET CHG.
%CHG.
SPREAD
SPX
S&P 500 Index
6870.39
6870.39
6870.39
6895.79
6858.28
+13.27
+ 0.19%
--
DJI
Dow Jones Industrial Average
47954.98
47954.98
47954.98
48133.54
47871.51
+104.05
+ 0.22%
--
IXIC
NASDAQ Composite Index
23578.12
23578.12
23578.12
23680.03
23506.00
+72.99
+ 0.31%
--
USDX
US Dollar Index
98.820
98.900
98.820
98.960
98.810
-0.130
-0.13%
--
EURUSD
Euro / US Dollar
1.16548
1.16556
1.16548
1.16551
1.16341
+0.00122
+ 0.10%
--
GBPUSD
Pound Sterling / US Dollar
1.33413
1.33423
1.33413
1.33420
1.33151
+0.00101
+ 0.08%
--
XAUUSD
Gold / US Dollar
4211.78
4212.16
4211.78
4213.06
4190.61
+13.87
+ 0.33%
--
WTI
Light Sweet Crude Oil
59.988
60.025
59.988
60.063
59.752
+0.179
+ 0.30%
--

Community Accounts

Signal Accounts
--
Profit Accounts
--
Loss Accounts
--
View More

Become a signal provider

Sell trading signals to earn additional income

View More

Guide to Copy Trading

Get started with ease and confidence

View More

Signal Accounts for Members

All Signal Accounts

Best Return
  • Best Return
  • Best P/L
  • Best MDD
Past 1W
  • Past 1W
  • Past 1M
  • Past 1Y

All Contests

  • All
  • Trump Updates
  • Recommend
  • Stocks
  • Cryptocurrencies
  • Central Banks
  • Featured News
Top News Only
Share

Russia's Air Defences Destroy 67 Ukrainian Drones Overnight, RIA Agency Reports

Share

India's Nifty 50 Index Down 0.37%

Share

Hsi Down 287 Pts, Hsti Down 13 Pts, Pop Mart Down Over 8%, Ping An Hit New Highs

Share

China's November Coal Imports Down 20% Year-On-Year

Share

At Least One Thai Soldier Killed And 7 Wounded - Thai Army Spokesman

Share

India's Nifty Bank Futures Up 0.73% In Pre-Open Trade

Share

Cambodia Has Expanded Clashes To Several New Locations - Thai Army Spokesman

Share

Cambodian Military Has Increased Deployment Of Troops And Weapons - Thai Army Spokesman

Share

India's Nifty 50 Futures Up 0.53% In Pre-Open Trade

Share

India's Nifty 50 Index Down 0.1% In Pre-Open Trade

Share

Indian Rupee Opens Down 0.1% At 90.0625 Per USA Dollar, Versus 89.98 Previous Close

Share

China November Copper Imports At 427000 Tonnes

Share

China November Coal Imports At 44.05 Million Tonnes

Share

China November Iron Ore Imports At 110.54 Million Tonnes, Down 0.7 % From October

Share

China November Meat Imports At 393000 Tonnes

Share

China Imported 8.11 Million Tonnes Of Soy In November

Share

China November Crude Oil Imports Up 5.2 % From October

Share

China November Rare Earth Exports At 5493.9 Tonnes

Share

China Jan-Nov Iron Ore Imports Up 1.4% At 1.139 Billion Metric Tons

Share

China Jan-Nov Trade Balance 7708.1 Billion Yuan

TIME
ACT
FCST
PREV
U.S. Personal Income MoM (Sept)

A:--

F: --

P: --

U.S. PCE Price Index YoY (SA) (Sept)

A:--

F: --

P: --

U.S. PCE Price Index MoM (Sept)

A:--

F: --

P: --

U.S. Personal Outlays MoM (SA) (Sept)

A:--

F: --

P: --

U.S. Core PCE Price Index MoM (Sept)

A:--

F: --

P: --

U.S. Core PCE Price Index YoY (Sept)

A:--

F: --

P: --

U.S. UMich 5-Year-Ahead Inflation Expectations Prelim YoY (Dec)

A:--

F: --

P: --

U.S. Real Personal Consumption Expenditures MoM (Sept)

A:--

F: --

P: --

U.S. UMich Current Economic Conditions Index Prelim (Dec)

A:--

F: --

P: --

U.S. UMich Consumer Sentiment Index Prelim (Dec)

A:--

F: --

P: --

U.S. UMich 1-Year-Ahead Inflation Expectations Prelim (Dec)

A:--

F: --

P: --

U.S. UMich Consumer Expectations Index Prelim (Dec)

A:--

F: --

P: --

U.S. Weekly Total Rig Count

A:--

F: --

P: --

U.S. Weekly Total Oil Rig Count

A:--

F: --

P: --

U.S. Unit Labor Cost Prelim (SA) (Q3)

--

F: --

P: --

U.S. Consumer Credit (SA) (Oct)

A:--

F: --

P: --

China, Mainland Foreign Exchange Reserves (Nov)

A:--

F: --

P: --

Japan Wages MoM (Oct)

A:--

F: --

P: --

Japan Trade Balance (Oct)

A:--

F: --

P: --

Japan Nominal GDP Revised QoQ (Q3)

A:--

F: --

P: --

Japan Trade Balance (Customs Data) (SA) (Oct)

A:--

F: --

P: --

Japan GDP Annualized QoQ Revised (Q3)

A:--

F: --

P: --
China, Mainland Exports YoY (CNH) (Nov)

A:--

F: --

P: --

China, Mainland Imports YoY (CNH) (Nov)

A:--

F: --

P: --

China, Mainland Exports (Nov)

A:--

F: --

P: --

China, Mainland Imports (CNH) (Nov)

A:--

F: --

P: --

China, Mainland Trade Balance (CNH) (Nov)

A:--

F: --

P: --

China, Mainland Imports YoY (USD) (Nov)

A:--

F: --

P: --

China, Mainland Exports YoY (USD) (Nov)

A:--

F: --

P: --

China, Mainland Trade Balance (USD) (Nov)

A:--

F: --

P: --

Germany Industrial Output MoM (SA) (Oct)

--

F: --

P: --

Euro Zone Sentix Investor Confidence Index (Dec)

--

F: --

P: --

Canada Leading Index MoM (Nov)

--

F: --

P: --

Canada National Economic Confidence Index

--

F: --

P: --

U.S. Dallas Fed PCE Price Index YoY (Sept)

--

F: --

P: --

China, Mainland Trade Balance (USD) (Nov)

--

F: --

P: --

U.S. 3-Year Note Auction Yield

--

F: --

P: --

U.K. BRC Overall Retail Sales YoY (Nov)

--

F: --

P: --

U.K. BRC Like-For-Like Retail Sales YoY (Nov)

--

F: --

P: --

Australia Overnight (Borrowing) Key Rate

--

F: --

P: --

RBA Rate Statement
RBA Press Conference
Germany Exports MoM (SA) (Oct)

--

F: --

P: --

U.S. NFIB Small Business Optimism Index (SA) (Nov)

--

F: --

P: --

Mexico Core CPI YoY (Nov)

--

F: --

P: --

Mexico 12-Month Inflation (CPI) (Nov)

--

F: --

P: --

Mexico PPI YoY (Nov)

--

F: --

P: --

Mexico CPI YoY (Nov)

--

F: --

P: --

U.S. Weekly Redbook Index YoY

--

F: --

P: --

U.S. JOLTS Job Openings (SA) (Oct)

--

F: --

P: --

China, Mainland M2 Money Supply YoY (Nov)

--

F: --

P: --

China, Mainland M0 Money Supply YoY (Nov)

--

F: --

P: --

China, Mainland M1 Money Supply YoY (Nov)

--

F: --

P: --

U.S. EIA Short-Term Crude Production Forecast For The Next Year (Dec)

--

F: --

P: --

U.S. EIA Short-Term Crude Production Forecast For The Year (Dec)

--

F: --

P: --

U.S. EIA Natural Gas Production Forecast For The Next Year (Dec)

--

F: --

P: --

EIA Monthly Short-Term Energy Outlook
U.S. 10-Year Note Auction Avg. Yield

--

F: --

P: --

U.S. API Weekly Cushing Crude Oil Stocks

--

F: --

P: --

U.S. API Weekly Crude Oil Stocks

--

F: --

P: --

Q&A with Experts
    • All
    • Chatrooms
    • Groups
    • Friends
    Connecting
    .
    .
    .
    Type here...
    Add Symbol or Code

      No matching data

      All
      Trump Updates
      Recommend
      Stocks
      Cryptocurrencies
      Central Banks
      Featured News
      • All
      • Russia-Ukraine Conflict
      • Middle East Flashpoint
      • All
      • Russia-Ukraine Conflict
      • Middle East Flashpoint

      Search
      Products

      Charts Free Forever

      Chats Q&A with Experts
      Screeners Economic Calendar Data Tools
      Membership Features
      Data Warehouse Market Trends Institutional Data Policy Rates Macro

      Market Trends

      Market Sentiment Order Book Forex Correlations

      Top Indicators

      Charts Free Forever
      Markets

      News

      News Analysis 24/7 Columns Education
      From Institutions From Analysts
      Topics Columnists

      Latest Views

      Latest Views

      Trending Topics

      Top Columnists

      Latest Update

      Signals

      Copy Rankings Latest Signals Become a signal provider AI Rating
      Contests
      Brokers

      Overview Brokers Assessment Rankings Regulators News Claims
      Broker listing Forex Brokers Comparison Tool Live Spread Comparison Scam
      Q&A Complaint Scam Alert Videos Tips to Detect Scam
      More

      Business
      Events
      Careers About Us Advertising Help Center

      White Label

      Data API

      Web Plug-ins

      Affiliate Program

      Awards Institution Evaluation IB Seminar Salon Event Exhibition
      Vietnam Thailand Singapore Dubai
      Fans Party Investment Sharing Session
      FastBull Summit BrokersView Expo
      Recent Searches
        Top Searches
          Markets
          News
          Analysis
          User
          24/7
          Economic Calendar
          Education
          Data
          • Names
          • Latest
          • Prev

          View All

          No data

          Scan to Download

          Faster Charts, Chat Faster!

          Download App
          English
          • English
          • Español
          • العربية
          • Bahasa Indonesia
          • Bahasa Melayu
          • Tiếng Việt
          • ภาษาไทย
          • Français
          • Italiano
          • Türkçe
          • Русский язык
          • 简中
          • 繁中
          Open Account
          Search
          Products
          Charts Free Forever
          Markets
          News
          Signals

          Copy Rankings Latest Signals Become a signal provider AI Rating
          Contests
          Brokers

          Overview Brokers Assessment Rankings Regulators News Claims
          Broker listing Forex Brokers Comparison Tool Live Spread Comparison Scam
          Q&A Complaint Scam Alert Videos Tips to Detect Scam
          More

          Business
          Events
          Careers About Us Advertising Help Center

          White Label

          Data API

          Web Plug-ins

          Affiliate Program

          Awards Institution Evaluation IB Seminar Salon Event Exhibition
          Vietnam Thailand Singapore Dubai
          Fans Party Investment Sharing Session
          FastBull Summit BrokersView Expo

          Bitcoin Is Absorbing Cash Coming to The Crypto

          FxPro

          Cryptocurrency

          Summary:

          Bitcoin is absorbing most of the cash coming into the digital asset market. Its share in the cryptocurrency market structure increased by 10 percentage points to 65% in the first half of 2025. This is the highest it’s been since January 2021.

          Bitcoin is absorbing most of the cash coming into the digital asset market. Its share in the cryptocurrency market structure increased by 10 percentage points to 65% in the first half of 2025. This is the highest it’s been since January 2021. In contrast the capitalisation of altcoins has fallen by $300 billion since the beginning of this year. Thanks to developed infrastructure, support from the White House and regulation, larger tokens are displacing smaller competitors.

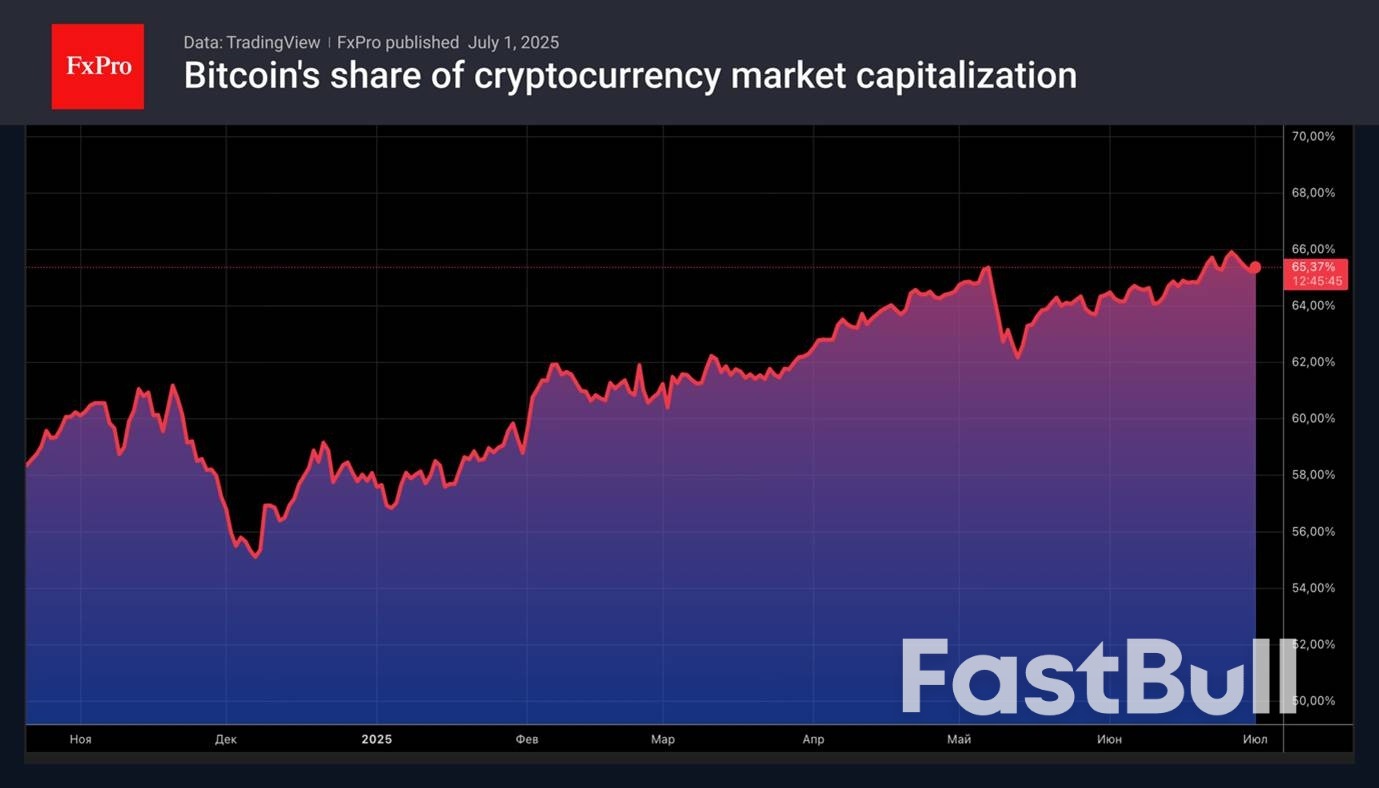
          The MarketVector Digital Assets 100 Small-Cap Index, which covers the bottom half of the 100 largest digital assets, initially doubled after Donald Trump’s election results in November. However, it then lost all its gains and fell by 50% in 2025. Bitcoin on the other hand, has risen by almost 14% since January and reached a new record high in May. Cryptocurrencies are benefiting from capital inflows into specialised exchange-traded funds and high global risk appetite.

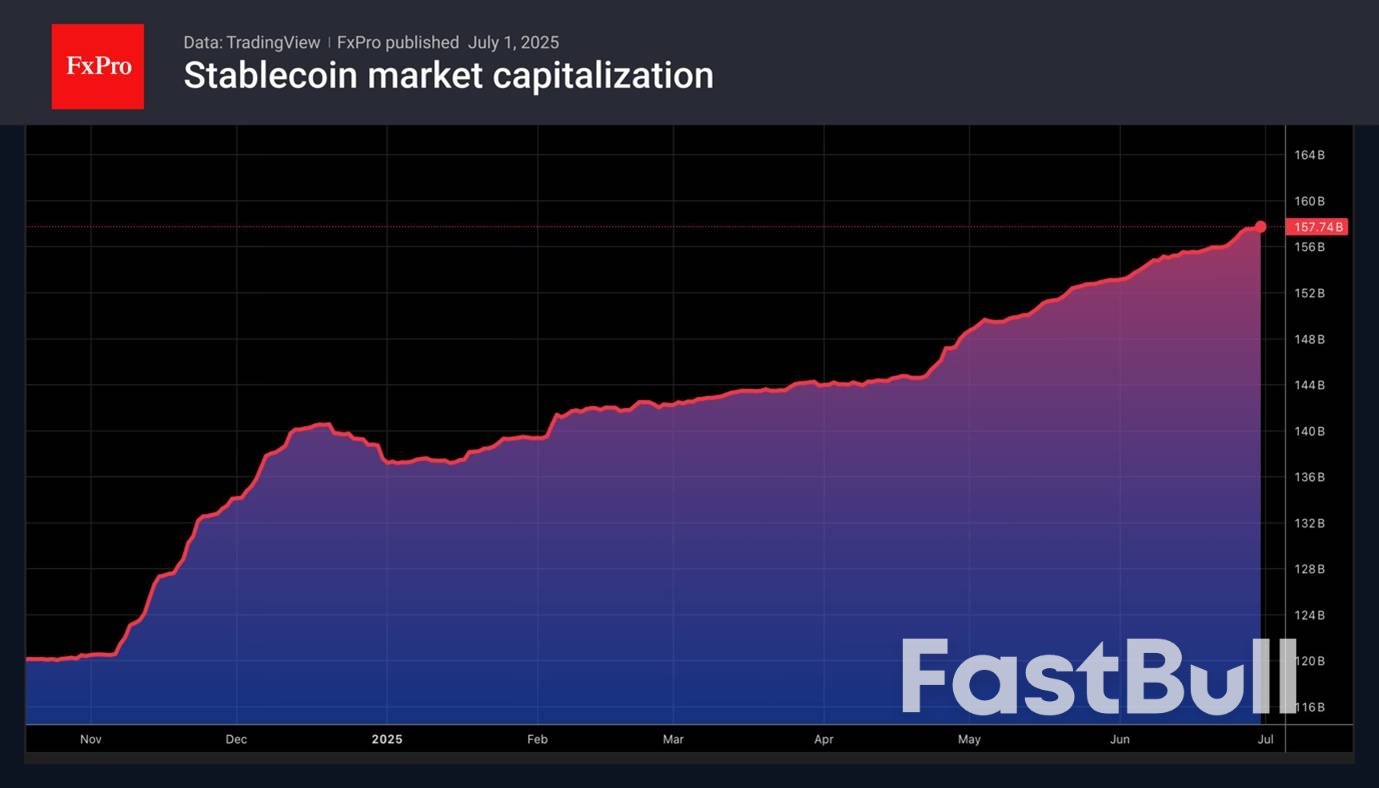
          The only competition for Bitcoin comes from stablecoins. The adoption by Congress of legislation regulating their circulation is increasing investor interest in this type of digital asset. In the first half of the year alone, the market capitalisation of stablecoins grew by $47 billion. Not only banks but also large companies such as Amazon are exploring opportunities for their implementation.

          Bitcoin is showing little interest in restoring its correlation with US stock indices. The S&P 500 and Nasdaq Composite managed to update their record highs in June, but Bitcoin is in no hurry to do so. The link between the traditional markets and crypto was broken during the armed conflict in the Middle East. Currently the digital assets leader is cautiously watching the approach of the 9th of July, the expiry date of the White House’s 90-day tariff delay.

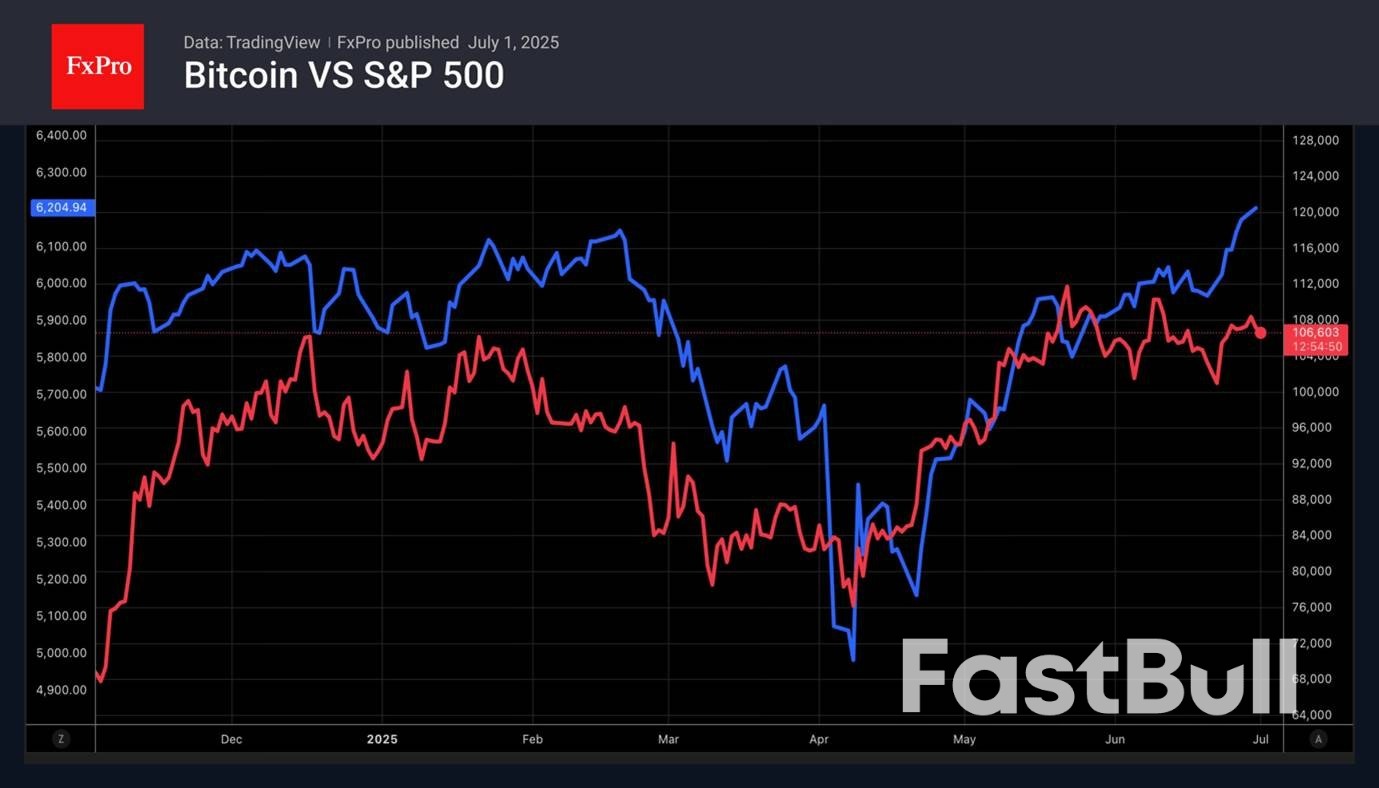
          The escalation of trade wars will increase the risks of a pullback in US stock indices. According to Bank of America, the bubble in the US stock market continues to inflate. If it bursts, all risky assets will suffer. It is not surprising that Bitcoin is cautious. On the contrary, new records for the S&P 500 will allow bitcoin bulls to aim for a new all-time high.

          Source: FxPro

          Risk Warnings and Disclaimers
          You understand and acknowledge that there is a high degree of risk involved in trading. Following any strategies or investment methods may lead to potential losses. The content on the site is provided by our contributors and analysts for information purposes only. You are solely responsible for determining whether any trading assets, securities, strategy, or any other product is suitable for investing based on your own investment objectives and financial situation.
          Add to Favorites
          Share

          Japan PM Says Determined To Protect National Interests Amid Tariff Stalemate

          Michelle

          Forex

          Economic

          Japanese Prime Minister Shigeru Ishiba said on Wednesday he was determined to protect his country's national interests as trade negotiations with the U.S. struggled and President Donald Trump threatened even higher tariff rates on the Asian ally.

          "Japan is different from other countries as we are the largest investor in the United States, creating jobs," Ishiba said in a public debate with opposition party leaders.

          "With our basic focus being on investment rather than tariffs, we'll continue to protect our national interest," he said.

          Trump on Tuesday cast doubt on a possible deal with Japan, indicating that he could impose a tariff of 30% or 35% on imports from Japan - well above the 24% rate he announced on April 2 and then paused until July 9.

          Japanese broadcaster TV Asahi reported on Wednesday that Japan's tariff negotiator Ryosei Akazawa was organising his eighth visit to the United States for trade talks as early as this weekend.

          Source: Reuters

          To stay updated on all economic events of today, please check out our Economic calendar
          Risk Warnings and Disclaimers
          You understand and acknowledge that there is a high degree of risk involved in trading. Following any strategies or investment methods may lead to potential losses. The content on the site is provided by our contributors and analysts for information purposes only. You are solely responsible for determining whether any trading assets, securities, strategy, or any other product is suitable for investing based on your own investment objectives and financial situation.
          Add to Favorites
          Share

          UBS Sees Near-term Brent Prices Sliding Despite Modest Annual Forecast Bump

          Glendon

          Economic

          Commodity

          Brent crude prices are expected to drop to the low- to mid-$60 per barrel range in the near term as traders eye an expected uptick in OPEC+ production and a seasonal slowdown in fuel demand, according to analysts at UBS.

          In a note to clients, the brokerage predicted that oil markets will see a "larger surplus" after the key summer travel period, adding that prices are anticipated to move lower from current levels.

          Crude prices were little moved Wednesday, as traders digested progress towards an Israel-Hamas ceasefire and a build in U.S. inventories ahead of an upcoming meeting of the Organization of the Petroleum Exporting Countries and its allies, a producer group known commonly as OPEC+.

          At 03:32 ET, Brent futures inched up 0.1% to $67.16 a barrel and U.S. West Texas Intermediate crude futures were unchanged at $65.45 a barrel.

          U.S. President Donald Trump on Tuesday evening said Israel had agreed to the conditions needed to finalize a 60-day ceasefire with Hamas, while also urging the Palestinian group to accept the deal.

          Meanwhile, data from the American Petroleum Institute showed that U.S. oil inventories grew 0.68 million barrels in the week to June 27, a build that followed five weeks of deep, outsized draws in U.S. oil stockpiles, and raised some questions over demand during the summer.

          For the nascent third quarter, the UBS analysts marginally raised their Brent price target by $3 to $65 a barrel, reflecting a "slightly higher risk premium in the very near term." A risk premium refers to the extra return investors want for holding oil investments.

          However, with recent ructions in oil markets cooling following a ceasefire between Israel and Iran last month, the UBS strategists said that they expect traders’ focus will "shift back to funamentals."

          "While oil demand has remained more resilient than feared and U.S. onshore activity response to lower prices has been quick, we still see the oil market moving into larger surpluses over the next three quarters," the analysts said.

          They noted that this outlook was primarily linked to potential "OPEC+ production increases," predicting that all eight of its members will lift output in August. The jump in production is likely to have a greater impact on prices after the summer "as oil demand comes off seasonally, especially in the Middle East," they said.

          Other factors that could impact oil prices include uncertainty around the OPEC+ production plans, the trajectory of sweeping U.S. tariffs, and the risk of a flare up in Israel-Iran tensions denting supply flows, the analysts said.

          Against this backdrop, they marginally raised their annual Brent price forecast by $1 to $67 per barrel.

          Source: Investing

          To stay updated on all economic events of today, please check out our Economic calendar
          Risk Warnings and Disclaimers
          You understand and acknowledge that there is a high degree of risk involved in trading. Following any strategies or investment methods may lead to potential losses. The content on the site is provided by our contributors and analysts for information purposes only. You are solely responsible for determining whether any trading assets, securities, strategy, or any other product is suitable for investing based on your own investment objectives and financial situation.
          Add to Favorites
          Share

          Eurozone Unemployment Rate Rises to 6.3% in May

          Michelle

          Economic

          Forex

          The eurozone’s unemployment rate increased to 6.3% in May from 6.2% in April, according to data released by the European Union’s statistics agency Eurostat on Wednesday.

          This small increase was contrary to economists’ expectations, as a consensus poll had predicted the rate would remain steady at 6.2%.

          Despite the rise, the unemployment rate in the 20-nation currency area remains close to historically low levels. The April figure of 6.2% had matched the eurozone’s record-low unemployment rate.

          Eurostat had previously revised March’s unemployment rate higher to 6.4%.

          The slight uptick in May comes as European companies face economic uncertainty related to tariffs and geopolitical tensions.

          Source: Investing

          To stay updated on all economic events of today, please check out our Economic calendar
          Risk Warnings and Disclaimers
          You understand and acknowledge that there is a high degree of risk involved in trading. Following any strategies or investment methods may lead to potential losses. The content on the site is provided by our contributors and analysts for information purposes only. You are solely responsible for determining whether any trading assets, securities, strategy, or any other product is suitable for investing based on your own investment objectives and financial situation.
          Add to Favorites
          Share

          Global M&A Activity Surges in Early 2025 as Mega Deals Target Private Firms

          Gerik

          Economic

          Mega Deals Reignite M&A Market with Focus on Private Companies

          The global mergers and acquisitions (M&A) landscape is showing renewed vigor in the first half of 2025, driven by several large-scale deals targeting private firms. According to Bloomberg data, global M&A activity surged to $1.8 trillion by mid-year, representing a 20% rise compared to the same period in 2024. Over half of the year’s 10 largest deals to date involved unlisted companies, indicating a shift toward unlocking value trapped within the private sector.
          Major deals include Alphabet’s $32 billion acquisition of cybersecurity startup Wiz, the merger between U.S. telecom giants Charter Communications and Cox Communications, and Constellation Energy’s takeover of Calpine. All were valued at over $30 billion, including debt. Meta Platforms also injected over $14 billion into Scale AI, a private data-labeling startup, underscoring growing investor appetite for AI and data infrastructure plays.

          Deal Sizes Expand Even as Volume Slips

          Data from Dealogic shows that 17,528 M&A transactions were signed globally in the first half of 2025, compared to 20,583 during the same period last year. Despite the decline in deal count, overall value increased, driven by a 62% surge in deals exceeding $10 billion. As of June 27, total M&A activity reached $2.14 trillion — a 26% increase year-on-year — with Asia contributing nearly $584 billion after doubling its regional M&A volume.
          The uptrend suggests a decisive move toward fewer but more strategic acquisitions, as companies prioritize transformational growth and capital deployment over smaller, incremental transactions. Haidee Lee, global head of M&A financing at Goldman Sachs, remarked that the uptick reflects efforts to unlock massive pools of capital held in private portfolios, many of which are overdue for liquidity events.

          Stability Returns as Policy Clarity Improves Under Trump’s Second Term

          Much of the M&A slowdown at the start of the year was attributed to unpredictable policy moves during the early months of President Donald Trump’s second term. Market sentiment deteriorated further in April when Trump announced retaliatory global tariffs, triggering a temporary collapse in investor confidence.
          However, equity markets gradually recovered as the White House softened some trade requirements, providing a more stable macroeconomic backdrop. This return of policy clarity has allowed corporate leaders and dealmakers to resume long-term growth planning. Eric Rutkoske of Guggenheim Securities noted that financial markets are responding positively now that the administration’s trade and tax strategies are more clearly defined.

          Sectoral Hotspots: Software, Health Tech, and Data Infrastructure

          Dealmakers are particularly active in sectors less vulnerable to geopolitical shocks and economic volatility. According to David Kamo of Evercore, areas such as enterprise software, digital healthcare, and data center infrastructure are seeing increased M&A activity. These segments offer resilient growth potential and align with long-term investment themes such as digital transformation, AI adoption, and decentralized computing.
          Buyers are also seeking diversification, with cross-border and cross-sector deals on the rise. The strategic rationale for recent transactions points not only to revenue expansion but also to acquiring technical capabilities, intellectual property, and access to specialized talent.

          Cautious Optimism for M&A Through Late 2025

          The sharp rebound in M&A activity during Q2 2025 has improved market confidence, with many expecting continued strength into the second half of the year. As inflation remains moderate and financial conditions favorable, the M&A outlook appears constructive, provided geopolitical and macroeconomic uncertainties remain contained.
          While challenges remain—particularly related to regulatory oversight and cross-border deal risks—the appetite for strategic expansion is clearly returning. If current trends persist, 2025 may close as one of the strongest M&A years since the pandemic era, powered by high-value deals and a growing alignment between capital supply and long-term innovation demand.

          Source: Reuters

          To stay updated on all economic events of today, please check out our Economic calendar
          Risk Warnings and Disclaimers
          You understand and acknowledge that there is a high degree of risk involved in trading. Following any strategies or investment methods may lead to potential losses. The content on the site is provided by our contributors and analysts for information purposes only. You are solely responsible for determining whether any trading assets, securities, strategy, or any other product is suitable for investing based on your own investment objectives and financial situation.
          Add to Favorites
          Share

          The Dollar’s Reversal to Growth Is in The Hands of Policymakers

          FxPro

          Technical Analysis

          The US dollar is retreating on all fronts, showing a daily decline since last Monday, when the military conflict between Israel and Iran came out of its hot phase and the tax bill in the US returned to the forefront.

          Resuming its decline, interrupted by the bombing between Israel and Iran, the dollar index has been updating its more than three-year lows on a daily basis since the second half of last week. With total losses of over 12%, the first half of the year was the worst for the US currency since 1973, i.e. in the entire history of the free forex market.

          A more neutral geopolitical background removed the ‘war premium’ from the dollar’s price and brought back the focus on Trump’s pressure on Powell and the discussion of Trump’s bill. This ‘One Big and Beautiful Bill’ promises to create a 7% budget deficit. The situation is not as serious as it was in September 2022 in Britain, but it is moving in the same direction.

          However, we still see more influence in the changing mood of market participants, where expectations of a rate cut are growing. Markets are pricing in a 65% chance that there will be at least three cuts by the end of the year, almost double the figure a month ago.

          On weekly timeframes, the RSI index has been updating its lows since early 2018, indicating an aggressive decline over the past seven years. This has dashed hopes for a bottoming out and rebound earlier this year.

          The technical picture indicates the potential for the dollar to decline by another 7-8% to the 88-90 range on the DXY from the current 96.6. However, this is a rare case where the situation is in the hands of politicians. We turn our attention to representatives of the US Treasury and the Fed with comments on maintaining a strong dollar policy. Strong macroeconomic employment data this week may halt the dollar sell-off, but this is unlikely during a period of economic slowdown.

          Source: FxPro

          Risk Warnings and Disclaimers
          You understand and acknowledge that there is a high degree of risk involved in trading. Following any strategies or investment methods may lead to potential losses. The content on the site is provided by our contributors and analysts for information purposes only. You are solely responsible for determining whether any trading assets, securities, strategy, or any other product is suitable for investing based on your own investment objectives and financial situation.
          Add to Favorites
          Share

          U.S. Faces Largest Economic Risk if Tariff Talks Collapse, South Korea’s BoK Warns

          Gerik

          Economic

          Escalating Tariff Risks Could Backfire on the U.S. Economy

          A recent report from the Bank of Korea (BoK)’s New York office warns that the United States stands to bear the greatest economic cost should current tariff negotiations with major trading partners fail. The analysis, published under the title "U.S. Economic Outlook and Key Issues for H2 2025," points to the country's growing trade dependence as a critical vulnerability.
          Contrary to its historical posture as a less trade-dependent economy, the U.S. now exhibits twice the level of trade reliance compared to the 1930s Smoot-Hawley tariff era. The report cautions that retaliatory tariffs from trading partners could disproportionately harm the U.S. economy, especially in the event of a 25% average tariff increase proposed by the Trump administration.

          Quantifying the Asymmetry in Economic Exposure

          In 2023, U.S. exports accounted for approximately 7% of its GDP. By contrast, the proportion of GDP dependent on exports to the U.S. was only 3.1% for the European Union and 2.9% for China. These figures suggest that if a wave of retaliatory tariffs were enacted, the damage to the U.S. economy could be more severe than the impact on its trading partners.
          Using this ratio-based comparison, the BoK notes that nearly 7% of U.S. economic output could be exposed to foreign countermeasures, while the reciprocal exposure for the EU and China remains notably smaller. This economic imbalance underscores why the U.S. might find itself more economically vulnerable than its trading counterparts in a tit-for-tat tariff war.

          Policy Uncertainty as a Drag on Growth and Investment

          The warning from BoK comes amid a 90-day suspension of tariff enforcement announced on April 2, with the temporary halt set to expire on July 8. The U.S. administration is currently engaged in bilateral negotiations to avoid a full-scale trade escalation, but the report signals growing concern that the final tariff rates may still remain high.
          Market analysts expect that any eventual tariff implementation could be less aggressive than President Trump’s initial proposal. However, the risk remains that if talks fail, markets could face a dual shock—first from weakened global demand, and second from a sharp repricing of financial assets, particularly in sectors sensitive to trade and inflation.

          Asset Markets at Risk Amid Recession and Inflation Scenarios

          The BoK report goes further to warn that failure in trade negotiations—combined with the onset of recessionary pressures or a rise in inflation—could result in swift downward adjustments in asset prices. This warning implies that financial markets are likely underestimating the potential spillover effects of a deteriorating trade environment.
          The twin threats of slower economic growth and higher inflation, catalyzed by tariff hikes, could lead to tighter financial conditions, reduced consumer confidence, and heightened volatility in equity and bond markets. Investors are being advised to monitor the July 8 outcome closely, as it may determine the trajectory of U.S. asset pricing in the second half of the year.

          A High-Stakes Test for U.S. Trade Strategy

          While the U.S. seeks to pressure its trading partners into more favorable terms, the economic calculus presented by the Bank of Korea suggests that Washington may face the steepest costs if talks collapse. With its high export-to-GDP ratio and sensitivity to retaliatory tariffs, the U.S. could find its financial markets and broader economy disproportionately affected.
          As the deadline approaches, the ability of policymakers to reach negotiated outcomes will be crucial not only to global trade stability but also to domestic financial resilience. The path forward demands strategic compromise, as the margin for unilateral escalation grows increasingly narrow.

          Source: Reuters

          To stay updated on all economic events of today, please check out our Economic calendar
          Risk Warnings and Disclaimers
          You understand and acknowledge that there is a high degree of risk involved in trading. Following any strategies or investment methods may lead to potential losses. The content on the site is provided by our contributors and analysts for information purposes only. You are solely responsible for determining whether any trading assets, securities, strategy, or any other product is suitable for investing based on your own investment objectives and financial situation.
          Add to Favorites
          Share
          FastBull
          Copyright © 2025 FastBull Ltd

          728 RM B 7/F GEE LOK IND BLDG NO 34 HUNG TO RD KWUN TONG KLN HONG KONG

          TelegramInstagramTwitterfacebooklinkedin
          App Store Google Play Google Play
          Products
          Charts

          Chats

          Q&A with Experts
          Screeners
          Economic Calendar
          Data
          Tools
          Membership
          Features
          Function
          Markets
          Copy Trading
          Latest Signals
          Contests
          News
          Analysis
          24/7
          Columns
          Education
          Company
          Careers
          About Us
          Contact Us
          Advertising
          Help Center
          Feedback
          User Agreement
          Privacy Policy
          Business

          White Label

          Data API

          Web Plug-ins

          Poster Maker

          Affiliate Program

          Risk Disclosure

          The risk of loss in trading financial instruments such as stocks, FX, commodities, futures, bonds, ETFs and crypto can be substantial. You may sustain a total loss of the funds that you deposit with your broker. Therefore, you should carefully consider whether such trading is suitable for you in light of your circumstances and financial resources.

          No decision to invest should be made without thoroughly conducting due diligence by yourself or consulting with your financial advisors. Our web content might not suit you since we don't know your financial conditions and investment needs. Our financial information might have latency or contain inaccuracy, so you should be fully responsible for any of your trading and investment decisions. The company will not be responsible for your capital loss.

          Without getting permission from the website, you are not allowed to copy the website's graphics, texts, or trademarks. Intellectual property rights in the content or data incorporated into this website belong to its providers and exchange merchants.

          Not Logged In

          Log in to access more features

          FastBull Membership

          Not yet

          Purchase

          Become a signal provider
          Help Center
          Customer Service
          Dark Mode
          Price Up/Down Colors

          Log In

          Sign Up

          Position
          Layout
          Fullscreen
          Default to Chart
          The chart page opens by default when you visit fastbull.com