• Trade
  • Markets
  • Copy
  • Contests
  • News
  • 24/7
  • Calendar
  • Q&A
  • Chats
Trending
Screeners
SYMBOL
LAST
BID
ASK
HIGH
LOW
NET CHG.
%CHG.
SPREAD
SPX
S&P 500 Index
6827.42
6827.42
6827.42
6899.86
6801.80
-73.58
-1.07%
--
DJI
Dow Jones Industrial Average
48458.04
48458.04
48458.04
48886.86
48334.10
-245.98
-0.51%
--
IXIC
NASDAQ Composite Index
23195.16
23195.16
23195.16
23554.89
23094.51
-398.69
-1.69%
--
USDX
US Dollar Index
97.990
98.070
97.990
98.070
97.920
+0.040
+ 0.04%
--
EURUSD
Euro / US Dollar
1.17301
1.17308
1.17301
1.17447
1.17283
-0.00093
-0.08%
--
GBPUSD
Pound Sterling / US Dollar
1.33572
1.33582
1.33572
1.33740
1.33546
-0.00135
-0.10%
--
XAUUSD
Gold / US Dollar
4340.49
4340.90
4340.49
4345.46
4294.68
+41.10
+ 0.96%
--
WTI
Light Sweet Crude Oil
57.474
57.511
57.474
57.601
57.194
+0.241
+ 0.42%
--

Community Accounts

Signal Accounts
--
Profit Accounts
--
Loss Accounts
--
View More

Become a signal provider

Sell trading signals to earn additional income

View More

Guide to Copy Trading

Get started with ease and confidence

View More

Signal Accounts for Members

All Signal Accounts

Best Return
  • Best Return
  • Best P/L
  • Best MDD
Past 1W
  • Past 1W
  • Past 1M
  • Past 1Y

All Contests

  • All
  • Trump Updates
  • Recommend
  • Stocks
  • Cryptocurrencies
  • Central Banks
  • Featured News
Top News Only
Share

India's November Soyoil Imports At 370661 Tonnes Versus 454619 Tonnes In October

Share

India's November Sunflower Oil Imports At 142953 Tonnes Versus 260548 Tonnes In October

Share

India's November Palm Oil Imports At 632341 Tonnes Versus 602381 Tonnes In October

Share

India's November Vegetable Oil Imports At 1183,832 Tonnes Versus 1332,173 Million Tonnes In October

Share

Reuters Poll - Bank Indonesia To Keep 7-Day Reverse Repo Rate Unchanged At 4.75% On December 17, Say 18 Of 31 Economists

Share

Statistics Finland - Finland Nov CPI -0.1% Year-On-Year

Share

Saudi Nov CPI 0.1% Month-On-Month

Share

Saudi Nov CPI 1.9% Year-On-Year

Share

South Korea Petrochemical Exports To Fall 6.1% In 2026 - Kcci

Share

U.S. Stock Futures Rose Slightly, With S&P 500 Futures And Dow Jones Futures Up 0.3% And NASDAQ 100 Futures Up Nearly 0.3%

Share

Spot Gold Rose $9 To $4,338.5 Per Ounce In The Short Term; New York Gold Futures Rose 1.00% On The Day, Currently Trading At $4,371.60 Per Ounce

Share

Dollar/Yen Extends Fall, Down 0.47% To 155.10

Share

Bank Of Japan: Two Branches Expect Higher Pay Rises In Fiscal Year 2026, While Two Other Branches Expect Wage Growth To Slow

Share

Bloomberg News: Bank Of Japan To Start Selling ETF Holdings As Early As January

Share

Malaysia Says Special ASEAN Foreign Ministers Meeting Scheduled For Dec 16 Delayed To Dec 22 At Thailand's Request

Share

Bank Of Japan: Wages Of Part-Time Employees Are Being Raised Reflecting Relatively High Minimum Wage Growth In Fiscal 2025

Share

Bank Of Japan: Firms' Wage Growth Outlook Due To Need For Retaining Staff Amid Persistent, Severe Labour Shortages

Share

Bank Of Japan - While Large And Medium-Sized Firms Were Likely To Be Able To Raise As Much Wages In FY 2026 As They Did In FY 2025, It Would Be Difficult For Small Firms To Raise As Much Wages In FY 2026 As In FY 2025

Share

Bank Of Japan: Most Companies Seem To Believe That Wage Increases In Fiscal Year 2026 Should Be The Same As Or Similar To Those In Fiscal Year 2025

Share

Bank Of Japan: Number Of Firms Expecting A Clear Improvement In Their Profits Is Not Large

TIME
ACT
FCST
PREV
U.K. Trade Balance Non-EU (SA) (Oct)

A:--

F: --

P: --

France HICP Final MoM (Nov)

A:--

F: --

P: --

China, Mainland Outstanding Loans Growth YoY (Nov)

A:--

F: --

P: --

China, Mainland M2 Money Supply YoY (Nov)

A:--

F: --

P: --

China, Mainland M0 Money Supply YoY (Nov)

A:--

F: --

P: --

China, Mainland M1 Money Supply YoY (Nov)

A:--

F: --

P: --

India CPI YoY (Nov)

A:--

F: --

P: --

India Deposit Gowth YoY

A:--

F: --

P: --

Brazil Services Growth YoY (Oct)

A:--

F: --

P: --

Mexico Industrial Output YoY (Oct)

A:--

F: --

P: --

Russia Trade Balance (Oct)

A:--

F: --

P: --

Philadelphia Fed President Henry Paulson delivers a speech
Canada Building Permits MoM (SA) (Oct)

A:--

F: --

P: --

Canada Wholesale Sales YoY (Oct)

A:--

F: --

P: --

Canada Wholesale Inventory MoM (Oct)

A:--

F: --

P: --

Canada Wholesale Inventory YoY (Oct)

A:--

F: --

P: --

Canada Wholesale Sales MoM (SA) (Oct)

A:--

F: --

P: --

Germany Current Account (Not SA) (Oct)

A:--

F: --

P: --

U.S. Weekly Total Rig Count

A:--

F: --

P: --

U.S. Weekly Total Oil Rig Count

A:--

F: --

P: --

Japan Tankan Small Manufacturing Outlook Index (Q4)

A:--

F: --

P: --

Japan Tankan Large Non-Manufacturing Diffusion Index (Q4)

A:--

F: --

P: --

Japan Tankan Large Non-Manufacturing Outlook Index (Q4)

A:--

F: --

P: --

Japan Tankan Large Manufacturing Outlook Index (Q4)

A:--

F: --

P: --

Japan Tankan Small Manufacturing Diffusion Index (Q4)

A:--

F: --

P: --

Japan Tankan Large Manufacturing Diffusion Index (Q4)

A:--

F: --

P: --

Japan Tankan Large-Enterprise Capital Expenditure YoY (Q4)

A:--

F: --

P: --

U.K. Rightmove House Price Index YoY (Dec)

A:--

F: --

P: --

China, Mainland Industrial Output YoY (YTD) (Nov)

A:--

F: --

P: --

China, Mainland Urban Area Unemployment Rate (Nov)

A:--

F: --

P: --

Saudi Arabia CPI YoY (Nov)

A:--

F: --

P: --

Euro Zone Industrial Output YoY (Oct)

--

F: --

P: --

Euro Zone Industrial Output MoM (Oct)

--

F: --

P: --

Canada Existing Home Sales MoM (Nov)

--

F: --

P: --

Euro Zone Total Reserve Assets (Nov)

--

F: --

P: --

U.K. Inflation Rate Expectations

--

F: --

P: --

Canada National Economic Confidence Index

--

F: --

P: --

Canada New Housing Starts (Nov)

--

F: --

P: --

U.S. NY Fed Manufacturing Employment Index (Dec)

--

F: --

P: --

U.S. NY Fed Manufacturing Index (Dec)

--

F: --

P: --

Canada Core CPI YoY (Nov)

--

F: --

P: --

Canada Manufacturing Unfilled Orders MoM (Oct)

--

F: --

P: --

U.S. NY Fed Manufacturing Prices Received Index (Dec)

--

F: --

P: --

U.S. NY Fed Manufacturing New Orders Index (Dec)

--

F: --

P: --

Canada Manufacturing New Orders MoM (Oct)

--

F: --

P: --

Canada Core CPI MoM (Nov)

--

F: --

P: --

Canada Trimmed CPI YoY (SA) (Nov)

--

F: --

P: --

Canada Manufacturing Inventory MoM (Oct)

--

F: --

P: --

Canada CPI YoY (Nov)

--

F: --

P: --

Canada CPI MoM (Nov)

--

F: --

P: --

Canada CPI YoY (SA) (Nov)

--

F: --

P: --

Canada Core CPI MoM (SA) (Nov)

--

F: --

P: --

Canada CPI MoM (SA) (Nov)

--

F: --

P: --

Federal Reserve Board Governor Milan delivered a speech
U.S. NAHB Housing Market Index (Dec)

--

F: --

P: --

Australia Composite PMI Prelim (Dec)

--

F: --

P: --

Australia Services PMI Prelim (Dec)

--

F: --

P: --

Australia Manufacturing PMI Prelim (Dec)

--

F: --

P: --

Japan Manufacturing PMI Prelim (SA) (Dec)

--

F: --

P: --

U.K. Unemployment Claimant Count (Nov)

--

F: --

P: --

U.K. Unemployment Rate (Nov)

--

F: --

P: --

Q&A with Experts
    • All
    • Chatrooms
    • Groups
    • Friends
    Connecting
    .
    .
    .
    Type here...
    Add Symbol or Code

      No matching data

      All
      Trump Updates
      Recommend
      Stocks
      Cryptocurrencies
      Central Banks
      Featured News
      • All
      • Russia-Ukraine Conflict
      • Middle East Flashpoint
      • All
      • Russia-Ukraine Conflict
      • Middle East Flashpoint

      Search
      Products

      Charts Free Forever

      Chats Q&A with Experts
      Screeners Economic Calendar Data Tools
      Membership Features
      Data Warehouse Market Trends Institutional Data Policy Rates Macro

      Market Trends

      Market Sentiment Order Book Forex Correlations

      Top Indicators

      Charts Free Forever
      Markets

      News

      News Analysis 24/7 Columns Education
      From Institutions From Analysts
      Topics Columnists

      Latest Views

      Latest Views

      Trending Topics

      Top Columnists

      Latest Update

      Signals

      Copy Rankings Latest Signals Become a signal provider AI Rating
      Contests
      Brokers

      Overview Brokers Assessment Rankings Regulators News Claims
      Broker listing Forex Brokers Comparison Tool Live Spread Comparison Scam
      Q&A Complaint Scam Alert Videos Tips to Detect Scam
      More

      Business
      Events
      Careers About Us Advertising Help Center

      White Label

      Data API

      Web Plug-ins

      Affiliate Program

      Awards Institution Evaluation IB Seminar Salon Event Exhibition
      Vietnam Thailand Singapore Dubai
      Fans Party Investment Sharing Session
      FastBull Summit BrokersView Expo
      Recent Searches
        Top Searches
          Markets
          News
          Analysis
          User
          24/7
          Economic Calendar
          Education
          Data
          • Names
          • Latest
          • Prev

          View All

          No data

          Scan to Download

          Faster Charts, Chat Faster!

          Download App
          English
          • English
          • Español
          • العربية
          • Bahasa Indonesia
          • Bahasa Melayu
          • Tiếng Việt
          • ภาษาไทย
          • Français
          • Italiano
          • Türkçe
          • Русский язык
          • 简中
          • 繁中
          Open Account
          Search
          Products
          Charts Free Forever
          Markets
          News
          Signals

          Copy Rankings Latest Signals Become a signal provider AI Rating
          Contests
          Brokers

          Overview Brokers Assessment Rankings Regulators News Claims
          Broker listing Forex Brokers Comparison Tool Live Spread Comparison Scam
          Q&A Complaint Scam Alert Videos Tips to Detect Scam
          More

          Business
          Events
          Careers About Us Advertising Help Center

          White Label

          Data API

          Web Plug-ins

          Affiliate Program

          Awards Institution Evaluation IB Seminar Salon Event Exhibition
          Vietnam Thailand Singapore Dubai
          Fans Party Investment Sharing Session
          FastBull Summit BrokersView Expo

          US Dollar Index (DXY) Plummets Following Labour Market Data

          FXOpen

          Forex

          Economic

          Summary:

          The US Dollar Index (DXY) fell by approximately 1.4% on Friday after the release of disappointing US labour market figures.

          The US Dollar Index (DXY) fell by approximately 1.4% on Friday after the release of disappointing US labour market figures. According to Forex Factory:

          → The unemployment rate rose from 4.1% to 4.2%;

          → The Nonfarm Employment Change figure came in at 73K, well below the forecast of 103K. This is the lowest level of job creation in the nonfarm sector in 2025 and is roughly half the previous month’s reading (prior to revisions).

          → Furthermore, revisions for May and June were significantly more severe than usual. The May figure was revised downward by 125,000 — from +144,000 to +19,000. Similarly, the June figure was revised down by 133,000 — from +147,000 to +14,000.

          These results point to a weakening labour market, which increases the likelihood of a rate cut aimed at supporting economic growth. In turn, expectations of a Fed rate cut are acting as a bearish driver for the US dollar.

          US Dollar Index (DXY) Plummets Following Labour Market Data_1

          Technical Analysis of the DXY Chart

          Six days ago, we highlighted two U-shaped trajectories (A and B), which together formed a bullish сup and рandle pattern on the US Dollar Index chart.Following this, price action generated a notable upward impulse (as indicated by the arrow), breaking through the upper boundary of the pattern.However, Friday’s news triggered the following developments:

          → A new top (4) was formed on the chart, accompanied by a false bullish breakout above the psychological level of 100.00;

          → The price declined to the 98.80 area. The downward move slowed here, as this zone had previously seen strong bullish activity during the breakout from the pattern’s upper boundary — likely explaining why the market is finding support here on Monday morning.

          Overall, the technical picture has shifted towards a bearish outlook. Friday’s peak continues the summer sequence of lower highs and lows: 1 → 2 → bottom of pattern (A) → 4. This structure is part of a broader downtrend that has defined the market in 2025.

          Should bearish sentiment persist, fuelled by Friday’s data, we can assume a further decline in the US Dollar Index towards the median line of the descending channel (shown in red), which has been drawn through the aforementioned price extremes.

          Source: FXOpen

          To stay updated on all economic events of today, please check out our Economic calendar
          Risk Warnings and Disclaimers
          You understand and acknowledge that there is a high degree of risk involved in trading. Following any strategies or investment methods may lead to potential losses. The content on the site is provided by our contributors and analysts for information purposes only. You are solely responsible for determining whether any trading assets, securities, strategy, or any other product is suitable for investing based on your own investment objectives and financial situation.
          Add to Favorites
          Share

          Malaysia Commits $150 Billion to U.S. Tech Purchases in Exchange for Lower Tariffs and Trade Concessions

          Gerik

          Economic

          Malaysia and U.S. Strike Investment-Backed Trade Deal to Avert Higher Tariffs

          Malaysia has agreed to make substantial economic commitments to the United States totaling up to $150 billion over five years to secure more favorable trade terms under a new bilateral arrangement. The deal was confirmed Monday by Malaysian Trade Minister Tengku Zafrul Aziz during a parliamentary briefing, outlining a multifaceted strategy to reduce U.S. tariff exposure while deepening cross-border economic ties.
          Under the agreement, Malaysia will increase its purchases of American technology and energy assets, specifically targeting semiconductor, aerospace, and data center industries. The move comes after weeks of negotiations with Washington, which had initially threatened a 25 percent tariff on Malaysian goods but ultimately settled on a reduced rate of 19 percent, set to take effect on August 8.

          Key Pillars of the Deal: LNG Purchases and Tech Investments

          A central component of the agreement involves Malaysia’s state energy firm, Petroliam Nasional Berhad (Petronas), committing to buy $3.4 billion worth of U.S.-sourced liquefied natural gas annually. In parallel, Malaysian entities will spend a cumulative $150 billion on American-made industrial and technological equipment, supporting U.S. multinationals while bolstering Malaysia’s domestic capacity in high-value sectors.
          In a bid to further ease trade tensions, Malaysia will also invest $70 billion in the U.S. economy over the next five years. These cross-border flows are designed to reduce Washington’s $24.8 billion goods trade deficit with Malaysia, a figure that has been politically sensitive amid ongoing U.S. tariff campaigns under President Donald Trump’s administration.

          Market Access and Regulatory Concessions from Malaysia

          As part of the broader deal, Malaysia has agreed to significant concessions on trade access. These include lowering or abolishing tariffs on 98.4 percent of U.S. imports, relaxing certain non-tariff barriers, and eliminating a requirement that had previously compelled U.S. digital firms such as social media and cloud providers to allocate a portion of their Malaysian revenue to a state-managed fund.
          These adjustments are expected to ease frictions in sectors such as pharmaceuticals and semiconductors, where Malaysia had secured tariff exemptions last week. However, despite this progress, Tengku Zafrul warned that further risks remain. Specifically, Malaysian semiconductor exports could still face additional levies under U.S. national security regulations, adding a layer of unpredictability to the industry’s outlook.

          Strategic Objectives and Risk Management

          The revised trade terms highlight Malaysia’s pragmatic approach to preserving U.S. market access while positioning itself as a regional hub for advanced manufacturing and data infrastructure. The aggressive commitment to U.S. technology procurement reflects both economic necessity and a diplomatic balancing act amid shifting geopolitical alignments and global trade realignments.
          While the financial scale of Malaysia’s commitment underscores the country’s willingness to recalibrate its trade relationship, the semiconductor warning serves as a reminder that policy risks especially in strategic sectors are unlikely to disappear entirely. With Washington continuing to enforce national security-based trade restrictions, Malaysia’s reliance on semiconductor exports may remain a vulnerability.
          Malaysia’s latest trade pact with the United States reflects a calculated effort to mitigate protectionist pressures while accelerating domestic industrial upgrading. By leveraging high-profile investments and market liberalization, Malaysia has managed to secure key exemptions and reduced tariff exposure, though future risks remain in sensitive sectors such as semiconductors. The evolving framework offers immediate relief but will require continued diplomatic vigilance and policy agility in the years ahead.

          Source: Reuters

          To stay updated on all economic events of today, please check out our Economic calendar
          Risk Warnings and Disclaimers
          You understand and acknowledge that there is a high degree of risk involved in trading. Following any strategies or investment methods may lead to potential losses. The content on the site is provided by our contributors and analysts for information purposes only. You are solely responsible for determining whether any trading assets, securities, strategy, or any other product is suitable for investing based on your own investment objectives and financial situation.
          Add to Favorites
          Share

          German Finance Minister Urges US to Accept Steel Export Quotas in Ongoing EU Trade Talks

          Gerik

          Economic

          Germany Seeks Steel Quota Deal as Transatlantic Trade Talks Continue

          German Finance Minister Lars Klingbeil has announced plans to press the United States for a quota-based system on European steel exports during his meeting with US Treasury Secretary Scott Bessent in Washington. Klingbeil’s intervention reflects mounting pressure from Berlin to secure more favorable terms for Germany’s critical steel sector within the broader EU-US trade framework.
          Speaking to Deutschlandfunk radio ahead of the meeting, Klingbeil stressed that steel remains a "particularly important issue for the German economy and jobs," citing ongoing uncertainty surrounding tariff rates and export volumes. He emphasized his intent to gauge the level of US flexibility and explore viable compromises, even though formal negotiations remain under the EU’s jurisdiction.

          Steel Industry at Center of Ongoing Trade Dispute

          While a trade agreement was struck in July between the EU and the administration of President Donald Trump, several sectors including steel and aluminum were left unresolved. Although most European exports now face a general tariff of 15 percent, steel and aluminum are subject to far steeper levies of up to 50 percent. Germany, Europe’s largest steel exporter, is particularly exposed to these conditions.
          Chancellor Friedrich Merz previously stated that the EU would engage in sector-specific talks with the US, with steel quotas emerging as a preferred strategy. Such quotas would allow a fixed volume of steel to be exported tariff-free or at reduced rates, providing predictable access to the US market and shielding German firms from excessive cost burdens.

          Policy Priorities and Political Pressure in Berlin

          Klingbeil’s advocacy for quotas highlights Berlin’s growing concern over the potential domestic fallout of continued trade frictions. Germany’s steel industry supports tens of thousands of jobs and underpins several downstream manufacturing sectors. Without a quota system, firms face higher export costs, reduced competitiveness, and the risk of production cuts or job losses.
          Klingbeil also called for expedited clarification of other open trade issues, particularly those tied to energy cooperation and EU investment commitments. Uncertainty in these areas continues to delay broader economic planning and transatlantic regulatory alignment.
          As transatlantic trade negotiations enter a sensitive phase, Germany is taking a more active role in shaping outcomes that affect its core industrial base. By advocating for steel export quotas, Finance Minister Klingbeil is seeking to insulate German manufacturers from the volatility of high tariffs while helping the EU close one of the last remaining chapters of the current US-EU trade agreement. Whether Washington proves receptive to such a compromise may determine the pace and scope of future economic cooperation between the two powers.

          Source: Reuters

          To stay updated on all economic events of today, please check out our Economic calendar
          Risk Warnings and Disclaimers
          You understand and acknowledge that there is a high degree of risk involved in trading. Following any strategies or investment methods may lead to potential losses. The content on the site is provided by our contributors and analysts for information purposes only. You are solely responsible for determining whether any trading assets, securities, strategy, or any other product is suitable for investing based on your own investment objectives and financial situation.
          Add to Favorites
          Share

          EURUSD Strengthens In Response To Revised US Labour Market Data

          Blue River

          Economic

          Forex

          The EURUSD pair continues to rise on the back of deteriorating US labour data and expectations of a Federal Reserve rate cut. However, EURUSD technical analysis suggests a high probability of a downward correction towards 1.1375 in line with a Head and Shoulders pattern.

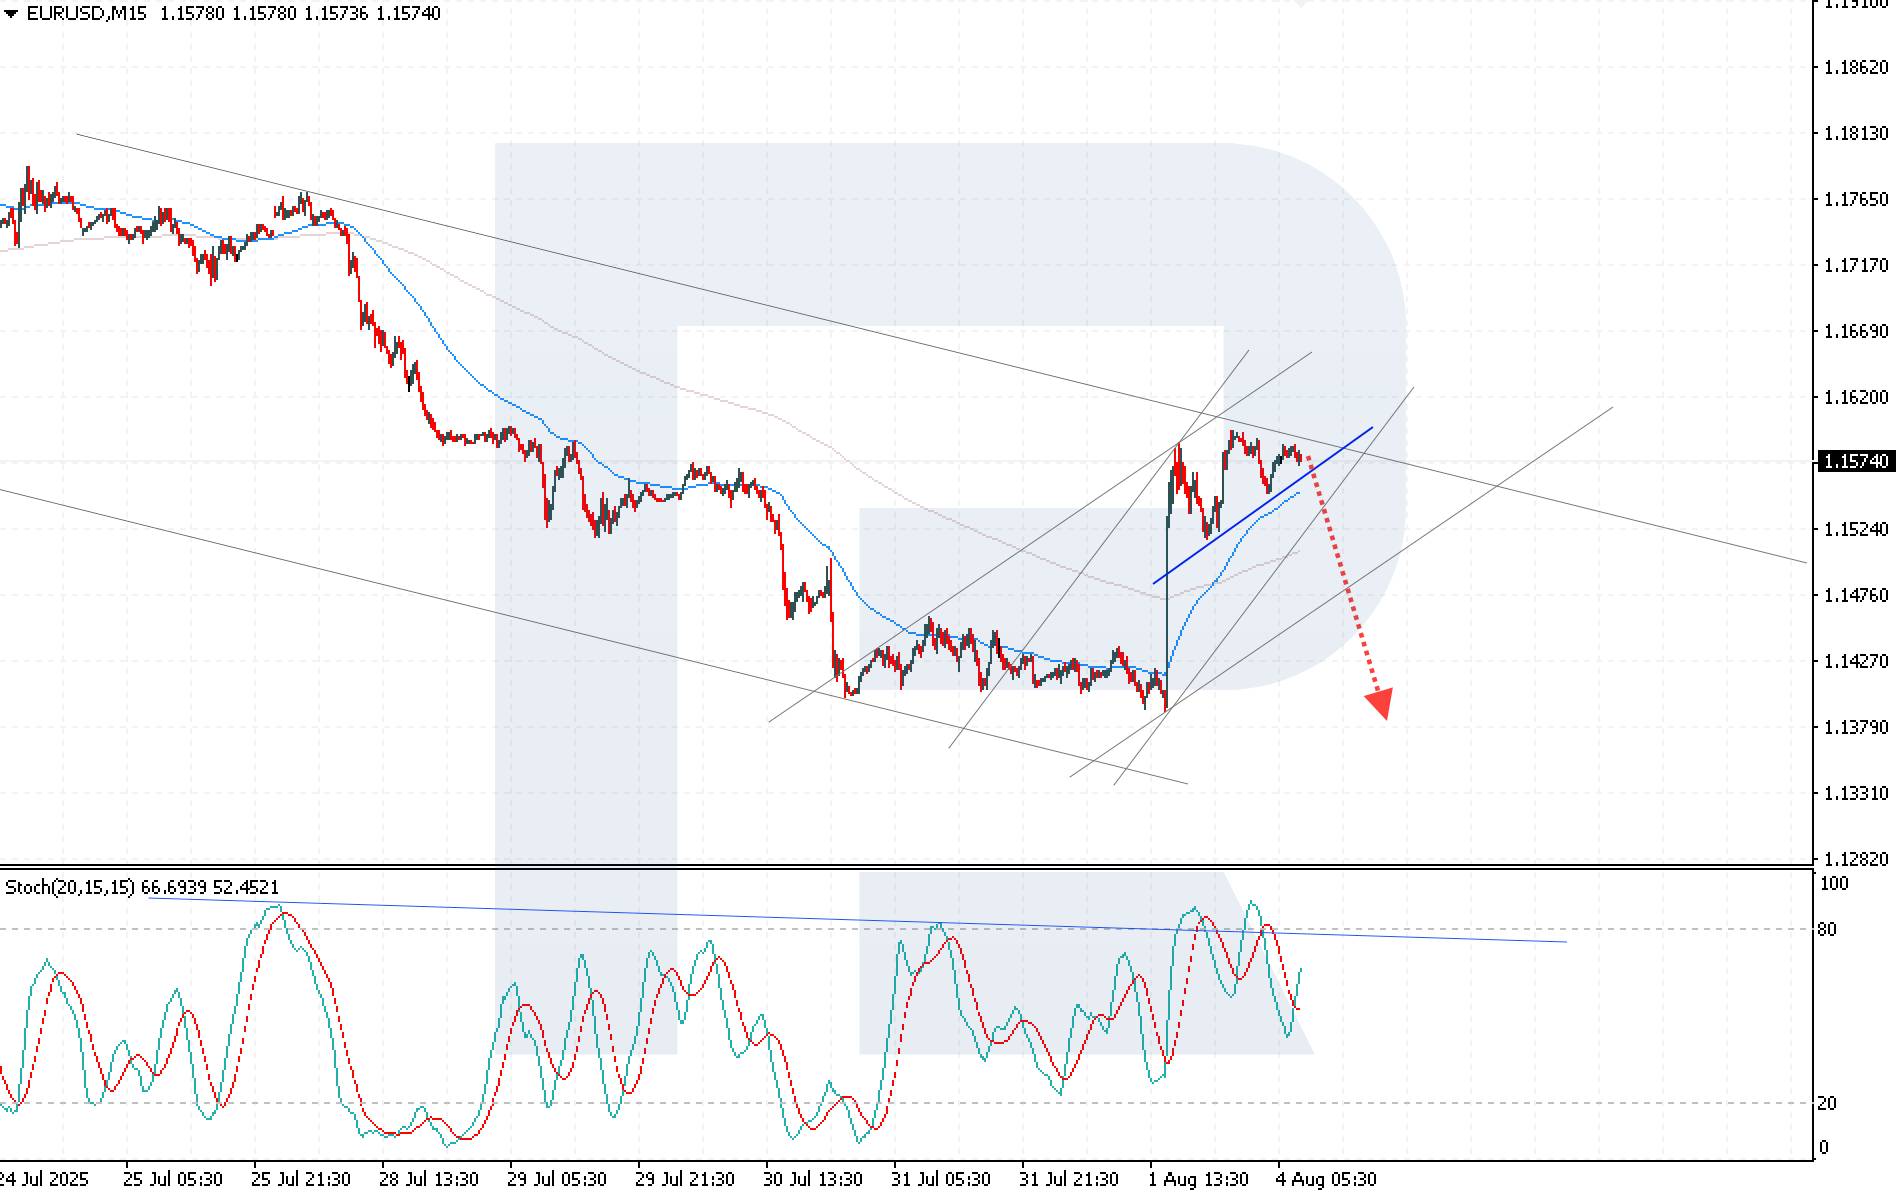
          The EURUSD pair continues its upward attempt as weak US macroeconomic data weighs on the US dollar. The price currently stands at 1.1574. Discover more in our analysis for 4 August 2025.

          EURUSD forecast: key trading points

          ●In July, the US economy added just 73 thousand jobs
          ●The ISM Manufacturing Index fell to 48 points, staying below 50 for the fifth consecutive month
          ●Markets now price in a near-certain Fed rate cut in September
          ●EURUSD forecast for 4 August 2025: 1.1415

          Fundamental analysis

          The EURUSD rate is slightly rising, remaining below the 1.1590 resistance level. The US dollar continues to lose ground amid disappointing labour market data.

          In July, the US economy added only 73 thousand jobs, far below the expected 110 thousand. The June figure was revised down to 14 thousand from 147 thousand, with May’s gain down to 19 thousand from 144 thousand, highlighting a worsening hiring trend.

          The US ISM Manufacturing PMI dropped to 48 from 49 points, contrary to forecasts for a rise to 49.5. The figure remains below the 50 threshold for the fifth consecutive month, signalling continued contraction in activity.

          Markets now almost fully price in a Federal Reserve rate cut in September. Tensions escalated after President Donald Trump dismissed Bureau of Labor Statistics Commissioner Erica McEntarfer, accusing her of manipulating employment data.

          EURUSD technical analysis

          The EURUSD rate maintains its upward momentum after breaking out of the consolidation range, signalling a revival in buying interest. However, the price remains below the key 1.1590 resistance level, which limits the short-term upside potential.

          Today’s EURUSD forecast suggests a drop towards 1.1375 as part of a Head and Shoulders pattern formation. The Stochastic Oscillator confirms the likelihood of a correction, with signal lines turning down from overbought territory, indicating weakening bullish momentum.

          A breakout below the ascending channel’s lower boundary, along with consolidation below 1.1525, would confirm the bearish scenario.

          Source: RoboForex

          To stay updated on all economic events of today, please check out our Economic calendar
          Risk Warnings and Disclaimers
          You understand and acknowledge that there is a high degree of risk involved in trading. Following any strategies or investment methods may lead to potential losses. The content on the site is provided by our contributors and analysts for information purposes only. You are solely responsible for determining whether any trading assets, securities, strategy, or any other product is suitable for investing based on your own investment objectives and financial situation.
          Add to Favorites
          Share

          China to End Bond Interest Tax Exemption, Prompting Market Repricing and Investment Shifts

          Gerik

          Economic

          Bond

          Beijing Ends Longstanding Bond Tax Exemption, Stirring Debt Market Reaction

          In a significant policy shift, China’s Ministry of Finance announced plans to reintroduce a value-added tax (VAT) on interest income earned from newly issued bonds by central and local governments as well as financial institutions, starting August 8. Bonds issued prior to this date, including reopenings of existing tranches, will retain their tax-exempt status. This development effectively terminates a three-decade policy of preferential tax treatment in the bond market and has triggered immediate adjustments in investor behavior.
          Since the 1990s, China had exempted bond interest income from VAT to encourage sovereign debt purchases and facilitate public fund-raising. The exemption was retained even during the broader VAT system reform of 2016. Now, officials argue that the exemption has fulfilled its historical purpose. With China’s bond market now the second largest globally, the Ministry believes a more normalized tax structure is appropriate.

          Short-Term Market Impact and Bond Pricing Dynamics

          Markets responded promptly. Investors rushed to acquire older, tax-exempt bonds, pushing yields lower on those instruments. Huatai Securities analysts estimate that the spread between existing and new bonds could widen by five to ten basis points, reflecting the new tax burden.
          On Friday, yields on China’s 30-year bonds dipped in response to the announcement, stabilizing Monday at 1.94 percent. The 10-year yield held at 1.69 percent after slipping slightly in the previous session. Analysts suggest the resumption of tax collection will increase borrowing costs across the public and financial sectors at a time when the Chinese economy is still struggling with weak domestic demand and fragile recovery momentum.
          With the general VAT rate at 6 percent, the new tax introduces a meaningful cost for institutional bondholders, particularly banks and long-term investors who dominate the sovereign debt space. According to data as of end-June, nearly 70 percent of China’s total outstanding bond stock is comprised of government and financial institution notes highlighting the broad reach of the tax.

          Revenue Generation vs. Funding Costs: Balancing Fiscal Strategy

          From Beijing’s perspective, reintroducing this tax provides a new revenue stream amid efforts to shore up government finances without resorting to headline-grabbing spending cuts. Yet, the policy may prove counterproductive if higher funding costs reduce the appetite for debt issuance or hinder the government's ability to stimulate growth through infrastructure and social programs.
          Economist Serena Zhou of Mizuho Securities notes that the new tax will likely cap further declines in bond yields and reduce the enthusiasm of banks for government bond purchases. This could lead to a reallocation of funds toward instruments not subject to the same tax such as corporate bonds or negotiable certificates of deposit (NCDs) thus altering the composition of institutional portfolios.

          Equity Market and Sectoral Implications

          Bank stocks, which tend to benefit from rising yields and reduced reliance on low-return government securities, rallied on Friday after the tax announcement. The shift in investor preference away from tax-penalized sovereign bonds is expected to provide relative support to banking and financial sectors in the near term.
          Brokerages like Huachuang Securities also anticipate increased interest in corporate bonds and NCDs as these become more attractive in comparison. However, this rebalancing may introduce additional volatility to non-sovereign segments of the fixed-income market, particularly if investor risk appetite remains subdued.
          China’s decision to tax bond interest income marks a turning point in the evolution of its financial markets, ending a decades-long incentive designed to promote sovereign borrowing. While the policy shift is framed as a necessary step toward fiscal modernization and structural alignment, it introduces short-term frictions that may affect borrowing costs, investment behavior, and monetary policy transmission. Investors are now reassessing their fixed-income strategies as the landscape adjusts to a new equilibrium where tax differentials and not just duration or credit quality shape bond valuations.

          Source: Bloomberg

          To stay updated on all economic events of today, please check out our Economic calendar
          Risk Warnings and Disclaimers
          You understand and acknowledge that there is a high degree of risk involved in trading. Following any strategies or investment methods may lead to potential losses. The content on the site is provided by our contributors and analysts for information purposes only. You are solely responsible for determining whether any trading assets, securities, strategy, or any other product is suitable for investing based on your own investment objectives and financial situation.
          Add to Favorites
          Share

          Gold Stabilizes Near $3,360 as Fed Rate Cut Bets and Tariff Risks Fuel Safe-Haven Demand

          Gerik

          Economic

          Commodity

          Gold Maintains Gains After Labor Market Weakness and Tariff Escalation

          Gold prices stabilized on Monday, trading near $3,360 per ounce, after posting a 2.2 percent gain in the previous session the strongest daily rise in two months. This momentum reflects investor concerns over the deteriorating US labor market and the renewed risk of trade disruptions under President Trump’s intensified tariff agenda.
          July’s payroll data, showing only 73,000 new jobs, fell sharply below expectations. Revisions to May and June erased nearly 260,000 positions, marking one of the steepest labor market downward adjustments in recent years. These figures have fueled expectations that the Federal Reserve will cut interest rates in September, with traders now pricing in aggressive easing through year-end.

          Rate Cut Expectations and Policy Uncertainty Drive Market Sentiment

          The weak job numbers coincided with President Trump’s dismissal of the Bureau of Labor Statistics commissioner, a decision that has raised questions about the credibility and independence of US economic institutions. Combined with the latest wave of tariffs reportedly among the most severe since the 1930s investors are growing increasingly cautious about the stability of the policy environment.
          In this context, gold continues to benefit from its traditional role as a hedge against both inflation and political risk. With US equities declining and the Bloomberg Dollar Spot Index down 0.1 percent, the relative appeal of bullion as a non-yielding, globally recognized store of value remains elevated.

          Geopolitical and Monetary Tailwinds Support Further Upside

          Gold’s performance in 2025 reflects more than just short-term reactions to data or headlines. The precious metal has already climbed over 25 percent year-to-date, supported by persistent central bank purchases, elevated geopolitical tensions including the ongoing Russia-Ukraine conflict and speculative inflows driven by recession fears and institutional distrust.
          With markets expecting the Fed to lower rates amid softening growth and weaker labor momentum, gold is positioned to remain in demand. Lower yields reduce the opportunity cost of holding gold, making it more attractive in both institutional and retail portfolios.

          Market Outlook and Broader Commodities Performance

          At 1:15 p.m. in Singapore, bullion was trading at $3,359.81 per ounce, down just 0.1 percent from earlier highs. Silver edged up 0.2 percent, while palladium and platinum posted slight declines, reflecting the broader commodity market’s cautious mood. Equities, meanwhile, continued to edge lower, underscoring the risk-off sentiment dominating global markets.
          Gold’s ability to hold recent gains in the face of volatile macroeconomic developments reflects a deeper, sustained shift in investor strategy. As central bank policy becomes more accommodative and political risk undermines confidence in economic reporting and governance, bullion stands out as a durable asset. Unless labor data strengthens unexpectedly or tariff tensions de-escalate swiftly, gold’s position near record highs is likely to persist.

          Source: Bloomberg

          To stay updated on all economic events of today, please check out our Economic calendar
          Risk Warnings and Disclaimers
          You understand and acknowledge that there is a high degree of risk involved in trading. Following any strategies or investment methods may lead to potential losses. The content on the site is provided by our contributors and analysts for information purposes only. You are solely responsible for determining whether any trading assets, securities, strategy, or any other product is suitable for investing based on your own investment objectives and financial situation.
          Add to Favorites
          Share

          VinFast Targets India With $500 Million EV Factory Amid Asian Expansion Drive

          Gerik

          Economic

          VinFast Commits to India as Strategic Gateway for Asian and Global Growth

          Vietnamese automaker VinFast broke ground Monday on a $500 million electric vehicle (EV) factory in Thoothukudi, Tamil Nadu, marking its most ambitious international investment to date. The move is part of a $2 billion plan to build a foothold in India and strengthen its regional presence amid underwhelming performance in Western markets.
          The new plant is designed to produce 50,000 EVs annually in its initial phase, with future capacity expansion up to 150,000 units. VinFast aims to turn the factory into an export hub serving South Asia, the Middle East, and Africa. Located near a major port in one of India’s most industrialized states, the site was chosen after a competitive review of 15 potential locations across six Indian states.
          Tamil Nadu’s Industries Minister T.R.B. Raaja hailed the investment as a catalyst for the development of a new industrial cluster in southern India, noting that the state’s robust infrastructure and skilled workforce made it an ideal destination.

          Strategic Pivot Toward Asian Markets After Western Challenges

          VinFast’s entry into India signals a deliberate shift in corporate strategy following limited traction in the US and Europe. Although the company tripled its vehicle sales to nearly 97,000 in 2024, only a fraction of that volume came from international markets. In response, VinFast has intensified its focus on Asia, launching a $200 million facility in Indonesia and initiating market expansions in Thailand and the Philippines.
          India represents a particularly attractive opportunity due to its fast-growing automotive market, favorable EV policies, and still-fragmented competition. As the third-largest car market globally by volume, India is seen as essential for any automaker pursuing regional dominance.
          Analyst Ishan Raghav of autoX described India as a market that “no automaker in the world can ignore,” emphasizing its rising middle class and government-driven push for EV adoption.

          India’s EV Landscape Presents Opportunities and Obstacles

          The Indian EV market remains in its early stages but is expanding rapidly. While over 86 percent of EVs sold in 2024 were two- and three-wheelers, sales of passenger EVs rose sharply to more than 110,000 units from just 1,841 in 2019. Government targets aim for EVs to make up one-third of all passenger vehicle sales by 2030, a shift supported by tax breaks and incentives for domestic manufacturing.
          VinFast plans to debut in India with its VF6 and VF7 electric SUV models, designed specifically to meet the expectations of Indian consumers. The company also intends to establish 32 dealerships across 27 cities and collaborate with local firms to develop service centers and charging infrastructure.
          However, competition is fierce. Tata Motors, which holds around 50 percent of India’s EV market, was an early mover with its electric Nexon SUV. Other strong incumbents include Mahindra, Hyundai, MG Motors, and global luxury brands, all of which cater to different price tiers. VinFast’s challenge will be to carve out a niche that balances affordability, design appeal, and battery reliability for a value-conscious buyer base.

          VinFast Seeks to Fill the Gap Left by Chinese EV Giants

          VinFast’s expansion in India may be aided by the geopolitical headwinds facing Chinese automakers. Following military tensions between India and China in 2020, Chinese EV giants such as BYD faced restrictions on setting up direct manufacturing operations. Although some have formed joint ventures, the market remains difficult for Chinese brands to penetrate.
          VinFast, by contrast, enters the market without political baggage and stands to benefit from India’s aggressive localization incentives. Lower land prices, tax benefits, and import duties that discourage foreign-made vehicles further support VinFast’s decision to manufacture domestically.
          Tesla’s recent entry into India with the Model Y, priced at nearly $80,000, underscores the difficulty of relying on imported EVs in a price-sensitive market. In contrast, VinFast intends to produce key components like battery packs and powertrains locally to keep costs competitive.

          Winning Over Indian Consumers Requires Long-Term Commitment

          Despite the opportunities, building brand credibility in India will be a gradual process. VinFast must address the unique needs of Indian consumers, who often purchase EVs as secondary vehicles for city use due to limited intercity charging infrastructure. The company’s plans to recycle batteries and localize production will help contain costs, but trust in aftersales service, battery durability, and resale value will be critical factors in long-term adoption.
          Vivek Gulia of JMK Research noted that success hinges on pricing and consumer trust. "If VinFast can deliver on both, they can actually do really good," he said, drawing parallels to Hyundai’s multi-decade journey in the Indian market, which was aided by celebrity endorsements and product consistency.
          VinFast’s $500 million investment in Tamil Nadu marks more than a production milestone it is a strategic play to penetrate one of the world’s most promising but complex EV markets. With its clear localization strategy, absence of geopolitical baggage, and focus on regional exports, VinFast positions itself as a credible challenger in Asia’s rapidly evolving electric vehicle sector. Success in India may well determine whether the company can turn its domestic growth into a durable international presence.

          Source: Reuters

          To stay updated on all economic events of today, please check out our Economic calendar
          Risk Warnings and Disclaimers
          You understand and acknowledge that there is a high degree of risk involved in trading. Following any strategies or investment methods may lead to potential losses. The content on the site is provided by our contributors and analysts for information purposes only. You are solely responsible for determining whether any trading assets, securities, strategy, or any other product is suitable for investing based on your own investment objectives and financial situation.
          Add to Favorites
          Share
          FastBull
          Copyright © 2025 FastBull Ltd

          728 RM B 7/F GEE LOK IND BLDG NO 34 HUNG TO RD KWUN TONG KLN HONG KONG

          TelegramInstagramTwitterfacebooklinkedin
          App Store Google Play Google Play
          Products
          Charts

          Chats

          Q&A with Experts
          Screeners
          Economic Calendar
          Data
          Tools
          Membership
          Features
          Function
          Markets
          Copy Trading
          Latest Signals
          Contests
          News
          Analysis
          24/7
          Columns
          Education
          Company
          Careers
          About Us
          Contact Us
          Advertising
          Help Center
          Feedback
          User Agreement
          Privacy Policy
          Business

          White Label

          Data API

          Web Plug-ins

          Poster Maker

          Affiliate Program

          Risk Disclosure

          The risk of loss in trading financial instruments such as stocks, FX, commodities, futures, bonds, ETFs and crypto can be substantial. You may sustain a total loss of the funds that you deposit with your broker. Therefore, you should carefully consider whether such trading is suitable for you in light of your circumstances and financial resources.

          No decision to invest should be made without thoroughly conducting due diligence by yourself or consulting with your financial advisors. Our web content might not suit you since we don't know your financial conditions and investment needs. Our financial information might have latency or contain inaccuracy, so you should be fully responsible for any of your trading and investment decisions. The company will not be responsible for your capital loss.

          Without getting permission from the website, you are not allowed to copy the website's graphics, texts, or trademarks. Intellectual property rights in the content or data incorporated into this website belong to its providers and exchange merchants.

          Not Logged In

          Log in to access more features

          FastBull Membership

          Not yet

          Purchase

          Become a signal provider
          Help Center
          Customer Service
          Dark Mode
          Price Up/Down Colors

          Log In

          Sign Up

          Position
          Layout
          Fullscreen
          Default to Chart
          The chart page opens by default when you visit fastbull.com