• Trade
  • Markets
  • Copy
  • Contests
  • News
  • 24/7
  • Calendar
  • Q&A
  • Chats
Trending
Screeners
SYMBOL
LAST
BID
ASK
HIGH
LOW
NET CHG.
%CHG.
SPREAD
SPX
S&P 500 Index
6921.45
6921.45
6921.45
6931.27
6899.71
+0.52
+ 0.01%
--
DJI
Dow Jones Industrial Average
49266.10
49266.10
49266.10
49357.74
48792.34
+270.03
+ 0.55%
--
IXIC
NASDAQ Composite Index
23480.01
23480.01
23480.01
23558.17
23353.46
-104.26
-0.44%
--
USDX
US Dollar Index
98.680
98.760
98.680
98.710
98.620
+0.110
+ 0.11%
--
EURUSD
Euro / US Dollar
1.16485
1.16492
1.16485
1.16618
1.16458
-0.00095
-0.08%
--
GBPUSD
Pound Sterling / US Dollar
1.34272
1.34281
1.34272
1.34421
1.34241
-0.00126
-0.09%
--
XAUUSD
Gold / US Dollar
4470.88
4471.27
4470.88
4483.85
4452.75
-6.91
-0.15%
--
WTI
Light Sweet Crude Oil
58.036
58.071
58.036
58.318
57.857
-0.212
-0.36%
--

Community Accounts

Signal Accounts
--
Profit Accounts
--
Loss Accounts
--
View More

Become a signal provider

Sell trading signals to earn additional income

View More

Guide to Copy Trading

Get started with ease and confidence

View More

Signal Accounts for Members

All Signal Accounts

Best Return
  • Best Return
  • Best P/L
  • Best MDD
Past 1W
  • Past 1W
  • Past 1M
  • Past 1Y

All Contests

  • All
  • Trump Updates
  • Recommend
  • Stocks
  • Cryptocurrencies
  • Central Banks
  • Featured News
Top News Only
Share

Trump: Venezuela's Machado Coming In Next Week

Share

US President Trump: 14 Top Oil Companies Will Hold A Meeting At The White House Tomorrow

Share

Italian Prime Minister Meloni Will Visit South Korea From January 17 To 19

Share

US President Trump: We Are Acquiring Billions Of Dollars Worth Of Oil

Share

Trump Says Oil Companies Will Spend At Least $100 Billion

Share

Japan Finance Minister Katayama: Very Concerned About China's Export Control

Share

US President Trump: Demands Venezuela Release Political Prisoners

Share

US President Trump: Arresting Maduro Was Not A Difficult Decision

Share

US President Trump: I Will Be Interviewed By Sean Hannity And Fox News

Share

US President Trump: We Will Begin Cracking Down On Drug Cartels On Land

Share

Blue House: Italian Prime Minister To Visit South Korea

Share

Japan Finance Minister Katayama: Will Meet With Counterparts In Washington Jan 11-14 To Discuss Rare Earths Supplies

Share

Taiwan Dollar Slips To 31.6390 Per USA Dollar, Weakest Point Since Early May 2025

Share

According To China's National Bureau Of Statistics, The National Consumer Price Index Will Remain The Same As The Previous Year In 2025

Share

Conocophillips: Conocophillips Continues To Monitor Developments In Venezuela And Their Potential Implications For Global Energy Supply And Stability

Share

Inflation Rate Year On Year For Dec In China Is 0.8%, Higher Than The Previous Value Of 0.7%. The Forecast Was 0.9%

Share

Dollar/Offshore Yuan Last Down 0.1% At 6.9772 Yuan After Inflation Data

Share

China Dec Non-Food CPI +0.8% Year-On-Year

Share

China's National Bureau Of Statistics Reported That China's CPI Rose 0.2% Month-on-month In December (median Forecast In A Reuters Poll Was 0.1%) And 0.8% Year-on-Year

Share

China's CSI Battery Index Set To Open Down 0.5% After Governor Warns Battery Makers Of Overcapacity Risks

TIME
ACT
FCST
PREV
France 10-Year OAT Auction Avg. Yield

A:--

F: --

P: --

Euro Zone Consumer Inflation Expectations (Dec)

A:--

F: --

P: --

Euro Zone Unemployment Rate (Nov)

A:--

F: --

P: --

Euro Zone PPI MoM (Nov)

A:--

F: --

P: --

Euro Zone Selling Price Expectations (Dec)

A:--

F: --

P: --

Euro Zone PPI YoY (Nov)

A:--

F: --

P: --

Mexico 12-Month Inflation (CPI) (Dec)

A:--

F: --

P: --

Mexico Core CPI YoY (Dec)

A:--

F: --

P: --

Mexico PPI YoY (Dec)

A:--

F: --

P: --

Mexico CPI YoY (Dec)

A:--

F: --

P: --

U.S. Challenger Job Cuts MoM (Dec)

A:--

F: --

P: --

U.S. Challenger Job Cuts (Dec)

A:--

F: --

P: --

U.S. Challenger Job Cuts YoY (Dec)

A:--

F: --

P: --

U.S. Exports (Oct)

A:--

F: --

P: --

U.S. Trade Balance (Oct)

A:--

F: --

P: --
U.S. Initial Jobless Claims 4-Week Avg. (SA)

A:--

F: --

P: --
Canada Imports (SA) (Oct)

A:--

F: --

P: --
U.S. Weekly Initial Jobless Claims (SA)

A:--

F: --

P: --
U.S. Weekly Continued Jobless Claims (SA)

A:--

F: --

P: --
Canada Exports (SA) (Oct)

A:--

F: --

P: --
Canada Trade Balance (SA) (Oct)

A:--

F: --

P: --
U.S. Unit Labor Cost Prelim (SA) (Q3)

A:--

F: --

P: --

U.S. Wholesale Sales MoM (SA) (Oct)

A:--

F: --

P: --

U.S. EIA Weekly Natural Gas Stocks Change

A:--

F: --

P: --

U.S. Consumer Credit (SA) (Nov)

A:--

F: --

P: --
U.S. Weekly Treasuries Held by Foreign Central Banks

A:--

F: --

P: --

Japan Foreign Exchange Reserves (Dec)

A:--

F: --

P: --

China, Mainland CPI YoY (Dec)

A:--

F: --

P: --

China, Mainland PPI YoY (Dec)

A:--

F: --

P: --

China, Mainland CPI MoM (Dec)

A:--

F: --

P: --

Japan Leading Indicators Prelim (Nov)

--

F: --

P: --

Germany Industrial Output MoM (SA) (Nov)

--

F: --

P: --

Germany Exports MoM (SA) (Nov)

--

F: --

P: --
France Industrial Output MoM (SA) (Nov)

--

F: --

P: --

Italy Retail Sales MoM (SA) (Nov)

--

F: --

P: --

Euro Zone Retail Sales MoM (Nov)

--

F: --

P: --

Euro Zone Retail Sales YoY (Nov)

--

F: --

P: --

Italy 12-Month BOT Auction Avg. Yield

--

F: --

P: --

India Deposit Gowth YoY

--

F: --

P: --

Brazil IPCA Inflation Index YoY (Dec)

--

F: --

P: --

Mexico Industrial Output YoY (Nov)

--

F: --

P: --

Brazil CPI YoY (Dec)

--

F: --

P: --

U.S. Building Permits Revised YoY (SA) (Sept)

--

F: --

P: --

U.S. Building Permits Revised MoM (SA) (Sept)

--

F: --

P: --

U.S. Average Hourly Wage MoM (SA) (Dec)

--

F: --

P: --

U.S. Average Weekly Working Hours (SA) (Dec)

--

F: --

P: --

U.S. Annual New Housing Starts (SA) (Oct)

--

F: --

P: --

U.S. U6 Unemployment Rate (SA) (Dec)

--

F: --

P: --

U.S. Manufacturing Employment (SA) (Dec)

--

F: --

P: --

U.S. Labor Force Participation Rate (SA) (Dec)

--

F: --

P: --

U.S. Private Nonfarm Payrolls (SA) (Dec)

--

F: --

P: --

U.S. Unemployment Rate (SA) (Dec)

--

F: --

P: --

U.S. Nonfarm Payrolls (SA) (Dec)

--

F: --

P: --

U.S. Average Hourly Wage YoY (Dec)

--

F: --

P: --

Canada Full-time Employment (SA) (Dec)

--

F: --

P: --

Canada Part-Time Employment (SA) (Dec)

--

F: --

P: --

Canada Unemployment Rate (SA) (Dec)

--

F: --

P: --

Canada Labor Force Participation Rate (SA) (Dec)

--

F: --

P: --

Q&A with Experts
    • All
    • Chatrooms
    • Groups
    • Friends
    Kevedge FX flag
    Kevedge FX flag
    Kevedge FX flag
    ethane
    @ethane give us your good idea bro
    Kevedge FX flag
    watch mine play out pefectly
    Kevedge FX flag
    Kevedge FX flag
    more sell volume will drop
    Kevedge FX flag
    Ghost👻 flag
    and views on GBPUSD?
    Ghost👻 flag
    any
    Izuul flag
    Good day everyone
    mukesh jha flag
    All my dear topachand
    mukesh jha flag
    mukesh jha flag
    4479 TGT DOT HIT ENJOY LIFE AND WIFE
    mukesh jha flag
    A
    mukesh jha flag
    Kevedge FX flag
    ethane
    @ethane@ethane SEE IT PLAY OUT
    Kevedge FX flag
    mukesh jha flag
    01:14
    mukesh jha flag
    ALL TOPA SELLER OUT SELL SIDE WHY NOT WHO NOT SEE NOT ENJOY ALL TOPACHAND
    mukesh jha flag
    Type here...
    Add Symbol or Code

      No matching data

      All
      Trump Updates
      Recommend
      Stocks
      Cryptocurrencies
      Central Banks
      Featured News
      • All
      • Russia-Ukraine Conflict
      • Middle East Flashpoint
      • All
      • Russia-Ukraine Conflict
      • Middle East Flashpoint

      Search
      Products

      Charts Free Forever

      Chats Q&A with Experts
      Screeners Economic Calendar Data Tools
      Membership Features
      Data Warehouse Market Trends Institutional Data Policy Rates Macro

      Market Trends

      Market Sentiment Order Book Forex Correlations

      Top Indicators

      Charts Free Forever
      Markets

      News

      News Analysis 24/7 Columns Education
      From Institutions From Analysts
      Topics Columnists

      Latest Views

      Latest Views

      Trending Topics

      Top Columnists

      Latest Update

      Signals

      Copy Rankings Latest Signals Become a signal provider AI Rating
      Contests
      Brokers

      Overview Brokers Assessment Rankings Regulators News Claims
      Broker listing Forex Brokers Comparison Tool Live Spread Comparison Scam
      Q&A Complaint Scam Alert Videos Tips to Detect Scam
      More

      Business
      Events
      Careers About Us Advertising Help Center

      White Label

      Data API

      Web Plug-ins

      Affiliate Program

      Awards Institution Evaluation IB Seminar Salon Event Exhibition
      Vietnam Thailand Singapore Dubai
      Fans Party Investment Sharing Session
      FastBull Summit BrokersView Expo
      Recent Searches
        Top Searches
          Markets
          News
          Analysis
          User
          24/7
          Economic Calendar
          Education
          Data
          • Names
          • Latest
          • Prev

          View All

          No data

          Scan to Download

          Faster Charts, Chat Faster!

          Download App
          English
          • English
          • Español
          • العربية
          • Bahasa Indonesia
          • Bahasa Melayu
          • Tiếng Việt
          • ภาษาไทย
          • Français
          • Italiano
          • Türkçe
          • Русский язык
          • 简中
          • 繁中
          Open Account
          Search
          Products
          Charts Free Forever
          Markets
          News
          Signals

          Copy Rankings Latest Signals Become a signal provider AI Rating
          Contests
          Brokers

          Overview Brokers Assessment Rankings Regulators News Claims
          Broker listing Forex Brokers Comparison Tool Live Spread Comparison Scam
          Q&A Complaint Scam Alert Videos Tips to Detect Scam
          More

          Business
          Events
          Careers About Us Advertising Help Center

          White Label

          Data API

          Web Plug-ins

          Affiliate Program

          Awards Institution Evaluation IB Seminar Salon Event Exhibition
          Vietnam Thailand Singapore Dubai
          Fans Party Investment Sharing Session
          FastBull Summit BrokersView Expo

          Pressure at 4500! Gold to Correct to Around 4200

          Tank

          Commodity

          Forex

          Summary:

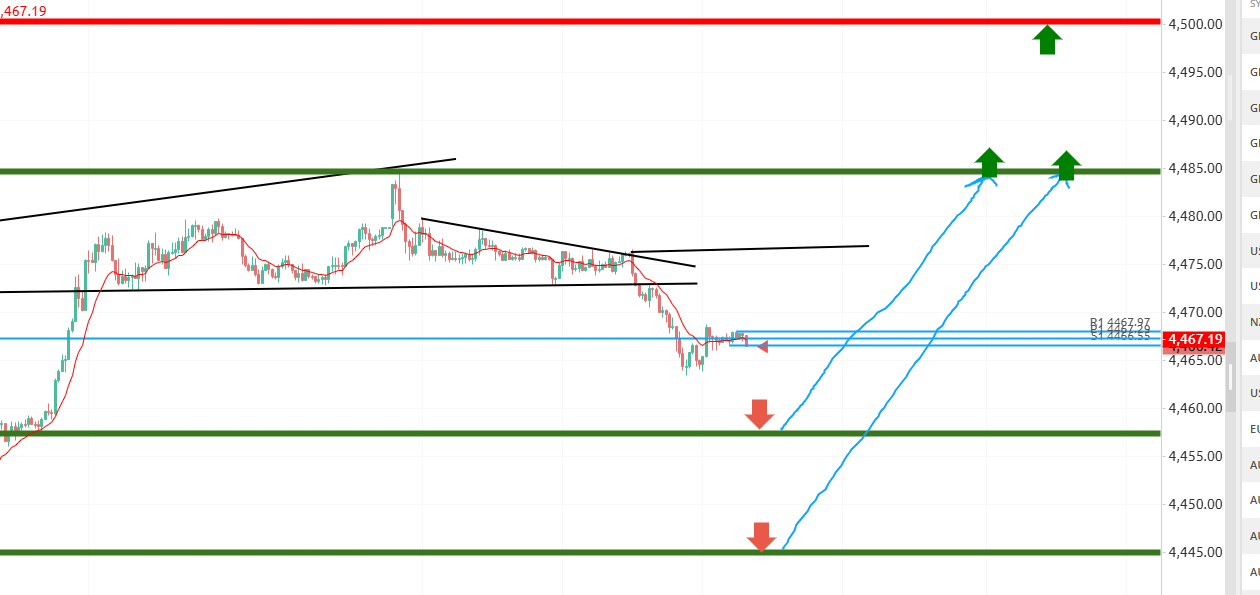
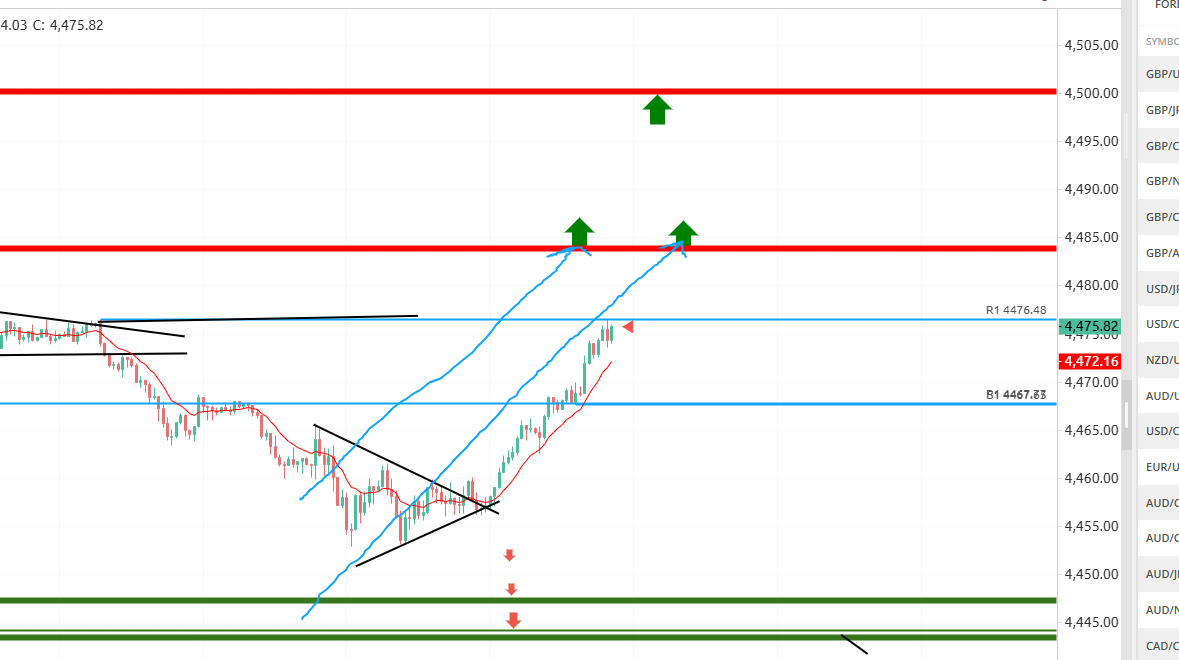
          Investors are still digesting the recent U.S. strikes on Venezuela. The underlying bullish sentiment has also become a key factor triggering profit-taking in precious metals. However, escalating geopolitical tensions and market expectations of a dovish stance from the Fed appear to be limiting gold's downside potential.

          SELL XAUUSD
          Close Time
          CLOSED

          4464.48

          Entry Price

          4100.00

          TP

          4600.00

          SL

          4470.88 -6.91 -0.15%

          199.8

          Pips

          Profit

          4100.00

          TP

          4444.50

          Exit Price

          4464.48

          Entry Price

          4600.00

          SL

          Fundamentals

          Earlier this week, U.S. President Trump made confrontational remarks about Colombia and Mexico, and then threatened to annex Greenland. In addition, traders have been pricing in expectations of two more rate cuts by the Fed. Nevertheless, this failed to sustain the U.S. dollar's previous day's rally; instead, it may offer some support to non-interest-bearing gold. Traders may also choose to wait for the release of key U.S. macroeconomic data, including the non-farm payroll report due on Friday.
          Furthermore, factors such as the lack of progress in the Russia-Ukraine peace talks, the volatile situation in Iran, and the Gaza issue have heightened geopolitical risks, which may underpin the price of gold—a traditional safe-haven asset. Holdings of SPDR Gold Trust, the world's largest gold ETF, rose by 2 tons from the previous day to reach 1,067.13 tons currently.
          In terms of institutional views, Morgan Stanley forecasts that gold prices are expected to climb to $4,800 per ounce by the Q4 of this year, surpassing the previous record high. The bank pointed out that the main drivers behind the upward trend of gold prices include the downward interest rate trend, expectations of a leadership reshuffle at the Fed, and the sustained allocation demand from central banks and institutional funds.
          The latest economic data showed that the expansion pace of the U.S. service sector slowed down. The S&P Global U.S. Services PMI final reading for December came in at 52.5, down from the prior reading of 54.1 and the market consensus of 54, hitting an eight-month low. Sub-item data indicated that the growth rate of new orders fell to a 20-month low, with businesses widely citing demand uncertainties caused by tariff policies and weakening consumer spending momentum. Meanwhile, affected by trade frictions, export orders recorded the sharpest decline since May. Additionally, due to falling capacity demand and budget constraints, employment scale saw a slight contraction for the first time in nine months, reflecting signs of moderate slowdown in economic momentum.
          On the monetary policy front, recent remarks from Fed officials have highlighted their cautious attitude towards future interest rate adjustments. Thomas Barkin, President of the Fed Bank of Richmond, noted that future rate decisions need to be more refined to strike a balance between curbing inflation and avoiding a significant rise in the unemployment rate. Further, Fed Governor Michelle Bowman stated that more than 100 bps of rate cuts may be needed in 2026. Currently, interest rate futures markets still reflect traders' expectations of two rate cuts in 2024. However, the probability of a rate cut at the January meeting is only around 16.1%, indicating that the market remains cautious about a near-term policy pivot.

          Technical Analysis

          On the 1-hour chart, the Bollinger Bands are contracting and narrowing, with moving averages flattening out, suggesting that a trend reversal could occur at any time. In the short term, gold may still test the levels around 4485 and 4500. If it fails to break through the new high, it is highly likely to drop to around the EMA200, with the price hovering near 4288. The MACD has formed a bearish crossover, and upward momentum is gradually weakening. The fast and slow lines are pulling back towards the zero axis, indicating that the correction is drawing to a close. The RSI stands at 49, placing the market in a neutral consolidation zone.
          On the 15-minute chart, after breaking below the lower Bollinger Band, the price rebounded quickly to around the middle Bollinger Band. The MACD has formed a bullish crossover, with the fast and slow lines pulling back towards the zero axis but still remaining some distance away, suggesting that the rebound is not yet complete. The RSI is at 49, reflecting investors' indecision in the market. Therefore, the proposed trading strategy is to go short first and then long.
          Pressure at 4500! Gold to Correct to Around 4200_1Pressure at 4500! Gold to Correct to Around 4200_2

          Trade Recommendations

          Trade Direction: Sell
          Entry Price: 4485
          Target Price: 4100
          Stop Loss: 4600
          Support: 4200/4100/3800
          Resistance: 4530/4550/5000
          Risk Warnings and Disclaimers
          You understand and acknowledge that there is a high degree of risk involved in trading. Following any strategies or investment methods may lead to potential losses. The content on the site is provided by our contributors and analysts for information purposes only. You are solely responsible for determining whether any trading assets, securities, strategy, or any other product is suitable for investing based on your own investment objectives and financial situation.
          Add to Favorites
          Share

          Overall Trend Is Bullish, with Short-Term Volatility Persisting

          Alan

          Commodity

          Summary:

          The fundamental analysis continues to support a bullish outlook for gold, but technical indicators suggest that gold is currently in a consolidation phase, likely to remain range-bound between 4,550 and 4,300 in the short term.

          SELL XAUUSD
          Close Time
          CLOSED

          4465.11

          Entry Price

          4340.00

          TP

          4505.00

          SL

          4470.88 -6.91 -0.15%

          165.1

          Pips

          Profit

          4340.00

          TP

          4448.60

          Exit Price

          4465.11

          Entry Price

          4505.00

          SL

          Fundamentals

          Recent bullish fundamentals support for gold prices include: firstly, the escalating market expectation of additional Federal Reserve rate cuts, with the first easing since the year's start exerting downward pressure on nominal and real interest rates, thereby reducing the opportunity cost of gold holdings and enhancing its relative appeal. Secondly, persistent inflows into gold-related ETFs from institutional and passive funds indicate strong capital flows, with institutional buying and ETF net inflows establishing visible demand fundamentals for physical gold. Thirdly, multiple investment banks and research institutions have revised their medium-term gold price forecasts upward, suggesting further upside potential driven by declining interest rates and central bank purchase strategies (e.g., Morgan Stanley's optimistic outlook).
          Overall, these factors underpin the logic of support for high-level gold prices: short-term market signals (U.S. Treasury yields, dollar strength, key economic data) may cause volatility, but medium-term expectations remain predominantly bullish due to sustained capital flows and policy outlooks.

          Technical Analysis

          Overall Trend Is Bullish, with Short-Term Volatility Persisting_1
          In the 1D timeframe, gold is currently consolidating at elevated levels. Until the resistance at 4,550 is broken, it is likely to remain within a range of 4,300 to 4,550 in the near term. However, the SMA system still maintains a bullish alignment, indicating that the medium- to long-term trend remains upward.
          Overall Trend Is Bullish, with Short-Term Volatility Persisting_2
          In the 1H timeframe, recent candlestick patterns suggest the formation of a Head and Shoulders top structure. If gold fails to break above 4,475 in the short term and the 1H candlesticks close lower, it indicates the right shoulder of the pattern is forming, and bearish momentum will significantly increase. The initial target could be a decline below 4,400.

          Trading Recommendations

          Trading Direction: Sell
          Entry Price: 4465.00
          Target Price: 4340.00
          Stop Loss: 4505.00
          Valid Until: January 21, 2026 23:00:00
          Support: 4397.00, 4333.00
          Resistance: 4475.00, 4500.00
          Risk Warnings and Disclaimers
          You understand and acknowledge that there is a high degree of risk involved in trading. Following any strategies or investment methods may lead to potential losses. The content on the site is provided by our contributors and analysts for information purposes only. You are solely responsible for determining whether any trading assets, securities, strategy, or any other product is suitable for investing based on your own investment objectives and financial situation.
          Add to Favorites
          Share

          Potential Double Top Formation Signals Imminent Bearish Correction

          Manuel

          Forex

          Economic

          Summary:

          If the price fails to breach this level and reacts to the downside once more, we could anticipate a corrective move toward the 0.5302 zone.

          SELL AUDCHF
          EXP
          TRADING

          0.53700

          Entry Price

          0.53050

          TP

          0.53850

          SL

          0.53543 +0.00061 +0.11%

          0.0

          Pips

          Flat

          0.53050

          TP

          Exit Price

          0.53700

          Entry Price

          0.53850

          SL

          Domestic indicators from Switzerland continue to reflect a fragile environment for business activity. The SVME Purchasing Managers' Index (PMI) recorded a sharp contraction in December, tumbling to 45.8 from the previous 49.7. This reading signifies a deepening downturn in the Swiss manufacturing sector, underscoring persistent structural weakness.
          Market participants are now shifting their focus toward upcoming Swiss inflation data, scheduled for release this Thursday. Projections suggest the Consumer Price Index (CPI) will show a monthly decline of 0.1% in December, following a prior 0.2% drop. Conversely, year-over-year inflation is expected to see a marginal uptick to 0.1% from 0.0%. Any print falling below these estimates could intensify fears of a structurally low-inflation environment, potentially pressuring the Swiss National Bank (SNB) to reconsider a return to negative interest rates.
          Across the globe, the latest data from the Australian Bureau of Statistics (ABS), released on Wednesday, confirmed that inflationary pressures in Australia continued to moderate in November. The monthly CPI indicator advanced by 3.4% year-over-year, coming in notably lower than the previous 3.8% and underscoring a faster deceleration than the market’s expected 3.7% growth. Regarding underlying measures, the RBA’s Trimmed Mean CPI increased by 0.3% month-over-month and 3.2% annually. Meanwhile, the headline monthly CPI remained stagnant at 0%, unchanged from the prior reading.
          This inflationary backdrop, alongside resilient business conditions and stable economic growth, led the Reserve Bank of Australia (RBA) to maintain the Official Cash Rate (OCR) at 3.6% during its December policy meeting. During the subsequent press conference, Governor Michele Bullock emphasized that the trajectory of inflation and labor market health will be the primary determinants for the Board’s February session. She reiterated that there is no predetermined schedule for future adjustments, stressing that policy decisions remain strictly "meeting-by-meeting." Since that session, the Australian labor market has begun to lose momentum; total employment contracted by 21,300 in November, driven by a significant loss of 56,500 full-time positions, even as the unemployment rate held steady at 4.3%.Potential Double Top Formation Signals Imminent Bearish Correction_1

          Technical Analysis

          The AUD/CHF pair has recently enjoyed a powerful bullish impulse, but the rally is now testing a critical resistance ceiling at 0.5362. This specific level matches the peak established on December 9th, where the price previously suffered a sharp bearish rejection.
          Technically, this formation is developing into a Double Top, a classic bearish reversal pattern that signals the potential exhaustion of buyers. If the price fails to breach this level and reacts to the downside once more, we could anticipate a corrective move toward the 0.5302 zone. This area is significant as it aligns with the 0.50 and 0.618 Fibonacci retracement levels, a common magnet for corrective price action within an established trend.
          Support for this corrective thesis is further bolstered by the 100 and 200-period Moving Averages (MAs), currently situated at 0.5287 and 0.5294, respectively. The proximity of these MAs to the Fibonacci cluster adds substantial technical weight to the 0.5300 area as a primary downside objective.
          Furthermore, the Relative Strength Index (RSI) has climbed to 72, signaling overbought conditions. Crucially, this RSI peak is lower than the high recorded in December despite the price being at the same level—a subtle bearish divergence that suggests buying power is waning.
          Traders should remain vigilant: while the Double Top setup is compelling, a decisive daily close above 0.5362 would invalidate the bearish outlook and likely clear the path for a continued bullish extension toward new highs.

          Trading Recommendations

          Trading direction: Sell
          Entry price: 0.5370
          Target price: 0.5305
          Stop loss: 0.5385
          Validity: Jan 16, 2025 15:00:00
          Risk Warnings and Disclaimers
          You understand and acknowledge that there is a high degree of risk involved in trading. Following any strategies or investment methods may lead to potential losses. The content on the site is provided by our contributors and analysts for information purposes only. You are solely responsible for determining whether any trading assets, securities, strategy, or any other product is suitable for investing based on your own investment objectives and financial situation.
          Add to Favorites
          Share

          Extreme RSI Levels Signal Potential Bullish Reversal at Key Support

          Manuel

          Forex

          Economic

          Summary:

          These extreme levels typically signal that bearish exhaustion is setting in, as selling pressure reaches a climax.

          BUY EURAUD
          Close Time
          CLOSED

          1.73497

          Entry Price

          1.75600

          TP

          1.72400

          SL

          1.73990 -0.00026 -0.01%

          19.0

          Pips

          Profit

          1.72400

          SL

          1.73687

          Exit Price

          1.73497

          Entry Price

          1.75600

          TP

          The Australian Consumer Price Index (CPI) is projected to record an annual increase of 3.7% for November. This reflects a slight moderation from the 3.8% observed in October—a figure that marked the highest inflation peak since June 2024 and notably exceeded the median forecast of 3.6%. It is crucial to note that the Reserve Bank of Australia’s (RBA) official target range remains firmly between 2% and 3%.
          In October, the month-over-month CPI remained unchanged, yet underlying inflation—measured by the trimmed mean CPI—accelerated to an annual rate of 3.3%. Improved business conditions, coupled with robust economic growth and higher-than-anticipated inflation, prompted the central bank to maintain the Official Cash Rate (OCR) at 3.6% during its December policy meeting.
          RBA Governor Michele Bullock emphasized that "inflation and employment data will be pivotal for the Board's meeting in February," refraining from setting a specific timeline for future adjustments as the bank continues its "meeting-by-meeting" evaluative approach. However, recent labor data suggests the Australian market is beginning to cool, evidenced by a loss of 21,300 jobs in November and a sharp reduction of 56,500 full-time positions, even as the unemployment rate held steady at 4.3%.
          On the European front, annual inflation in Germany, measured by the Consumer Price Index (CPI), fell to 1.8% year-over-year in December, down from 2.3% in November, according to Destatis. Monthly CPI remained flat, undershooting market expectations of a 0.2% increase. Meanwhile, the Harmonized Index of Consumer Prices (HICP)—the European Central Bank’s (ECB) preferred metric—rose by 2% year-over-year, falling below the anticipated 2.2%.
          While Spain's services sector gained momentum with the HCOB Services PMI rising to 57.1, Italy’s activity lost traction, falling to 51.5. In France, business conditions remained fragile, with the Composite PMI hovering at the 50.0 stagnation mark.Extreme RSI Levels Signal Potential Bullish Reversal at Key Support_1

          Technical Analysis

          The EUR/AUD pair has experienced a significant bearish impulse following a decisive break below the 1.7485 support zone. This breakout effectively cleared the path for a fresh downward leg. However, the price is now approaching historical support levels near 1.7310, a region last tested in May of the previous year.
          The definitive local low established during that period was 1.7250, a level that previously served as a launchpad for a massive bullish rally. Should the price exhibit a similar reaction in the current cycle, we could see the beginning of a significant bullish reversal from this critical floor.
          From a technical perspective, the 100 and 200-period Moving Averages (MAs) on the 12-hour chart are currently situated at 1.7674 and 1.7755, respectively. Given that the price is trading at a significant distance from these averages, the pair is considered overextended, making a corrective move to the upside increasingly probable.
          Furthermore, the Relative Strength Index (RSI) has plunged to a minimum of 24, placing the pair deep within oversold territory. These extreme levels typically signal that bearish exhaustion is setting in, as selling pressure reaches a climax. Consequently, institutional and retail operators are likely shifting their focus toward potential long positions, as the extreme RSI readings suggest the current downward momentum is losing its viability.
          Trading Recommendations
          Trading direction: Buy
          Entry price: 1.7350
          Target price: 1.7560
          Stop loss: 1.7240
          Validity: Jan 16, 2025 15:00:00
          Risk Warnings and Disclaimers
          You understand and acknowledge that there is a high degree of risk involved in trading. Following any strategies or investment methods may lead to potential losses. The content on the site is provided by our contributors and analysts for information purposes only. You are solely responsible for determining whether any trading assets, securities, strategy, or any other product is suitable for investing based on your own investment objectives and financial situation.
          Add to Favorites
          Share

          Risks at High Levels Are Mounting Amid Heightened Risk Aversion

          Eva Chen

          Commodity

          Summary:

          Spot gold extended gains on Tuesday as geopolitical tensions and expectations of Federal Reserve easing boosted demand.

          SELL XAUUSD
          Close Time
          CLOSED

          4489.18

          Entry Price

          4300.00

          TP

          4578.00

          SL

          4470.88 -6.91 -0.15%

          285.8

          Pips

          Profit

          4300.00

          TP

          4460.60

          Exit Price

          4489.18

          Entry Price

          4578.00

          SL

          Fundamentals

          Spot gold extended gains on Tuesday after U.S. sanctions against Venezuela boosted its appeal as a safe-haven asset. Should geopolitical tensions escalate further or upcoming U.S. data reinforce expectations that the Federal Reserve will need to adopt more aggressive easing measures than currently anticipated, gold could well march toward new record highs.
          Minneapolis Fed President Kashkari stated on Monday that U.S. monetary policy may be “very close to neutral.” (Bullish for gold)
          In an interview with CNBC, Kashkari stated that policymakers now need to determine whether inflation or labor market dynamics will become the dominant force shaping the economic outlook. “Then, we can adjust our policy stance from the current neutral position as needed,” he added.
          Regarding inflation, Kashkari cautioned that the primary risk lies in its persistence, particularly as tariff-related price pressures may take “several years” to fully permeate the economy.
          Regarding geopolitics, Kashkari stated that the primary economic risk stemming from the Trump administration's weekend arrest of the Venezuelan leader would manifest in rising oil prices. He drew parallels to Russia's invasion of Ukraine, noting that commodity shocks—rather than the political events themselves—are the most likely direct channel to impact the U.S. economy.
          In 2026, Kashkari will become a voting member of the Federal Open Market Committee, giving his remarks greater weight.
          Risks at High Levels Are Mounting Amid Heightened Risk Aversion_1

          Technical Analysis

          Gold has just experienced its strongest annual performance since 1979. However, in the short term, gold prices may face pressure from commodity index rebalancing, which could prompt passive funds to reduce positions following last year's record-breaking rally. Therefore, despite gold's robust MACD and RSI momentum indicators, investors (long positions) should avoid chasing prices. Particularly with the initial sell-off level (US$4,365) fully recovered, the market could trigger significant selling pressure due to a shortage of upward positions. With the current resistance at US$4,470、4,495 acting as a cap, the path of least risk is downward.

          Trading Recommendations

          Trading Direction: Sell
          Entry Price: 4509
          Target Price: 4300
          Stop Loss: 4578
          Valid Until: January 21, 2026 23:55:00
          Support: 4403, 4375, 4331
          Resistance: 4472, 4499, 4527
          Risk Warnings and Disclaimers
          You understand and acknowledge that there is a high degree of risk involved in trading. Following any strategies or investment methods may lead to potential losses. The content on the site is provided by our contributors and analysts for information purposes only. You are solely responsible for determining whether any trading assets, securities, strategy, or any other product is suitable for investing based on your own investment objectives and financial situation.
          Add to Favorites
          Share

          XAU/USD reversing from extreme area

          Gerik

          Commodity

          Summary:

          XAU/USD is trading near $4,460–$4,490/oz, with spot and futures prices confirming levels above $4,470 intraday. Price has reached a one-week high driven by safe-haven flows...

          SELL XAUUSD
          Close Time
          CLOSED

          4480.00

          Entry Price

          4430.00

          TP

          4520.00

          SL

          4470.88 -6.91 -0.15%

          500.0

          Pips

          Profit

          4430.00

          TP

          4429.81

          Exit Price

          4480.00

          Entry Price

          4520.00

          SL

          Current market context and macro drivers

          Gold remains elevated, with spot trading near $4,480/oz and a daily range from roughly $4,428 to ~$4,490 today, marking continued upward pressure. Today’s rally has been driven by a combination of geopolitical tensions (U.S.–Venezuela conflict) and markets pricing in potential Fed rate cuts amid cooling U.S. data, both classic catalysts for safe-haven demand.
          However, this strong advance has pushed XAU/USD into stretched technical territory, especially on lower timeframes. When volatility expands rapidly with large unsecured advances, short-term buyers may begin locking profits, creating an environment ripe for pullbacks. Added to this, declining futures open interest and lower trading volumes suggest participation is thinning even as prices stay near highs.

          Market sentiment

          On the M15 timeframe, sentiment remains dominated by reaction to headlines and intraday positioning, rather than clean trend continuation. The move above $4,470/oz signals strong short-term bullish conviction, but repeated tests of upper resistance without significant follow-through often lead to short-term exhaustion and corrective retracements.
          Traders adjusting positions in response to extended intraday moves especially in holiday-affected liquidity conditions tend to lean toward profit taking near local extremes. With price currently at the upper end of its intraday range and volatility high, caution among bulls is likely emerging, which can amplify pullbacks when technical support levels are probed.

          Technical analysis

          XAU/USD reversing from extreme area_1
          On M15, gold price is situated near the upper Bollinger Band, indicating a period of high volatility and overextension rather than balanced price discovery. When repeated upper band tests fail to produce a breakout, the probability of a pullback toward the mid-band increases.
          Bollinger Bands: Daily spikes have stretched the bands, and price staying near the upper band without a clean breakout suggests short-term exhaustion. A close back inside the bands after an extended move often signals fading upside momentum, paving the way for tactical shorts.
          Ichimoku (9,26,52): While price is above the cloud consistent with a broader bull context on M15 the Kijun-sen and cloud boundary act as dynamic equilibrium. If price begins to slip and fails to reclaim the upper cloud resistance on retests, it signals a shift from short-term control by buyers to sellers.
          Stoch (5,3,3): The oscillator is likely in overbought territory after strong advances. A bearish stochastic crossover from high levels particularly if price also struggles to stay above the Bollinger upper band would confirm that downward pressure is building.
          Key dynamic levels today:
          Resistance/entry zone: $4,480–$4,500/oz (upper Bollinger resistance + recent intraday high cluster)
          Immediate support: $4,430–$4,445/oz (mid-band area + short-term pivot)
          Lower support buffer: $4,380–$4,400/oz (lower band confluence)

          Trade recommendation

          Entry: $4,480–$4,500/oz
          Take Profit: $4,430/oz
          Stop Loss: $4,520/oz
          Risk Warnings and Disclaimers
          You understand and acknowledge that there is a high degree of risk involved in trading. Following any strategies or investment methods may lead to potential losses. The content on the site is provided by our contributors and analysts for information purposes only. You are solely responsible for determining whether any trading assets, securities, strategy, or any other product is suitable for investing based on your own investment objectives and financial situation.
          Add to Favorites
          Share

          USD/JPY retreats after extended rally

          Gerik

          Forex

          Economic

          Summary:

          USD/JPY is trading around 156.3–156.7, retreating slightly from recent highs after dipping from daily peaks near 157.29. Despite longer-term structural strength in the dollar–yen pair, short-term macro cues and technical compression on M15 suggest a tactical sell opportunity if price shows rejection at the upper range, fails to sustain above dynamic resistance, and momentum rolls over

          SELL USDJPY
          Close Time
          CLOSED

          156.750

          Entry Price

          155.600

          TP

          157.450

          SL

          157.179 +0.321 +0.20%

          0.8

          Pips

          Profit

          155.600

          TP

          156.742

          Exit Price

          156.750

          Entry Price

          157.450

          SL

          Overview

          USD/JPY currently sits around ~156.35–156.75, maintaining levels close to intraday highs but lacking decisive follow-through beyond 157.0. Live mid-market data shows a slightly weaker dollar against the yen compared with the previous day’s attempt to push higher, reflecting hesitation at elevated levels.
          Macro drivers are shifting. Today’s FX session shows the U.S. dollar weakening broadly after a brief rebound, pressured by easing geopolitical anxiety and softer U.S. manufacturing data that diminished safe-haven demand. This move has seen the dollar index slide for a second straight day, with the yen benefiting as USD/JPY slips off session peaks.
          On the policy front, the Bank of Japan has vowed to continue raising interest rates if data supports it, which could strengthen the yen over time and contribute to corrective pressure on USD/JPY. While this is a broader timeframe factor, it feeds into short-term sentiment that speculative upside may be limited and that rallies are being sold into near resistance.

          Market sentiment

          Short-term sentiment on the M15 timeframe shows buyers losing steam near the upper part of the recent range, with price failing to sustain a breakout above 157.0–157.3. USD/JPY remains range-bound within a narrow band earlier in the Asian session, suggesting that the pair is in distribution mode rather than trend continuation at these levels.
          This dynamic is compounded by broader USD softness and improved risk appetite, which tends to benefit funding-clearer currencies like JPY when the dollar is not aggressively bid. The inability to push convincingly higher leaves space for tactical sellers to target short-term resistance clusters and dynamic supply zones typical of year-end flows.

          Technical analysis

          USD/JPY retreats after extended rally_1
          On M15, USD/JPY price has been testing the upper Bollinger Band, indicating that the rally is stretched on the intraday timeframe. Stalling near the upper band and repeated failures to break above 157.0 imply that upside volatility is becoming exhausted. A rejection candlestick near that band or a close back inside the BB range can be an early signal that bulls are losing grip.
          The Ichimoku (9,26,52) on M15 shows price near the upper equilibrium zone and struggling to establish sustained closes above the Kijun-sen and cloud. This suggests that short-term balance is at a pivot point and that the downward edge can be tested when dynamic resistances hold.
          Stoch (5,3,3) remains in neutral to slightly overbought territory. If a bearish crossover occurs near the upper band while prices hover below dynamic resistance, it will signal that sellers are gaining momentum within the range.
          Support and resistance:
          Resistance: ~157.0–157.3 (upper range barrier and dynamic supply)
          Support: ~155.6–155.8 (lower BB area and recent range support)

          Trade recommendation

          Entry: 156.75–157.10
          Take Profit: 155.60
          Stop Loss: 157.45
          Risk Warnings and Disclaimers
          You understand and acknowledge that there is a high degree of risk involved in trading. Following any strategies or investment methods may lead to potential losses. The content on the site is provided by our contributors and analysts for information purposes only. You are solely responsible for determining whether any trading assets, securities, strategy, or any other product is suitable for investing based on your own investment objectives and financial situation.
          Add to Favorites
          Share
          FastBull
          Copyright © 2026 FastBull Ltd

          728 RM B 7/F GEE LOK IND BLDG NO 34 HUNG TO RD KWUN TONG KLN HONG KONG

          TelegramInstagramTwitterfacebooklinkedin
          App Store Google Play Google Play
          Products
          Charts

          Chats

          Q&A with Experts
          Screeners
          Economic Calendar
          Data
          Tools
          Membership
          Features
          Function
          Markets
          Copy Trading
          Latest Signals
          Contests
          News
          Analysis
          24/7
          Columns
          Education
          Company
          Careers
          About Us
          Contact Us
          Advertising
          Help Center
          Feedback
          User Agreement
          Privacy Policy
          Personal Information Protection Statement
          Business

          White Label

          Data API

          Web Plug-ins

          Poster Maker

          Affiliate Program

          Risk Disclosure

          The risk of loss in trading financial instruments such as stocks, FX, commodities, futures, bonds, ETFs and crypto can be substantial. You may sustain a total loss of the funds that you deposit with your broker. Therefore, you should carefully consider whether such trading is suitable for you in light of your circumstances and financial resources.

          No decision to invest should be made without thoroughly conducting due diligence by yourself or consulting with your financial advisors. Our web content might not suit you since we don't know your financial conditions and investment needs. Our financial information might have latency or contain inaccuracy, so you should be fully responsible for any of your trading and investment decisions. The company will not be responsible for your capital loss.

          Without getting permission from the website, you are not allowed to copy the website's graphics, texts, or trademarks. Intellectual property rights in the content or data incorporated into this website belong to its providers and exchange merchants.

          Not Logged In

          Log in to access more features

          FastBull Membership

          Not yet

          Purchase

          Become a signal provider
          Help Center
          Customer Service
          Dark Mode
          Price Up/Down Colors

          Log In

          Sign Up

          Position
          Layout
          Fullscreen
          Default to Chart
          The chart page opens by default when you visit fastbull.com